US2000 H4 | Bullish Continuation SetupBased on the H4 chart analysis, we could see the price fall to our buy entry level at 2,660.36, which is an overlap support.
Our stop loss is set at 2,632.04, which is a pullback support that aligns with the 50% Fibonacci retracement.
Our take profit is set at 2,728.88, which is a swing high resistance.
High Risk Investment Warning
Stratos Markets Limited fxcm.com Stratos Europe Ltd fxcm.com
CFDs are complex instruments and come with a high risk of losing money rapidly due to leverage. 69% of retail investor accounts lose money when trading CFDs with this provider. You should consider whether you understand how CFDs work and whether you can afford to take the high risk of losing your money.
Stratos Global LLC fxcm.com Losses can exceed deposits.
Please be advised that the information presented on TradingView is provided to FXCM (‘Company’, ‘we’) by a third-party provider (‘TFA Global Pte Ltd’). Please be reminded that you are solely responsible for the trading decisions on your account. Any information and/or content is intended entirely for research, educational and informational purposes only and does not constitute investment or consultation advice or investment strategy. The information is not tailored to the investment needs of any specific person and therefore does not involve a consideration of any of the investment objectives, financial situation or needs of any viewer that may receive it. Past performance is not a reliable indicator of future results. Actual results may differ materially from those anticipated in forward-looking or past performance statements. We assume no liability as to the accuracy or completeness of any of the information and/or content provided herein and the Company cannot be held responsible for any omission, mistake nor for any loss or damage including without limitation to any loss of profit which may arise from reliance on any information supplied by TFA Global Pte Ltd.
Stratos Trading Pty. Limited fxcm.com
Trading FX/CFDs carries significant risks. FXCM AU (AFSL 309763), please read the Financial Services Guide, Product Disclosure Statement, Target Market Determination and Terms of Business at fxcm.com
Us2000

RUSSELL 17-year Channel Up starting a correction.Two weeks ago (January 23, see chart below) we gave a Sell Signal on Russell 2000 (RUT) that turned out to be very timely and is about to hit our 2550 short-term Target:
Today we move back to the macro setting on the 1M time-frame as the market seems overheated on the long-term following a flawless rally of successive green candles since the April 2025 Low. That Low was on the 1M MA100 (green trend-line), the long-term Support trend-line that also priced the October 2023 Low and since October 2011 it only broke during the March 2020 COVID crash.
As you can see, the 1M RSI is just below a long-term Lower Highs trend-line (Bearish Divergence) and every time the market peaked, it corrected back to at least its 1M MA50 (blue trend-line) and its 0.382 Fibonacci retracement level. This has taken place 4 times out of 4 within the dominant 17-year Channel Up.
As a result, we expect 2026 to be a year of correction for Russell, targeting the 0.382 Fib and 1M MA50 (at least) at 2245.
---
** Please LIKE 👍, FOLLOW ✅, SHARE 🙌 and COMMENT ✍ if you enjoy this idea! Also share your ideas and charts in the comments section below! This is best way to keep it relevant, support us, keep the content here free and allow the idea to reach as many people as possible. **
---
💸💸💸💸💸💸
👇 👇 👇 👇 👇 👇

US2000 Index | Trend-Aligned Long Opportunity🎯 Russell 2000 (US2000) CFD – Bullish Breakout Setup | Day/Swing Trade Strategy 📈
🔥 MARKET OVERVIEW & OPPORTUNITY
The Russell 2000 Index (US2000) is flashing a strong bullish continuation setup! 💪 Clean pullback to the Simple Moving Average (SMA) has been confirmed, giving us a high-probability entry zone for both day traders and swing traders looking to ride the momentum wave. 🌊
This isn't financial advice—this is the Thief OG method 🦹♂️💰: stealth entries, layered limits, and strategic exits before the police (resistance zones) shut down the party! 🚨
📊 TRADE PLAN BREAKDOWN
🟢 BIAS: BULLISH ✅
Confirmation: Price respecting SMA pullback structure + momentum building 🚀
🎯 ENTRY STRATEGY (Thief's Limit Layer Method):
You can enter at ANY price level if you're aggressive, but the OG Thief strategy uses limit orders to stack entries like a pro:
🛡️ Layer 1: 2620
🛡️ Layer 2: 2630
🛡️ Layer 3: 2640
🛡️ Layer 4: 2650
Why limits? Scale in like a smart money player—don't chase, let the market come to YOU. 😎
🎯 TAKE PROFIT TARGETS (Escape Before The Cops Arrive! 🚔)
The police force (resistance zones) are waiting above, along with overbought conditions, bull traps, and correlation resistance. Here's where you grab your bag and RUN:
✅ TP1: 2690 – "First liquidity grab completed" 💵
✅ TP2: 2740 – "Final liquidity sweep — exit complete!" 💰🏃♂️
⚠️ Note to Thief OG's (Ladies & Gentlemen): I'm NOT telling you to blindly follow my TPs. YOUR money = YOUR rules. Take profits when YOU feel comfortable. Trade at your own risk! 🎲
🛑 STOP LOSS (Thief's Safety Net):
🔻 SL: 2600 – Cut it loose if this level breaks. No emotional attachments! 💔
⚠️ Note to Thief OG's: Again, this is MY stop loss zone. You do YOU. Manage your risk like the boss you are. 👑
💹 RELATED PAIRS TO WATCH (Correlation Game 🔗)
Keep your eyes on these correlated markets for confirmation & confluence:
📈 SPY (S&P 500 ETF) – Broad market sentiment leader
📈 QQQ (Nasdaq-100 ETF) – Tech-heavy momentum gauge
📈 IWM (iShares Russell 2000 ETF) – Direct tracking of US2000
💵 DXY (US Dollar Index) – Inverse correlation; weak dollar = strong equities
🛢️ Crude Oil (WTI) – Risk-on sentiment & inflation hedge correlation
Key Correlation Insight: If SPY & QQQ are pumping with weak DXY, expect US2000 to follow the bullish wave! 🌊📊
📰 FUNDAMENTAL & ECONOMIC FACTORS (What's Moving The Market?)
🔍 Recent News Drivers:
✅ Fed Policy Stance: Dovish tone or rate pause = bullish for small-cap equities like Russell 2000
✅ Economic Data: Strong jobs reports, consumer spending, or GDP growth = risk-on rally 🚀
✅ Earnings Season: Watch small-cap earnings surprises—big movers for IWM/US2000
📅 Upcoming Events to Monitor:
🗓️ FOMC Minutes Release – Central bank commentary impacts volatility
🗓️ CPI/PPI Data – Inflation numbers dictate Fed's next move
🗓️ Weekly Jobless Claims – Employment strength = small-cap confidence
💡 Thief Tip: If economic data leans risk-on, this trade setup gets EXTRA juice! 🍹
🦹♂️ THIEF TRADER STYLE: MOTIVATION & WISDOM 💎
"The market rewards patience, punishes greed, and respects the disciplined thief who knows when to enter... and when to escape." 🏴☠️💰
"Don't chase the train—build the station and let it come to you. Limit orders > FOMO entries." 🚂✨
"Profits are made in the plan, not the impulse. Trust your setup, manage your risk, and live to trade another day." 🎯🔥
⚠️ FINAL DISCLAIMER (Real Talk 🗣️)
This is NOT financial advice. This is a trading idea based on technical analysis, market structure, and the Thief OG method. 🦹♂️
✅ Do your own research (DYOR)
✅ Manage your risk
✅ Trade what YOU see, not what you HOPE
YOUR MONEY = YOUR RESPONSIBILITY. 💼
🚀 LET'S GET THIS BAG, THIEF OG's! 💰🔥
Drop a 🚀 if you're riding this setup!
Drop a 👍 if you vibe with the Thief method!
Stay sharp. Stay profitable. Stay FREE. 🦅✨

US2000 H1 | Bullish Bounce OffThe price has bounced off our buy entry level at 2,641.87, which is a pullback support.
Our stop loss is set at 2,600.84, which is a pullback support that aligns with the 78.6% Fibonacci retracement.
Our take profit is set at 2,708.35, which is a pullback resistance.
High Risk Investment Warning
Stratos Markets Limited fxcm.com Stratos Europe Ltd fxcm.com
CFDs are complex instruments and come with a high risk of losing money rapidly due to leverage. 69% of retail investor accounts lose money when trading CFDs with this provider. You should consider whether you understand how CFDs work and whether you can afford to take the high risk of losing your money.
Stratos Global LLC fxcm.com Losses can exceed deposits.
Please be advised that the information presented on TradingView is provided to FXCM (‘Company’, ‘we’) by a third-party provider (‘TFA Global Pte Ltd’). Please be reminded that you are solely responsible for the trading decisions on your account. Any information and/or content is intended entirely for research, educational and informational purposes only and does not constitute investment or consultation advice or investment strategy. The information is not tailored to the investment needs of any specific person and therefore does not involve a consideration of any of the investment objectives, financial situation or needs of any viewer that may receive it. Past performance is not a reliable indicator of future results. Actual results may differ materially from those anticipated in forward-looking or past performance statements. We assume no liability as to the accuracy or completeness of any of the information and/or content provided herein and the Company cannot be held responsible for any omission, mistake nor for any loss or damage including without limitation to any loss of profit which may arise from reliance on any information supplied by TFA Global Pte Ltd.
Stratos Trading Pty. Limited fxcm.com
Trading FX/CFDs carries significant risks. FXCM AU (AFSL 309763), please read the Financial Services Guide, Product Disclosure Statement, Target Market Determination and Terms of Business at fxcm.com

US2000 H1 | Bearish Reversal SetupBased on the H1 chart analysis, we could see the price rise towards our sell entry level at 2,692.02, which is a pullback resistance that aligns with the 50% Fibonacci retracement.
Our stop loss is set at 2,738.46, which is a swing high resistance.
Our take profit is set at 2,626.00, which is a multi swing low support.
High Risk Investment Warning
Stratos Markets Limited fxcm.com Stratos Europe Ltd fxcm.com
CFDs are complex instruments and come with a high risk of losing money rapidly due to leverage. 69% of retail investor accounts lose money when trading CFDs with this provider. You should consider whether you understand how CFDs work and whether you can afford to take the high risk of losing your money.
Stratos Global LLC fxcm.com Losses can exceed deposits.
Please be advised that the information presented on TradingView is provided to FXCM (‘Company’, ‘we’) by a third-party provider (‘TFA Global Pte Ltd’). Please be reminded that you are solely responsible for the trading decisions on your account. Any information and/or content is intended entirely for research, educational and informational purposes only and does not constitute investment or consultation advice or investment strategy. The information is not tailored to the investment needs of any specific person and therefore does not involve a consideration of any of the investment objectives, financial situation or needs of any viewer that may receive it. Past performance is not a reliable indicator of future results. Actual results may differ materially from those anticipated in forward-looking or past performance statements. We assume no liability as to the accuracy or completeness of any of the information and/or content provided herein and the Company cannot be held responsible for any omission, mistake nor for any loss or damage including without limitation to any loss of profit which may arise from reliance on any information supplied by TFA Global Pte Ltd.
Stratos Trading Pty. Limited fxcm.com
Trading FX/CFDs carries significant risks. FXCM AU (AFSL 309763), please read the Financial Services Guide, Product Disclosure Statement, Target Market Determination and Terms of Business at fxcm.com

RUSSELL Overbought for the 3rd time in 7 months. Sell.Last time we had a look at Russell 2000 (RUT) was 2 months ago (November 28 2025, see chart below) where we gave a strong Buy Signal that quickly hit our 2600 Target:
This time, with the price approaching the top (Higher Highs trend-line) of its 10-month Channel Up, the technical sentiment turns bearish again. The maximum a Bullish Leg rose by within this pattern was +21.74% (its 1st) and since the 1D RSI got overbought for the 3rd time in 7 months (the previous two were Higher High tops), we expect the index to start a new Bearish Leg soon.
The last two Bearish Legs pulled back and hit at least their 0.5 Fibonacci levels. Even from a potential +21.50% max, that gives us a 2550 Target for the short-term, which won't only be a Higher Low bottom for the Channel Up, but will also test the 1D MA100 (green trend-line).
---
** Please LIKE 👍, FOLLOW ✅, SHARE 🙌 and COMMENT ✍ if you enjoy this idea! Also share your ideas and charts in the comments section below! This is best way to keep it relevant, support us, keep the content here free and allow the idea to reach as many people as possible. **
---
💸💸💸💸💸💸
👇 👇 👇 👇 👇 👇

US2000 H4 | Bullish Momentum To Extend?Based on the H4 chart analysis, we could see the fall to our buy entry level at 2,601.61, which is a pullback support that is slightly above the 50% Fibonacci retracemnt.
Our stop loss is set at 2,554.64, which is a pullback support that aligns with the 61.8% Fibonacci retracement.
Our take profit is set at 2,687.99, which is a swing high resistance.
High Risk Investment Warning
Stratos Markets Limited (fxcm.com/uk), Stratos Europe Ltd (fxcm.com/eu):
CFDs are complex instruments and come with a high risk of losing money rapidly due to leverage. 69% of retail investor accounts lose money when trading CFDs with this provider. You should consider whether you understand how CFDs work and whether you can afford to take the high risk of losing your money.
Stratos Global LLC (fxcm.com/en): Losses can exceed deposits.
Please be advised that the information presented on TradingView is provided to FXCM (‘Company’, ‘we’) by a third-party provider (‘TFA Global Pte Ltd’). Please be reminded that you are solely responsible for the trading decisions on your account. Any information and/or content is intended entirely for research, educational and informational purposes only and does not constitute investment or consultation advice or investment strategy. The information is not tailored to the investment needs of any specific person and therefore does not involve a consideration of any of the investment objectives, financial situation or needs of any viewer that may receive it. Past performance is not a reliable indicator of future results. Actual results may differ materially from those anticipated in forward-looking or past performance statements. We assume no liability as to the accuracy or completeness of any of the information and/or content provided herein and the Company cannot be held responsible for any omission, mistake nor for any loss or damage including without limitation to any loss of profit which may arise from reliance on any information supplied by TFA Global Pte Ltd.
Stratos Trading Pty. Limited (fxcm.com/au):
Trading FX/CFDs carries significant risks. FXCM AU (AFSL 309763), please read the Financial Services Guide, Product Disclosure Statement, Target Market Determination and Terms of Business at fxcm.com/au

Russell 2000 Bullish Bias | Accumulation Before Expansion🎯 US2000 (Russell 2000) Index CFD | Bullish Swing Trade Setup 📈
🔥 MARKET OPPORTUNITY: Small-Cap Breakout Play 🔥
📊 TRADE PLAN OVERVIEW
Strategy: Bullish Accumulation → Resistance Breakout → Re-accumulation Zone
Timeframe: Swing Trade (Multi-day to weeks)
Technical Confirmation: Simple Moving Average (SMA) pullback creating accumulation zone + Overbought resistance breakout signaling continuation momentum
💰 ENTRY STRATEGY: "THIEF LAYERING METHOD" 💰
⚡ Multi-Limit Order Layering Strategy (DCA Style) ⚡
Instead of a single entry, we're using multiple buy limit orders to build our position strategically:
🎯 Layer 1: 2560
🎯 Layer 2: 2580
🎯 Layer 3: 2600
💡 Pro Tip: You can add MORE layers based on your capital and risk appetite! This "ladder entry" approach averages your cost and reduces timing risk during volatile accumulation phases.
🚨 OR: Market Entry Available - Jump in at ANY current price level if you prefer aggressive entry over layering!
🛡️ RISK MANAGEMENT
Stop Loss (Thief's SL): 2530 ⛔
⚠️ IMPORTANT DISCLAIMER:
Dear Ladies & Gentlemen (Thief OG's) 👋 - This is MY stop loss level based on technical invalidation. You are NOT required to follow my exact SL! Adjust according to YOUR risk tolerance, account size, and trading psychology. Trade at your own risk. Your money, your rules! 💪
🎯 PROFIT TARGETS
Target Zone (TP): 2660 🚀
🚔 "Police Force" Resistance Alert:
This level acts as strong resistance + overbought zone + potential bull trap area + correlation pressure point. Smart money takes profits here! Don't be greedy - ESCAPE WITH PROFITS when we hit this zone! 💵
⚠️ IMPORTANT DISCLAIMER:
Dear Ladies & Gentlemen (Thief OG's) 👋 - This is MY take profit target. You are NOT required to follow my exact TP! Scale out partially, move SL to breakeven, or hold for extended targets - it's YOUR choice. Your money, your decision! 🎲
🔗 CORRELATED ASSETS TO WATCH 📡
Monitor these pairs for confluence and risk-on/risk-off sentiment:
💵 TVC:DXY (US Dollar Index) - Inverse correlation; weak dollar = strong equities
📈 SP:SPX (S&P 500) - Broad market sentiment gauge
📊 NASDAQ:NDX (Nasdaq 100) - Tech-heavy index correlation
🏦 AMEX:IWM (iShares Russell 2000 ETF) - Direct ETF tracking Russell 2000
⚡ TVC:VIX (Volatility Index) - Fear gauge; rising VIX = caution for longs
🛢️ BLACKBULL:WTI (Crude Oil) - Risk-on asset correlation
💰 FX:USDJPY - Risk sentiment barometer; weakness supports equities
🏦 AMEX:XLF (Financial Sector ETF) - Russell 2000 has heavy financial exposure
📰 FUNDAMENTAL & ECONOMIC FACTORS 🌍
✅ Bullish Catalysts to Consider:
1️⃣ Federal Reserve Policy Easing 🏦
If Fed maintains dovish stance or signals rate cuts, small-caps (Russell 2000) typically outperform as they're more sensitive to borrowing costs
2️⃣ Economic Soft Landing Narrative 📉➡️📈
If inflation cools without recession, domestic-focused small-caps benefit heavily
3️⃣ Dollar Weakness 💵⬇️
Falling DXY supports risk assets; Russell 2000 tends to rally when USD weakens
4️⃣ Earnings Season Performance 📊
Monitor upcoming small-cap earnings reports; positive surprises fuel momentum
5️⃣ Banking Sector Stability 🏦✅
Russell 2000 has significant financial exposure; stable/rising financials = bullish for index
⚠️ Bearish Risks to Monitor:
1️⃣ Recession Fears 📉😰
Small-caps underperform during economic contraction; watch GDP, unemployment data
2️⃣ Fed Hawkish Surprise 🦅📈
Higher-for-longer rates hurt small-caps disproportionately (debt-heavy balance sheets)
3️⃣ Credit Market Stress 💳⚠️
Rising corporate bond yields or credit spreads = danger for leveraged small-caps
4️⃣ Geopolitical Tensions 🌍💥
Trade wars, conflicts = risk-off sentiment = exodus from small-caps
5️⃣ Strong Dollar Rally 💵🚀
DXY strength typically pressures equities, especially domestic-focused Russell 2000
📅 UPCOMING KEY EVENTS TO WATCH 🗓️
🔔 Fed Meeting Minutes/Speeches - Any policy shift hints
🔔 CPI/PPI Inflation Data - Inflation trajectory crucial for rate policy
🔔 Non-Farm Payrolls (NFP) - Employment strength = economic health gauge
🔔 Small-Cap Earnings Reports - Watch Russell 2000 component earnings
🔔 ISM Manufacturing/Services PMI - Economic activity indicators
🔔 Regional Banking Sector Updates - Financial stability matters for IWM
🎓 KEY TECHNICAL POINTS 🔍
✅ SMA Pullback = Healthy Accumulation - Price retracing to moving average shows institutional buying interest
✅ Overbought Breakout - Previous resistance becomes new support after successful break
✅ Re-accumulation Phase - Consolidation above breakout = continuation pattern
✅ Volume Confirmation - Watch for increasing volume on bullish moves (not shown but critical!)
✅ Risk-Reward Favorable - Layered entry provides cushion; defined exit at 2660
🚨 FINAL THIEF OG WISDOM 🚨
💎 "The market doesn't care about your entry price - it only cares about supply and demand."
📌 Risk Management > Being Right
📌 Patience > Precision
📌 Profits > Predictions
Not financial advice. Trade responsibly. Always use stop losses. Never risk more than you can afford to lose! 🛡️
🔥 LIKE + FOLLOW for more Thief OG setups! 🔥
💬 Drop your thoughts below - Are YOU bullish on small-caps? 💬

US2000 H4 | Bullish bounce offBased on the H4 chart analysis, we could see the price fall to our buy entry level at 2,538.01, which is a pullback support that aligns with the 50% FIbonacci retracement.
Our stop loss is set at 2,504.43, which is a pullback support that aligns with the 78.6% Fibonacci retracement.
Our take profit is set at 2,589.09, which is a pullback resistance.
High Risk Investment Warning
Stratos Markets Limited (

US2000 H4 | Falling Towards Key SupportThe price is falling towards our buy entry level at 2,479.37, which is an overlap support that aligns with the 38.2% Fibonacci retracement.
Our Stop loss is set at 2,449.15, which aligns with the 50% Fibonacci retracement.
Our take profit is set at 2,538.48, which is a pullback resistance.
High Risk Investment Warning
Stratos Markets Limited (

US2000 H4 | Falling Towards Pullback SupportMomentum: Bullish
The price is falling towards the buy entry, which aligns with the 38.2% Fibonacci retracement and also trading above the Ichimoku cloud, a good sign of bullish momentum.
Buy entry: 2,538.22
Pullback support
38.2% Fibonacci retracement
Stop loss: 2,499.78
Overlap support
Take profit: 2,600.83
Swing high resistance
High Risk Investment Warning
Stratos Markets Limited (tradu.com ), Stratos Europe Ltd (tradu.com ):
CFDs are complex instruments and come with a high risk of losing money rapidly due to leverage. 70% of retail investor accounts lose money when trading CFDs with this provider. You should consider whether you understand how CFDs work and whether you can afford to take the high risk of losing your money.
Stratos Global LLC (tradu.com ): Losses can exceed deposits.
Please be advised that the information presented on TradingView is provided to Tradu (‘Company’, ‘we’) by a third-party provider (‘TFA Global Pte Ltd’). Please be reminded that you are solely responsible for the trading decisions on your account. Any information and/or content is intended entirely for research, educational and informational purposes only and does not constitute investment or consultation advice or investment strategy. The information is not tailored to the investment needs of any specific person and therefore does not involve a consideration of any of the investment objectives, financial situation or needs of any viewer that may receive it. Past performance is not a reliable indicator of future results. Actual results may differ materially from those anticipated in forward-looking or past performance statements. We assume no liability as to the accuracy or completeness of any of the information and/or content provided herein and the Company cannot be held responsible for any omission, mistake nor for any loss or damage including without limitation to any loss of profit which may arise from reliance on any information supplied by TFA Global Pte Ltd.

US2000 ATH idea Q1-early Q2 2026I applied the fractal from the last cycle when FX:US2000 put the peak, look how it repeats the structure with a false breakdown exactly like in 21 and what synchronization on the corrections in the current cycle.
if we look at the fractal, we can assume that ath will be put in the range of 3000-3400.

Can the Russell 2000 Lead the Next Bull Wave Above Resistance?📊 RUSSELL 2000: The Ultimate Small-Cap Breakout Blueprint 🚀💰
🎯 Market Overview: IWM Russell 2000 Index Analysis
The Russell 2000 (RUT/IWM) is setting up for what could be a chef's kiss momentum play! 🧑🍳✨ We're tracking a bullish continuation setup backed by triangular moving average confluence and a classic pullback-to-breakout pattern. Small-caps are flexing, and this technical structure screams opportunity for swing and day traders alike.
📈 The Trade Setup (Swing/Day Strategy)
Bias: 🟢 BULLISH
Confirmation: Triangular moving average pullback + volume expansion
Key Level to Watch: 2550.0 (Overbought resistance zone breakout)
🎯 Entry Strategy: Layered Scaling Approach
Primary Entry: Post-breakout above 2550.0 ✅
⚡ Pro Tip: Set price alerts on your platform to catch the breakout in real-time without staring at charts all day!
Layered Entry Levels (Scaling In):
🔹 2500.0
🔹 2510.0
🔹 2520.0
🔹 2530.0
🔹 2540.0
This scaling approach allows you to build your position gradually while managing risk like a pro. 🧠💼
🛑 Risk Management Zone
Stop Loss: 2480.0 🔴
⚠️ Disclaimer: This is MY stop-loss based on technical structure. YOU manage your own risk tolerance! Trade smart, not reckless. Your capital, your rules. 💯
🎯 Profit Target Zone
Target: 2610.0 🎯💰
This zone represents confluence of:
Strong historical resistance
Overbought territory
Potential bull trap zone (watch for exhaustion!)
⚠️ Profit-Taking Note: Lock in gains as we approach target. Don't get greedy—pigs get fed, hogs get slaughtered! 🐷🔪 This is MY target, but YOU decide when to secure profits based on YOUR strategy.
🔗 Related Markets & Correlation Watch
Keep an eye on these correlated assets for confirmation:
Direct Exposure:
AMEX:IWM (iShares Russell 2000 ETF) - Primary tracking vehicle
TVC:RUT (Russell 2000 Index Futures)
Correlation Plays:
AMEX:SPY (S&P 500) - Broad market sentiment gauge
NASDAQ:QQQ (Nasdaq-100) - Tech/growth sector correlation
AMEX:DIA (Dow Jones) - Large-cap comparison
Key Correlation Note: Russell 2000 typically outperforms during risk-on environments and underperforms large-caps during risk-off. Watch for small-cap premium expansion as confirmation of bullish thesis. When IWM/IWM/
IWM/SPY ratio rises, small-caps are leading—bullish for RUT! 📊🔥
Economic Indicators:
TVC:DXY (US Dollar Index) - Inverse correlation (weak dollar = small-cap strength)
TVC:TNX (10-Year Treasury Yield) - Interest rate sensitivity
Regional bank stocks (small-cap economy proxy)
🔑 Key Technical Points
✅ Triangular MA Pullback Complete - Classic retest of support
✅ Volume Profile - Accumulation zone established
✅ 2550.0 Resistance - Break and hold = explosive upside
✅ Risk/Reward Ratio - ~1:1.5+ (70 points risk / 110+ points reward)
✅ Timeframe Alignment - Multi-timeframe confluence supporting the move
⚡ The Thief's Edge: Why This Setup Works
Small-caps are the wild horses of the market—volatile, fast, and rewarding when you ride the trend! 🐎💨 The Russell 2000 represents domestic US growth plays, making it hyper-sensitive to:
Economic optimism cycles
Federal Reserve policy shifts
Risk appetite rotations
This setup capitalizes on momentum continuation after a healthy pullback. We're not catching falling knives—we're riding tested support into breakout territory! 🎯
🧠 Trading Psychology Corner
Remember, folks: The market doesn't care about your entry price. It only cares about supply and demand. Manage risk, scale into winners, and cut losers fast. This isn't financial advice—this is a battle-tested framework for market participants who understand probability over certainty. 🎲📉📈
🙏 Support the Analysis!
✨ If you find value in my analysis, a 👍 and 🚀 boost is much appreciated — it helps me share more setups with the community!
#Russell2000 #RUT #IWM #SmallCaps #TechnicalAnalysis #SwingTrading #DayTrading #Breakout #TriangularMA #MomentumTrading #StockMarket #IndexTrading #TradingStrategy #ChartAnalysis #PriceAction #SupportAndResistance #BullishSetup #TradingView #MarketAnalysis #RiskManagement
Stay sharp, trade smart, and let's catch this wave together! 🌊💰

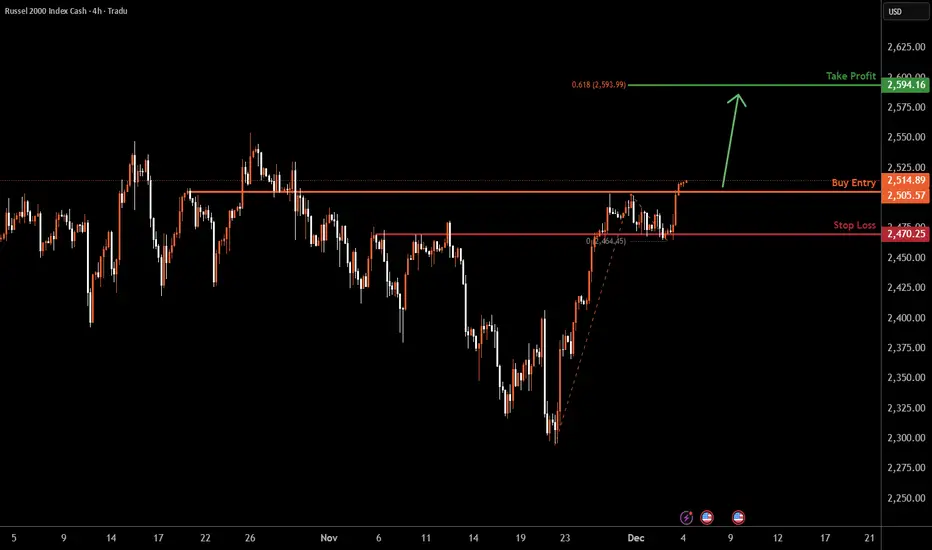
US2000 H4 | Bullish Momentum To ExtendMomentum: Bullish
Price has reacted well off the buy-entry level, which also aligns with an overlap support level.
Buy Entry: 2,513.55
Overlap support
Stop Loss: 2,470.25
Overlap support
Take Profit: 2,594.16
61.8% Fibonacci projection
High Risk Investment Warning
Stratos Markets Limited (tradu.com ), Stratos Europe Ltd (tradu.com ):
CFDs are complex instruments and come with a high risk of losing money rapidly due to leverage. 70% of retail investor accounts lose money when trading CFDs with this provider. You should consider whether you understand how CFDs work and whether you can afford to take the high risk of losing your money.
Stratos Global LLC (tradu.com ): Losses can exceed deposits.
Please be advised that the information presented on TradingView is provided to Tradu (‘Company’, ‘we’) by a third-party provider (‘TFA Global Pte Ltd’). Please be reminded that you are solely responsible for the trading decisions on your account. Any information and/or content is intended entirely for research, educational and informational purposes only and does not constitute investment or consultation advice or investment strategy. The information is not tailored to the investment needs of any specific person and therefore does not involve a consideration of any of the investment objectives, financial situation or needs of any viewer that may receive it. Past performance is not a reliable indicator of future results. Actual results may differ materially from those anticipated in forward-looking or past performance statements. We assume no liability as to the accuracy or completeness of any of the information and/or content provided herein and the Company cannot be held responsible for any omission, mistake nor for any loss or damage including without limitation to any loss of profit which may arise from reliance on any information supplied by TFA Global Pte Ltd.
US2000 Momentum Rebuilds After Triangular MA Retest🚀 US2000 Bullish Setup – Triangular MA Pullback Play (Layered Entry Blueprint) 🚀
✨ Asset: US2000 – Small-Cap U.S. Index
📅 Trade Style: Day / Swing
🎯 Bias: Bullish Continuation confirmed through Triangular Moving Average Pullback
📌 Trade Plan – Clean & Clear
📈 Bullish Structure Confirmed
The price retest on the Triangular Moving Average shows buyers stepping in aggressively, signalling a strong continuation phase. This is where momentum traders and swing players gain the best advantage.
🧠 Thief Strategy – Layered Limit Entries (Multi-Order Method)
To manage volatility + trap liquidity like a pro, we use layered buy limits.
🔽 Buy Limit Layers (Flexible Based on Your Style):
2470
2480
2490
2500
(Feel free to add more layers based on your own capital, risk model, or spread environment.)
This layered technique helps you:
⚡ Catch deeper pullbacks
⚡ Reduce average entry cost
⚡ Beat market whipsaws
⚡ Accumulate position silently like a true OG
🛑 Stop Loss – Safety First
SL: 2450
Dear Ladies & Gentlemen (Thief OGs), adjust this SL as per your strategy, risk appetite, and volatility conditions.
This is not a forced SL — your account, your rules.
🎯 Target – Exit with Profits, Not with Ego
Our take-profit sits near:
TP: 2570
Why?
🔼 Moving averages above are acting as a strong dynamic resistance zone
🔼 Market nearing overbought territory
🔼 Potential bull trap zone, so escape elegantly with profits
Again, OGs — your TP is your own choice. Manage your bag with discipline.
📊 Market Psychology & Structure Insight
The US2000 typically reacts faster to sentiment compared to big indices like SPX or NASDAQ because small-caps absorb liquidity shocks quicker.
This bullish pullback presents a classic “buy the dip into MA” play — a favourite among swing traders.
🌐 Related Pairs To Watch (Correlation Keynotes)
💵 SP:SPX / AMEX:SPY (S&P 500)
Strong positive correlation
If SPX is bullish, US2000 usually follows with stronger momentum
Watch SPX’s 4H trend for confirmation
📈 NASDAQ:NDX / NASDAQ:QQQ (NASDAQ 100)
When tech rallies, small-caps often catch delayed momentum
A strong NASDAQ risk-on pulse boosts US2000 sentiment
📉 TVC:DXY (U.S. Dollar Index)
Inverse correlation
Weak DXY boosts equities (US2000 included)
If DXY drops, small-cap indices often pump harder
TVC:VIX (Volatility Index)
Direct risk-sentiment indicator
Falling VIX = bullish for US2000
Rising VIX = be cautious with new entries
💼 TVC:DJI (Dow Jones)
Large caps lead in stability
When Dow is stable/bullish → risk-on spillover increases small-cap flows
📝 Final Thought
This setup suits traders who love structured pullbacks, clean MA-based momentum, and layered entries. Manage risk, scale smart, and take profit with intention — not emotion.

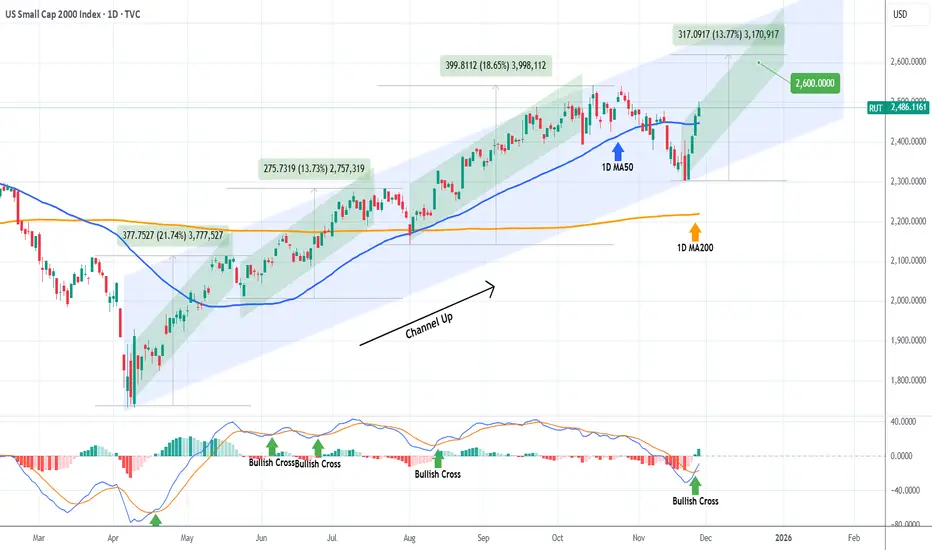
RUSSELL targeting 2600 on this Bullish Leg.Russell 2000 (RUT) has been trading within an 8-month Channel Up since the April 07 market bottom and following its latest correction (Bearish Leg), it recovered this week its 1D MA50 (blue trend-line), having already started the new Bullish Leg.
The minimum rise a Bullish Leg had within this pattern has been +13.73%. As a result, we expect the current one to hit at least 2600. Notice also the 1D MACD Bullish Cross, which has always been a confirmation of a new rally.
---
** Please LIKE 👍, FOLLOW ✅, SHARE 🙌 and COMMENT ✍ if you enjoy this idea! Also share your ideas and charts in the comments section below! This is best way to keep it relevant, support us, keep the content here free and allow the idea to reach as many people as possible. **
---
💸💸💸💸💸💸
👇 👇 👇 👇 👇 👇
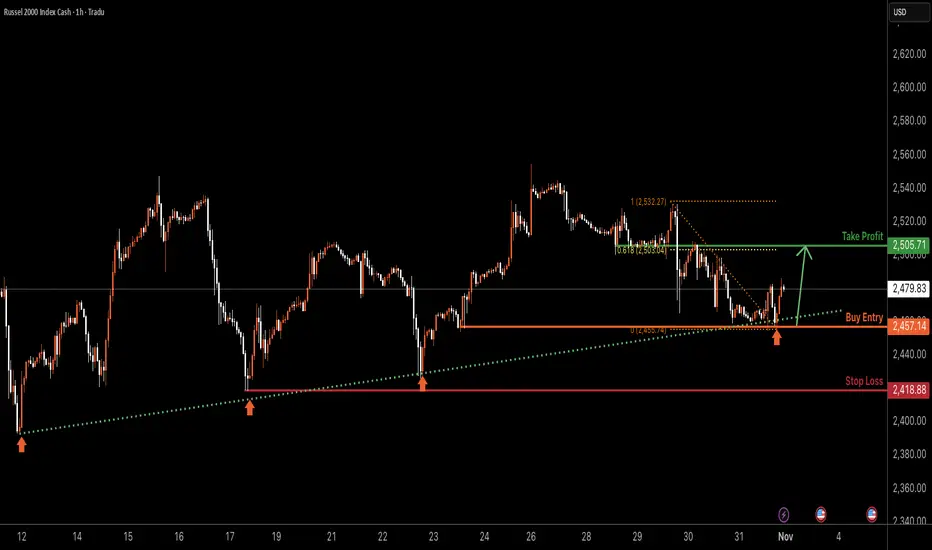
US2000 H1 | Bullish Bounce OffBased on the H1 chart analysis, we can see that the price has bounced off the buy entry, which is a pullback support and could rise from this level to the upside.
Buy entry is at 2,457.14, which is a pullback support.
Stop loss is at 2,418.88, which is a multi-swing low support.
Take profit is at 2,505.71, whic is an overlap resistance that aligns with the 61.8% Fibonacci retracement.
Stratos Markets Limited (tradu.com ):
CFDs are complex instruments and come with a high risk of losing money rapidly due to leverage. 68% of retail investor accounts lose money when trading CFDs with this provider. You should consider whether you understand how CFDs work and whether you can afford to take the high risk of losing your money.
Stratos Europe Ltd (tradu.com ):
CFDs are complex instruments and come with a high risk of losing money rapidly due to leverage. 70% of retail investor accounts lose money when trading CFDs with this provider. You should consider whether you understand how CFDs work and whether you can afford to take the high risk of losing your money.
US2000 H1 | Potential Bearish Drop Off US2000 has rejected the sell entry at 2,506.12, which is an overlap resistance and could drop from this level to the downside.
Stop loss is at 2,543.41, which is a swing high resistance.
Take profit is at 2,426.26, which is a multi swing low support.
Stratos Markets Limited (tradu.com ):
CFDs are complex instruments and come with a high risk of losing money rapidly due to leverage. 68% of retail investor accounts lose money when trading CFDs with this provider. You should consider whether you understand how CFDs work and whether you can afford to take the high risk of losing your money.
Stratos Europe Ltd (tradu.com ):
CFDs are complex instruments and come with a high risk of losing money rapidly due to leverage. 70% of retail investor accounts lose money when trading CFDs with this provider. You should consider whether you understand how CFDs work and whether you can afford to take the high risk of losing your money.

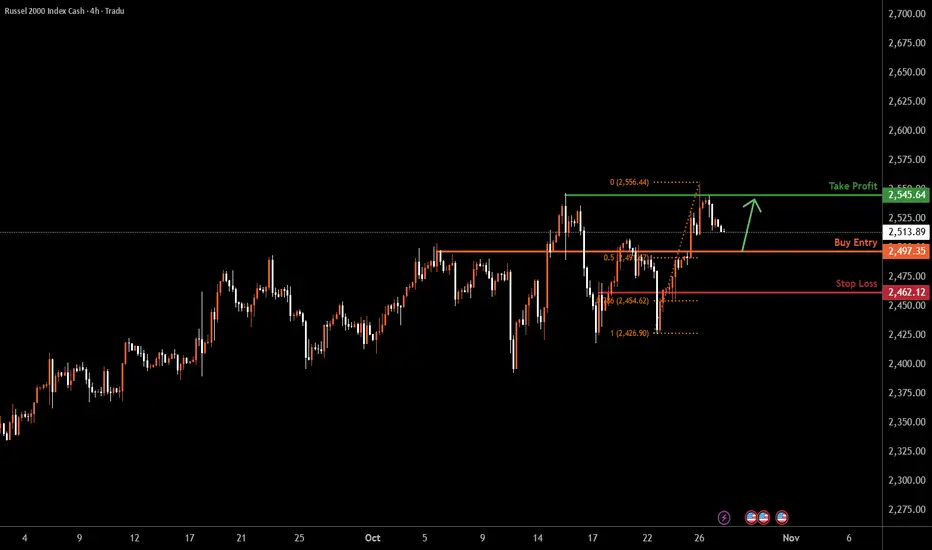
US2000 H4 | Bullish Bounce Off Key SupportUS2000 is falling towards the buy entry, which is an overlap support that aligns with the 50% Fibonacci retracement and could bounce from this level to the upside.
Buy entry is at 2,497.81, which is an overlap support that aligns with he 50% Fibonacci retracement.
Stop loss is at 2,462.12, whic is a pullback support that aligns with he 78.6% Fibonacci retracement.
Take profit is at 2,545.64, which is a multi swing high resistance.
Stratos Markets Limited (tradu.com ):
CFDs are complex instruments and come with a high risk of losing money rapidly due to leverage. 68% of retail investor accounts lose money when trading CFDs with this provider. You should consider whether you understand how CFDs work and whether you can afford to take the high risk of losing your money.
Stratos Europe Ltd (tradu.com ):
CFDs are complex instruments and come with a high risk of losing money rapidly due to leverage. 70% of retail investor accounts lose money when trading CFDs with this provider. You should consider whether you understand how CFDs work and whether you can afford to take the high risk of losing your money.
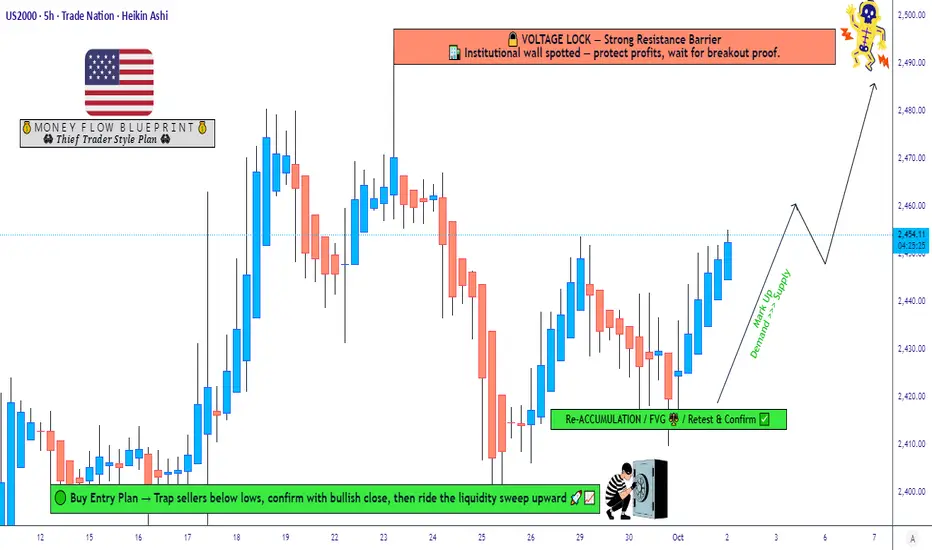
Can Small Caps Outperform as US2000 Approaches Resistance?📊 US2000 Index – Market Wealth Strategy Map (Swing/Day Trade)
Ladies & Gentlemen (Thief OG’s) – here’s a fresh layering entry plan for US2000 with a bullish outlook. This is my playful "Thief Strategy" style — multiple entries, multiple chances, and yes… multiple exits too. 😎
🔑 Plan: Bullish Bias
💸 Entry (Layering Style):
Limit Buy Orders: 2430 / 2440 / 2450
You can expand layers further depending on your own risk appetite.
👉 This layered entry style (a.k.a. Thief Strategy) spreads out execution points to reduce risk of missing the move.
🛡️ Stop Loss (SL):
Thief SL parked at 2410
⚠️ Note: This is my risk level. Please set your SL according to your own money management.
🎯 Target (TP):
2490 → “Voltage Lock” Zone ⚡ (Strong resistance barrier + overbought levels + possible trap area).
⚠️ Note: Not financial advice. I’m sharing my target, but your TP is your choice — secure profits as you see fit.
📌 Correlation Watchlist / Related Pairs:
OANDA:SPX500USD (S&P 500) → often leads the broader market sentiment.
TVC:DJI (Dow Jones 30) → check rotation between large caps vs small caps.
NASDAQ:NDX (Nasdaq 100) → tech moves can spill over into Russell small caps.
TVC:VIX (Volatility Index) → higher volatility can impact layered entries & SL triggers.
Correlation tip: When SP:SPX and NASDAQ:NDX are pumping together, US2000 often follows with strong momentum. But if TVC:VIX spikes, layered buys can get trapped near support levels.
📖 Key Notes:
Layering helps spread entries across multiple levels to avoid emotional panic buys.
The "Voltage Lock" resistance at 2490 is my escape zone. Don’t marry the trade — date it, profit, and leave. 💍➡️💵
This is a strategy style I use — not a recommendation. Trade safe.
✨ “If you find value in my analysis, a 👍 and 🚀 boost is much appreciated — it helps me share more setups with the community!”
📌 Disclaimer: This is a Thief Style Trading Strategy — shared just for fun & educational purposes. Not financial advice.
#US2000 #Russell2000 #SP500 #NASDAQ100 #DowJones #ThiefStrategy #SwingTrade #DayTrading #IndexTrading #TechnicalAnalysis
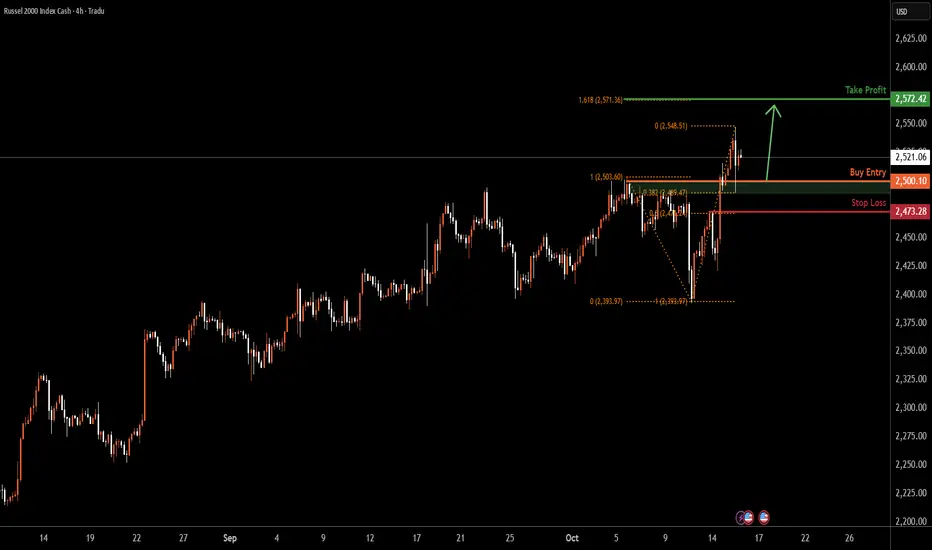
US2000 H4 | Price Rebounds from Key Support LevelUS2000 has bounced off the buy entry at 2,500.10, which is a pullback support that is slightly above the 38.2% Fibonacci retracement and could rise from this level to the upside.
Stop loss is at 2,473.28, which is a pullback support that lines up with he 50% Fibonacci retracement.
Take profit is at 2,572.42, which lines up with the 161.8% Fibonacci extension.
High Risk Investment Warning
Trading Forex/CFDs on margin carries a high level of risk and may not be suitable for all investors. Leverage can work against you.
Stratos Markets Limited (tradu.com ):
CFDs are complex instruments and come with a high risk of losing money rapidly due to leverage. 65% of retail investor accounts lose money when trading CFDs with this provider. You should consider whether you understand how CFDs work and whether you can afford to take the high risk of losing your money.
Stratos Europe Ltd (tradu.com ):
CFDs are complex instruments and come with a high risk of losing money rapidly due to leverage. 66% of retail investor accounts lose money when trading CFDs with this provider. You should consider whether you understand how CFDs work and whether you can afford to take the high risk of losing your money.
Stratos Global LLC (tradu.com ):
Losses can exceed deposits.
Please be advised that the information presented on TradingView is provided to Tradu (‘Company’, ‘we’) by a third-party provider (‘TFA Global Pte Ltd’). Please be reminded that you are solely responsible for the trading decisions on your account. There is a very high degree of risk involved in trading. Any information and/or content is intended entirely for research, educational and informational purposes only and does not constitute investment or consultation advice or investment strategy. The information is not tailored to the investment needs of any specific person and therefore does not involve a consideration of any of the investment objectives, financial situation or needs of any viewer that may receive it. Kindly also note that past performance is not a reliable indicator of future results. Actual results may differ materially from those anticipated in forward-looking or past performance statements. We assume no liability as to the accuracy or completeness of any of the information and/or content provided herein and the Company cannot be held responsible for any omission, mistake nor for any loss or damage including without limitation to any loss of profit which may arise from reliance on any information supplied by TFA Global Pte Ltd.
The speaker(s) is neither an employee, agent nor representative of Tradu and is therefore acting independently. The opinions given are their own, constitute general market commentary, and do not constitute the opinion or advice of Tradu or any form of personal or investment advice. Tradu neither endorses nor guarantees offerings of third-party speakers, nor is Tradu responsible for the content, veracity or opinions of third-party speakers, presenters or participants.
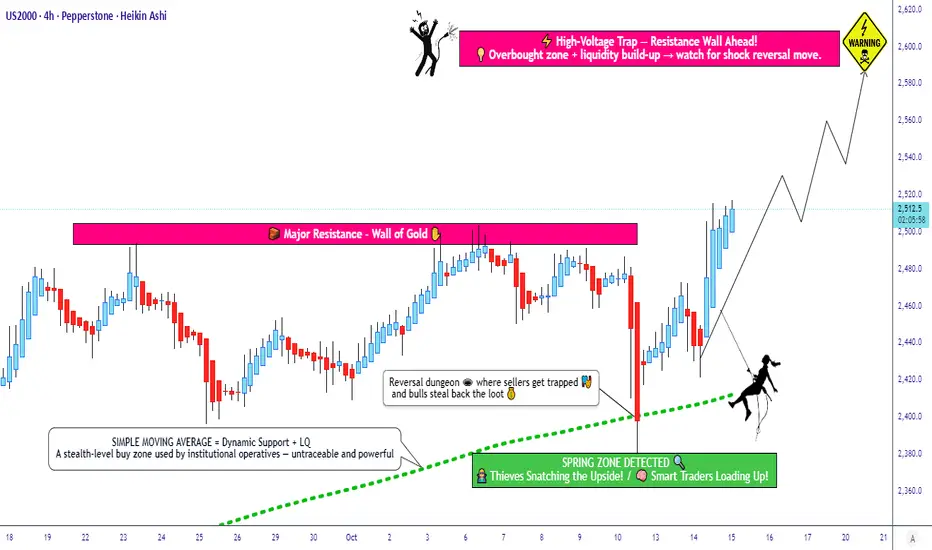
Is Smart Money Accumulating in US2000 Before the Next Move?🎯 RUSSELL 2000: Institutions Loading Up While You Sleep! 💰
📊 Asset Overview
US2000 / RUSSELL 2000 Index CFD - The small-cap kingmaker is showing serious institutional footprints!
🔥 The Setup: Bullish Retest at SMA
The Russell is doing that classic "look weak, go strong" move! 📈
We're seeing a textbook retest pullback at the Simple Moving Average - and guess who's quietly accumulating? The big money institutions! 🏦 While retail traders are panicking, the smart money is silently entering positions like ninjas in the night. 🥷
Translation: The trend is your friend, and right now that friend is buying the dip!
💎 The "Thief Strategy" Entry Plan
Layered Entry Approach 🎯
This isn't your grandma's single-entry strategy! We're using multiple limit orders (aka "The Thief Layering Method"):
Layer 1: 2440
Layer 2: 2460
Layer 3: 2480
Pro tip: Scale in like you're building a pyramid scheme, except this one actually makes money! 😂
Or: Jump in at current market price if you're feeling spicy 🌶️
🛡️ Risk Management
Stop Loss: 2420
⚠️ Thief's Disclaimer: This is MY stop loss based on MY risk tolerance. You do you! Manage your own risk like the responsible adult trader you are (or aspire to be). Take what makes sense for YOUR account size and sleep-at-night level.
🎯 Target Zone
Take Profit: 2600 🚀
Here's where it gets interesting - we've got a POLICE BARRICADE situation brewing! 🚨
What's a Police Barricade? It's when you've got:
✅ Strong resistance level
✅ Overbought conditions
✅ Potential trap zone for late buyers
The Game Plan: Secure those gains before the party gets too crowded! When you see 2600, that's your cue to take profits and live to trade another day.
Another Thief Disclaimer: This is MY target. You're the captain of your own ship! 🚢 If you want to take profits earlier or let it ride longer, that's YOUR call. Make money, then TAKE money - at your own risk and discretion!
🔗 Related Pairs to Watch
Keep your eyes on these correlated instruments:
AMEX:IWM (iShares Russell 2000 ETF)
Direct ETF tracking the Russell 2000
Higher liquidity for stock traders
Mirrors US2000 movement almost perfectly
AMEX:SPY (S&P 500 ETF)
Broad market correlation
Risk-on sentiment indicator
When SPY pumps, Russell often follows (with extra volatility!)
AMEX:DIA (Dow Jones ETF)
Blue-chip correlation check
Divergence signals can warn of small-cap weakness
NASDAQ:QQQ (Nasdaq-100 ETF)
Tech sector correlation
Russell 2000 often leads or lags based on risk appetite
📌 Key Correlation Insight: Russell 2000 is the risk-on barometer! When investors feel confident, small-caps outperform. When fear creeps in, they sell off harder than large-caps. Watch the broader indices for confirmation of market sentiment!
🎓 Technical Summary
Bias: Bullish 🐂
Setup Type: Retest/Pullback Entry
Strategy: Layered Entry (Thief Method)
Risk/Reward: Favorable with defined stops
Institutional Activity: Accumulation phase detected 🏦
⚡ The Bottom Line
This setup screams institutional accumulation! The smart money doesn't announce their entries on CNBC - they quietly load up while everyone else is distracted. Be the thief, not the victim! 🎭
Remember: Markets reward patience and punish FOMO. Layer in, manage your risk, and let the trade come to you!
✨ If you find value in my analysis, a 👍 and 🚀 boost is much appreciated — it helps me share more setups with the community!
⚠️ DISCLAIMER
This is the "Thief Style" trading strategy. Trading involves substantial risk of loss. Always do your own research, manage your own risk, and never trade with money you can't afford to lose. Past performance doesn't guarantee future results. Trade at your own risk! 🎲
#Russell2000 #US2000 #SmallCaps #SwingTrading #DayTrading #TechnicalAnalysis #PullbackEntry #InstitutionalTrading #ThiefStrategy #LayeredEntry #CFDTrading #IndexTrading #BullishSetup #SMARetest #TradingStrategy #RiskManagement #IWM #MarketAnalysis #TradingView #PriceAction
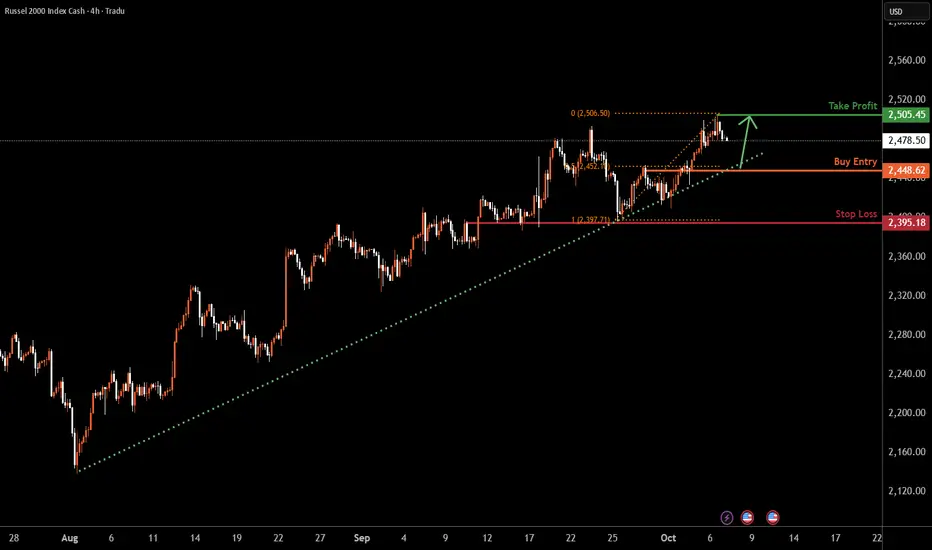
US2000 H4 | Potential Bullish Continuation AheadBased on the H4 chart analysis, we could see the price fall to the buy entry at 2,448.62, which is a pullback support that aligns with the 50% Fibonacci retracement and could bounce from his level to the take profit.
Stop loss is at 2,395.18, which is a pullback support.
Take profit is at 2,505.45, which is a swing high resistance.
High Risk Investment Warning
Trading Forex/CFDs on margin carries a high level of risk and may not be suitable for all investors. Leverage can work against you.
Stratos Markets Limited (tradu.com ):
CFDs are complex instruments and come with a high risk of losing money rapidly due to leverage. 65% of retail investor accounts lose money when trading CFDs with this provider. You should consider whether you understand how CFDs work and whether you can afford to take the high risk of losing your money.
Stratos Europe Ltd (tradu.com ):
CFDs are complex instruments and come with a high risk of losing money rapidly due to leverage. 66% of retail investor accounts lose money when trading CFDs with this provider. You should consider whether you understand how CFDs work and whether you can afford to take the high risk of losing your money.
Stratos Global LLC (tradu.com ):
Losses can exceed deposits.
Please be advised that the information presented on TradingView is provided to Tradu (‘Company’, ‘we’) by a third-party provider (‘TFA Global Pte Ltd’). Please be reminded that you are solely responsible for the trading decisions on your account. There is a very high degree of risk involved in trading. Any information and/or content is intended entirely for research, educational and informational purposes only and does not constitute investment or consultation advice or investment strategy. The information is not tailored to the investment needs of any specific person and therefore does not involve a consideration of any of the investment objectives, financial situation or needs of any viewer that may receive it. Kindly also note that past performance is not a reliable indicator of future results. Actual results may differ materially from those anticipated in forward-looking or past performance statements. We assume no liability as to the accuracy or completeness of any of the information and/or content provided herein and the Company cannot be held responsible for any omission, mistake nor for any loss or damage including without limitation to any loss of profit which may arise from reliance on any information supplied by TFA Global Pte Ltd.
The speaker(s) is neither an employee, agent nor representative of Tradu and is therefore acting independently. The opinions given are their own, constitute general market commentary, and do not constitute the opinion or advice of Tradu or any form of personal or investment advice. Tradu neither endorses nor guarantees offerings of third-party speakers, nor is Tradu responsible for the content, veracity or opinions of third-party speakers, presenters or participants.