US30 Pauses Near Highs : Momentum CoolingUS30 is currently consolidating after an extended upside run, with price showing signs of short-term hesitation rather than a clear reversal. The recent candles reflect slowing momentum and digestion of prior gains, suggesting the index is in a balancing phase as participants reassess direction. This type of behaviour often appears before volatility expansion, keeping the broader structure in focus while the market prepares for its next decisive move.
Disclosure: We are part of Trade Nation's Influencer program and receive a monthly fee for using their TradingView charts in our analysis.
US30

US30 is Nearing an Important Support! Hey Traders, in today's trading session we are monitoring US30 for a buying opportunity around 49,120 zone, Dow Jones is trading in an uptrend and currently is in a correction phase in which it is approaching the trend at 49,120 support and resistance area.
Trade safe, Joe.

US30 Trade Set Up Jan 19 2025Price is trading below PDL and still making LL/LH but first i want to see either a sweep of London highs to then trade lower or a sweep of London lows first to then trade higher

Dow Jones | Bearish Pressure Amid Geopolitical RisksUS30 | Technical Outlook
US30 is showing a bearish structure, pressured by ongoing geopolitical tensions, which continue to weigh on market sentiment.
The market is attempting to stabilize below the pivot at 48840.
As long as price holds below this level, bearish momentum is expected to continue toward 48460, followed by 48000.
A recovery scenario would require price to reclaim and stabilize above 49050, along with a reduction in geopolitical tensions, which could allow a pullback toward 49400.
Market Structure
Below 48840: Bearish continuation toward 48460 → 48000
Above 49050: Corrective rebound toward 49400
Key Levels
Pivot Line: 48840
Resistance: 49050 – 49400 – 49590
Support: 48450 – 48000 – 47500

GOLD XAUUSD less volume no tradeAs today is monday the market opened with gaped up of $56 and volume is less therefor we are not going to take a trade untill/ unless the volume increases on our keyzones. Always keep your chart simple to avoid mistakes.

US30 My Opinion! BUY!
My dear friends,
Please, find my technical outlook for US30 below:
The instrument tests an important psychological level 49354
Bias - Bullish
Technical Indicators: Supper Trend gives a precise Bullish signal, while Pivot Point HL predicts price changes and potential reversals in the market.
Target - 49464
Recommended Stop Loss - 49297
About Used Indicators:
Super-trend indicator is more useful in trending markets where there are clear uptrends and downtrends in price.
Disclosure: I am part of Trade Nation's Influencer program and receive a monthly fee for using their TradingView charts in my analysis.
———————————
WISH YOU ALL LUCK

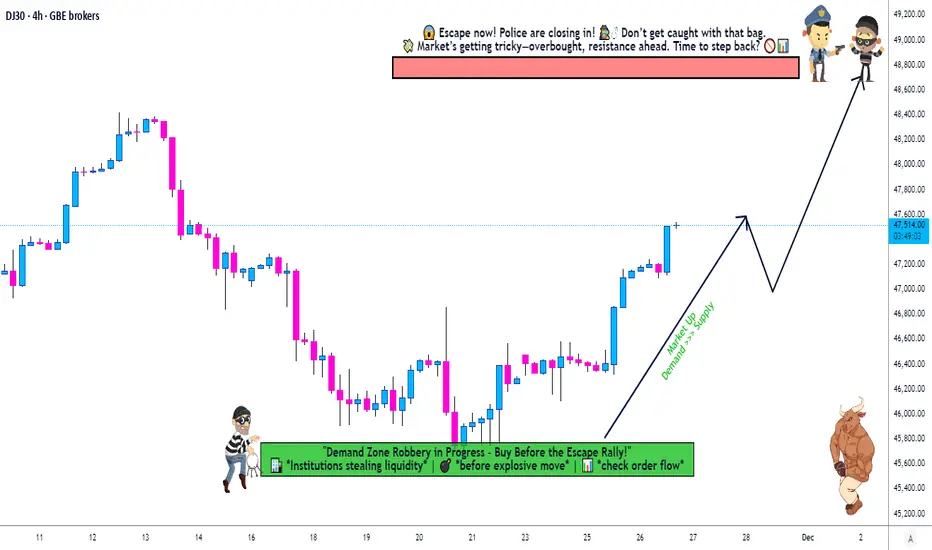
Is US30 Setting Up a Major Bullish Reversal? Layer Plan Inside🚀 US30 BULLISH SWING LAYER STRATEGY | "The Thief" Entries 🚀
BROTHERS & SISTERS OF THE MARKET! 👋 Welcome back, Thief OG's! 🦸♂️🦸♀️ A powerful Bullish setup is forming on the US30 (DOW JONES), and I'm sharing my layered entry plan to strategically position for the next leg up.
📈 Asset: US30 (Dow Jones Industrial Average)
⚡ Bias: Bullish | Style: Swing Trade
🎯 The Strategic Plan (The "Thief" Method)
This isn't a gamble; it's a calculated siege. We use a "Thief" Layering Strategy to scale into the position, reducing average entry cost and managing risk. We don't chase price; we let price come to us!
⚔️ Trade Execution Details
✅ ENTRIES (Buy Limit Layers):
We are setting multiple buy orders at key support levels. This is the core of the "Thief" method:
▶️ Layer 1: 46,400
▶️ Layer 2: 46,600
▶️ Layer 3: 46,800
▶️ Layer 4: 47,000
💡 Pro Tip: You can INCREASE or ADJUST these layers based on your capital and risk appetite.
❌ STOP LOSS (RISK MANAGEMENT):
A consolidated stop loss is placed below a major support zone to protect our capital.
➡️ SL: 46,200 (or lower based on your personal risk tolerance)
⚠️ Disclaimer (PLEASE READ): I am NOT a financial advisor. This SL is a suggestion. You MUST adjust your Stop Loss based on your own risk management strategy. Protect your capital at all costs!
🎯 PROFIT TARGET:
We are targeting a significant resistance zone where the market might see a pullback.
🎯 TP: 48,800
Rationale: This area aligns with a confluence of factors including Moving Average resistance and a potential overbought trap. The goal is to "escape with profits" before a potential reversal.
🤑 Take Note: You are free to take profits earlier! If you're in profit, you can never be wrong for taking money off the table.
🔍 Market Analysis & Key Drivers
Bullish Structure: The overall trend structure on higher timeframes remains intact.
Layered Advantage: This strategy smooths out the entry, preventing a single, potentially poor, entry point.
Risk Defined: Our maximum risk is clearly defined from the start.
🌐 Related Pairs & Correlations to Watch
Diversify your view! The US30 doesn't move in a vacuum. Keep these key assets on your watchlist:
SP:SPX (S&P 500): 🟢 High Positive Correlation. The SPX is the broader market leader. A strong SPX often pulls the DOW higher. This is your #1 confirmation.
NASDAQ:NDX (Nasdaq 100): 🟢 Positive Correlation. Tech strength can fuel overall market sentiment, but watch for divergence.
TVC:DXY (US Dollar Index): 🔴 Generally Inverse Correlation. A strengthening dollar can be a headwind for US equities. If DXY rallies sharply, be cautious.
/ES (S&P 500 Futures): 🟢 High Positive Correlation. Tracks the SPX almost tick-for-tick. Great for real-time sentiment.
✅ Conclusion
This "Thief" layered strategy provides a disciplined, low-stress approach to catching a potential US30 upswing. Remember, the market is about probabilities, not certainties.
👑 Your Capital, Your Rules. Trade Safe!
📌 Hashtags for Maximum Visibility:
#TradingView #US30 #DOW #TradingStrategy #SwingTrading #Stocks #Investing #Finance #Bullish #LayerStrategy #RiskManagement #ThiefStrategy #MarketAnalysis #SPX #DXY
👉 LIKE & FOLLOW if you found this idea helpful! Your support keeps the research coming! 💪
US30 Is Bearish! Sell!
Here is our detailed technical review for US30.
Time Frame: 9h
Current Trend: Bearish
Sentiment: Overbought (based on 7-period RSI)
Forecast: Bearish
The market is on a crucial zone of supply 49,331.6.
The above-mentioned technicals clearly indicate the dominance of sellers on the market. I recommend shorting the instrument, aiming at 48,745.5 level.
P.S
We determine oversold/overbought condition with RSI indicator.
When it drops below 30 - the market is considered to be oversold.
When it bounces above 70 - the market is considered to be overbought.
Like and subscribe and comment my ideas if you enjoy them!

US30 Will Keep Growing!
HI,Traders !
#US30 is trading in an
Uptrend and broke
The key horizontal level
Of 48784.9 and the breakout
Is confirmed so after a potential
Retest of the support cluster
Of the rising and horizontal
Support lines below we will
Be expecting a bullish continuation !
Comment and subscribe to help us grow !

US30 Trade Set Up Jan 16 2026Price is making LH/LL on the 15m and is making LH/LL on the 1h and 15m, inverted a 1h bullish FVG and is currently respecting a bearish 1h FVG so as long as price continues to make internal bearish structure i will look for sells into the 4h FVG and possibly towards PDL

DowJones sideways consolidation continuesKey Support and Resistance Levels
Resistance Level 1: 49750
Resistance Level 2: 50000
Resistance Level 3: 50200
Support Level 1: 48800
Support Level 2: 48590
Support Level 3: 48330
This communication is for informational purposes only and should not be viewed as any form of recommendation as to a particular course of action or as investment advice. It is not intended as an offer or solicitation for the purchase or sale of any financial instrument or as an official confirmation of any transaction. Opinions, estimates and assumptions expressed herein are made as of the date of this communication and are subject to change without notice. This communication has been prepared based upon information, including market prices, data and other information, believed to be reliable; however, Trade Nation does not warrant its completeness or accuracy. All market prices and market data contained in or attached to this communication are indicative and subject to change without notice.

US30 | Outlook – Rejection at Key ResistanceUS30 | Overview
The price pushed higher and reached the 49590 resistance level, exactly as highlighted in the previous idea.
Price is now trading below 49590. As long as it remains below this level, bearish pressure is favored, targeting 49390, followed by 49050.
A confirmed 4H candle close above 49590 would invalidate the bearish scenario and shift momentum back to bullish, opening the way toward 49960 and 50100.
Market Structure
Below 49590: Bearish continuation toward 49390 → 49050
Above 49590 (4H close): Bullish reversal toward 49960 → 50100
Key Levels
Pivot Line: 49590
Resistance: 49960 – 50100
Support: 49390 – 49050 – 48840
previous idea:

US30 Trade Set Up Jan 15 2026Price is bearish on the 4h but bullish on the 1h so i will want to see either a sweep of Asia lows first followed by 1m-5m IFVG/CISD to target London highs or price to respect the bearish 15m FVG to continue lower towards PDL

DowJones sideways consolidation support at 48800Key Support and Resistance Levels
Resistance Level 1: 49750
Resistance Level 2: 50000
Resistance Level 3: 50200
Support Level 1: 48800
Support Level 2: 48590
Support Level 3: 48330
This communication is for informational purposes only and should not be viewed as any form of recommendation as to a particular course of action or as investment advice. It is not intended as an offer or solicitation for the purchase or sale of any financial instrument or as an official confirmation of any transaction. Opinions, estimates and assumptions expressed herein are made as of the date of this communication and are subject to change without notice. This communication has been prepared based upon information, including market prices, data and other information, believed to be reliable; however, Trade Nation does not warrant its completeness or accuracy. All market prices and market data contained in or attached to this communication are indicative and subject to change without notice.

Dow Jones Short Term Sell Trading Opportunity SpottedM15 - Strong bearish pressure.
Currently it looks like a pullback is happening.
Expecting the price to drop further from the marked resistance zones.
👉 If you enjoy this analysis, please Like, Follow, and Support the profile! Your engagement motivates us to share more quality setups.

Nasdaq100OANDA:NAS100USD
After retesting the main trendline on the daily Timeframe.
Nasdaq 100 went back and it is going back to last weeks highs.
Since it is January Nasdaq100 could be preparing for a BIG SELL-OFF
before BUYING stronger again for 2026.
What do you think from Indices traders?

Dow Jones - Looking To Sell Pullbacks In The Short TermM15 - Strong bearish move.
No opposite signs.
Currently it looks like a pullback is happening.
Expecting bearish continuation until the two strong resistance zones hold.
If you enjoy this idea, don’t forget to LIKE 👍, FOLLOW ✅, SHARE 🙌, and COMMENT ✍! Drop your thoughts and charts below to keep the discussion going. Your support helps keep this content free and reach more people! 🚀
--------------------------------------------------------------------------------------------------------

US30 Local Long! Buy!
Hello, Traders!
US30 pulls back into a clearly respected demand zone after the recent impulse leg. The retracement cleans out weak lows, while price stability suggests institutional positioning rather than continuation selling. A rebound toward overhead liquidity is the favored scenario. Time Frame 6H.
Buy!
Comment and subscribe to help us grow!
Check out other forecasts below too!
Disclosure: I am part of Trade Nation's Influencer program and receive a monthly fee for using their TradingView charts in my analysis.

US30 Trade Set Up Jan 14 2026Price is currently trading at PDL so i will want to see a sweep of London low followed by 1m-5m IFVG/CISD to target London highs and possibly the 4h FVG

DowJones sideways consolidation supported at 48800Key Support and Resistance Levels
Resistance Level 1: 49750
Resistance Level 2: 50000
Resistance Level 3: 50200
Support Level 1: 48800
Support Level 2: 48590
Support Level 3: 48330
This communication is for informational purposes only and should not be viewed as any form of recommendation as to a particular course of action or as investment advice. It is not intended as an offer or solicitation for the purchase or sale of any financial instrument or as an official confirmation of any transaction. Opinions, estimates and assumptions expressed herein are made as of the date of this communication and are subject to change without notice. This communication has been prepared based upon information, including market prices, data and other information, believed to be reliable; however, Trade Nation does not warrant its completeness or accuracy. All market prices and market data contained in or attached to this communication are indicative and subject to change without notice.

DOW JONES in synch with the USD to start a massive correction.Dow Jones (DJI) has been trading within a 17-year Channel Up ever since the bottom of the 2008 U.S. Housing Crisis. This is not the first time we give you this pattern, so I won't be getting into too much detail on its specifics.
What we do combine it with for the first time though, is the DXY (black trend-line), which has also been trading within a Channel Up since 2008, a direct consequence of the monetary policies that were applied globally by central banks to save the system following that credit-shock event.
What this cross symbol comparison offers, is give a clear unbiased illustration of the patterns and correlation involved between the stock market and DXY (U.S. Dollar Index). Most times that the DXY bottoms (green circles), Dow peaks its Bull Cycle and starts a correction (Bear Cycle, as shown in red). All of Dow's Bear Cycles have either pulled back to the 0.382 Fibonacci retracement level or the 1W MA200 (orange trend-line) or even both.
As a result, we estimate Dow to target 40000 by the time one of the above takes place, which can coincide with the DXY hitting the top of its inner Channel Down, similar to what it did during the previous two such smaller patterns within the main 17-year Channel Up.
---
** Please LIKE 👍, FOLLOW ✅, SHARE 🙌 and COMMENT ✍ if you enjoy this idea! Also share your ideas and charts in the comments section below! This is best way to keep it relevant, support us, keep the content here free and allow the idea to reach as many people as possible. **
---
💸💸💸💸💸💸
👇 👇 👇 👇 👇 👇

US30 Potential UpsidesHey Traders, in today's trading session we are monitoring US30 for a buying opportunity around 48,500 zone, Dow Jones is trading in an uptrend and currently is in a correction phase in which it is approaching the trend at 48,500 support and resistance area.
Trade safe, Joe.

Short Opportunity On US30 Dow According to Fibonacci retracement
According to Divergence on chart with CCI
According to uptrendline channel
According to Price Action
