Dow Jones Awaits PCE – Key Pivot at 45,430US30 – Overview
The Dow Jones remains highly sensitive to today’s PCE inflation release, which will provide key signals for the Federal Reserve’s upcoming rate decision. Market sentiment leans slightly bearish, but the direction will depend on the data outcome.
Technical Outlook:
If PCE prints above expectations, bearish momentum is likely to dominate, with downside targets at 45,285 → 45,110 → 44,950.
If PCE comes in softer, bullish momentum could resume, pushing price toward another ATH at 45,680, with extended resistance at 45,860.
Key Levels:
Pivot: 45,430
Support: 45,285 – 45,110 – 44,950
Resistance: 45,680 – 45,860
Bias: Neutral ahead of PCE, with directional breakout expected from the pivot zone.
US30

DowJones Key Trading LevelsKey Support and Resistance Levels
Resistance Level 1: 45766
Resistance Level 2: 45920
Resistance Level 3: 46080
Support Level 1: 45050
Support Level 2: 44900
Support Level 3: 44730
This communication is for informational purposes only and should not be viewed as any form of recommendation as to a particular course of action or as investment advice. It is not intended as an offer or solicitation for the purchase or sale of any financial instrument or as an official confirmation of any transaction. Opinions, estimates and assumptions expressed herein are made as of the date of this communication and are subject to change without notice. This communication has been prepared based upon information, including market prices, data and other information, believed to be reliable; however, Trade Nation does not warrant its completeness or accuracy. All market prices and market data contained in or attached to this communication are indicative and subject to change without notice.
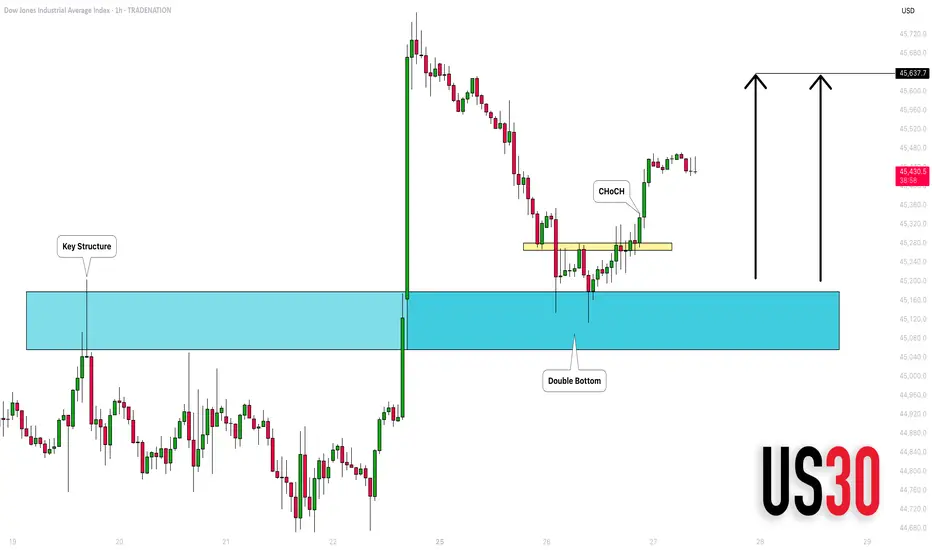
SHORT ON US30US30 has given us a CHOC to the downside after a long time run up.
I will be selling US30 to the consolidation zone looking to catch 1000 points over the next few days.
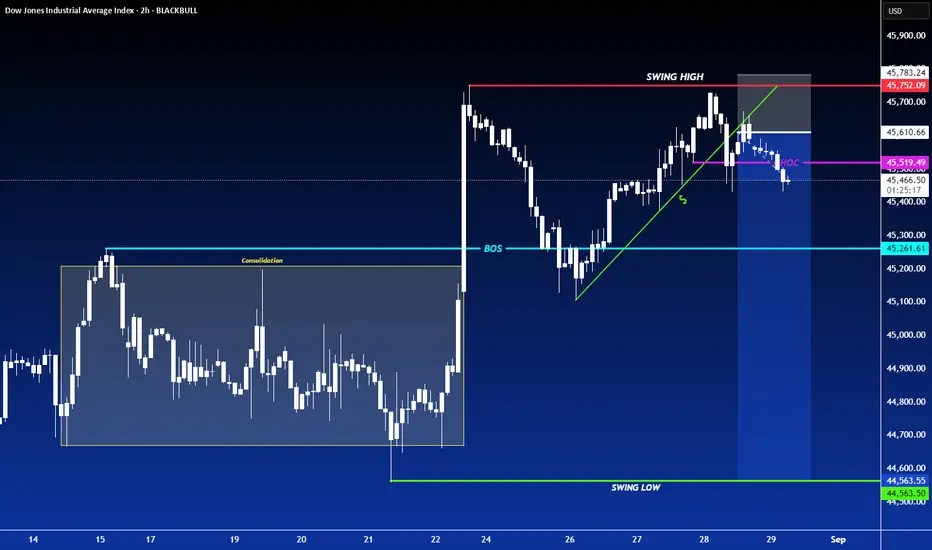
Us30usd market analysis #US30 technical analysis. Price has broke through upward trend line. Trend line acting as resistance levels now. We should see price continue to drop here.

Us30 Trade Set Up Aug 28 2025FX:US30
www.tradingview.com
Price has made HH/HL on the 1h so if price can remain above HL and the 1h FVG i can see it testing BSL before coming down but if price can close under HL and invert 1h FVG i will look for sells down to SSL and PDL

DowJones Key Trading LevelsKey Support and Resistance Levels
Resistance Level 1: 45766
Resistance Level 2: 45920
Resistance Level 3: 46080
Support Level 1: 45050
Support Level 2: 44900
Support Level 3: 44730
This communication is for informational purposes only and should not be viewed as any form of recommendation as to a particular course of action or as investment advice. It is not intended as an offer or solicitation for the purchase or sale of any financial instrument or as an official confirmation of any transaction. Opinions, estimates and assumptions expressed herein are made as of the date of this communication and are subject to change without notice. This communication has been prepared based upon information, including market prices, data and other information, believed to be reliable; however, Trade Nation does not warrant its completeness or accuracy. All market prices and market data contained in or attached to this communication are indicative and subject to change without notice.
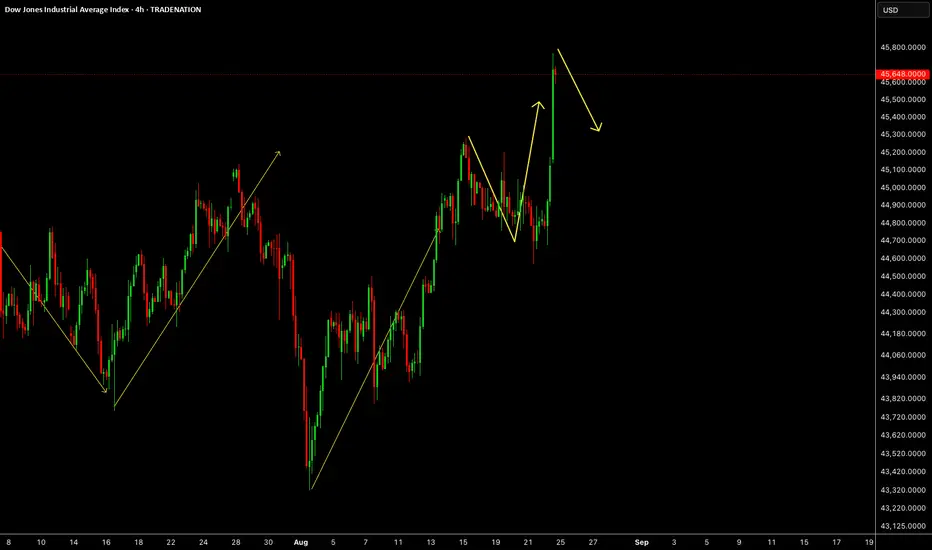
Dow Jones Rejected at 45,680 Ahead of GDP DataUS30 – Overview
GDP Data in Focus After Rejection From Resistance
The Dow Jones reached the 45,680 resistance level mentioned in the previous outlook and has since stabilized below it. Today, price action will likely be influenced by the upcoming U.S. GDP release, which could increase volatility.
🔹 Technical Outlook
As long as the index trades below 45,680, bearish momentum is favored toward 45,450.
A confirmed 1H close below 45,430 would strengthen the bearish move, opening the way to 45,285 → 45,110.
However, if price closes a 1H candle above 45,680, bullish momentum could resume, with upside targets at 45,860 → 45,980.
🔹 Key Levels
Pivot: 45,680
Resistance: 45,860 – 45,980
Support: 45,450 – 45,285 – 45,110
✅ Summary:
US30 has rejected resistance at 45,680 and remains under pressure ahead of the GDP release. Watch 45,680 as the pivot: staying below keeps the bearish bias intact, while a breakout above would signal renewed bullish momentum.

US30 Pullback Toward 45,100 as DXY Weakens on Dovish Fed ToneHey Traders, in today's trading session we are monitoring US30 for a buying opportunity around the 45,100 zone. Dow Jones (US30) remains in an uptrend, with price currently correcting toward this key support/resistance level.
Structure: The broader bias is bullish, though price is retracing after recent highs.
Key level in focus: 45,100 — acting as a key zone within the ongoing trend.
Fundamentals: The US Dollar Index (DXY) faced strong rejection at 98.700 following the Fed’s dovish stance at the Jackson Hole symposium. This bearish dollar sentiment could support US equities due to their negative correlation.
Next move: Holding above 45,100 may keep US30’s bullish momentum intact, while a decisive break lower would suggest deeper retracement.
Monitoring price behavior at this level to gauge whether buyers step in.
Trade safe,
Joe.

S&P500 INDEX (US500): To the New Highs?!
US500 is going to break a resistance based on a current all-time high.
A daily candle close above the underlined structure will provide a confirmation.
A bullish continuation will be expected at least to 6520 then.
❤️Please, support my work with like, thank you!❤️
I am part of Trade Nation's Influencer program and receive a monthly fee for using their TradingView charts in my analysis.

Quick US 30 Scalp on Correction & Gold MELTRed day for the Markets.
Took chance of some corrections.

Us30 Trade Set UP Aug 27 2025FX:US30
www.tradingview.com
Us30 is approaching a 1h FVG, if it respects it, i will look for internal sweep of SSl followed by 1m-2m IFVG to target higher BSL levels but if price inverts the 1h FVG(closes under 50% of FVG) i will look for sells towards PDL

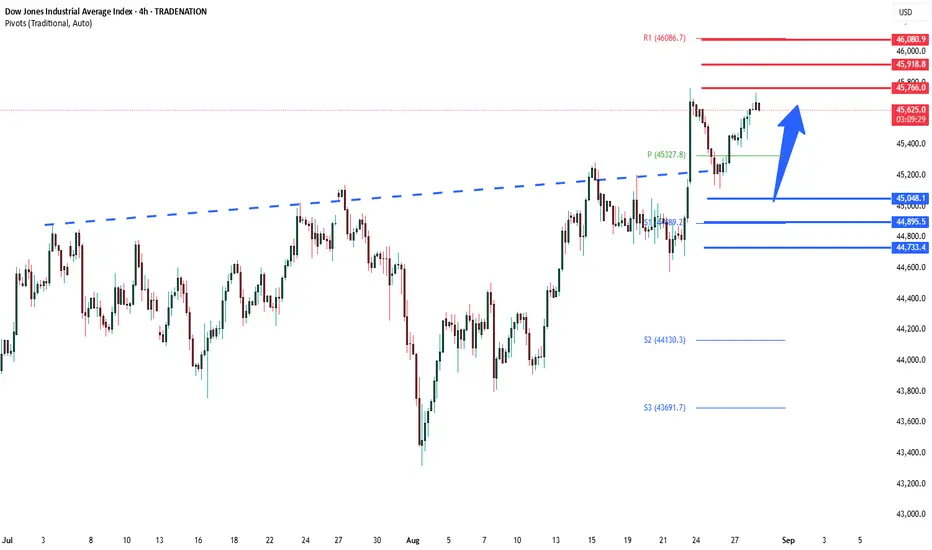
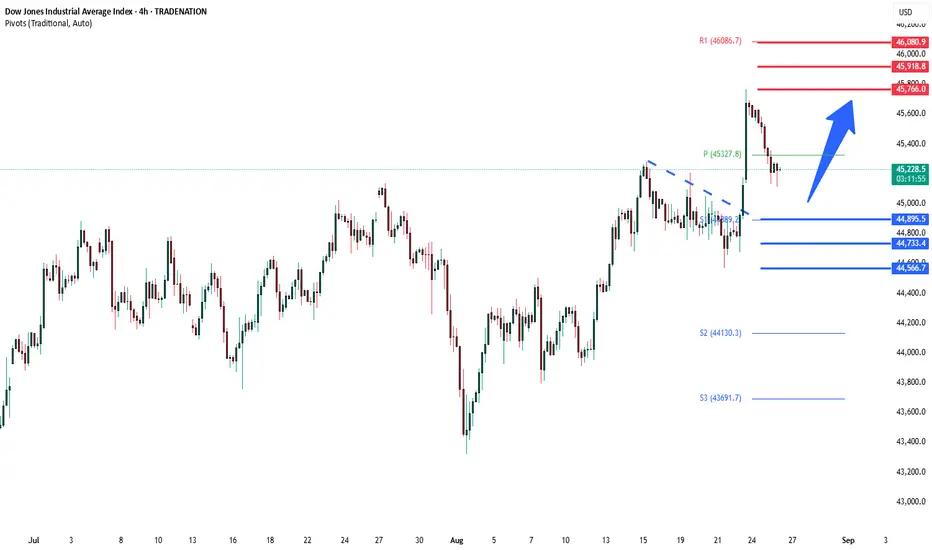
DowJones uptrend supported at 45050Key Support and Resistance Levels
Resistance Level 1: 45766
Resistance Level 2: 45920
Resistance Level 3: 46080
Support Level 1: 45050
Support Level 2: 44900
Support Level 3: 44733
This communication is for informational purposes only and should not be viewed as any form of recommendation as to a particular course of action or as investment advice. It is not intended as an offer or solicitation for the purchase or sale of any financial instrument or as an official confirmation of any transaction. Opinions, estimates and assumptions expressed herein are made as of the date of this communication and are subject to change without notice. This communication has been prepared based upon information, including market prices, data and other information, believed to be reliable; however, Trade Nation does not warrant its completeness or accuracy. All market prices and market data contained in or attached to this communication are indicative and subject to change without notice.

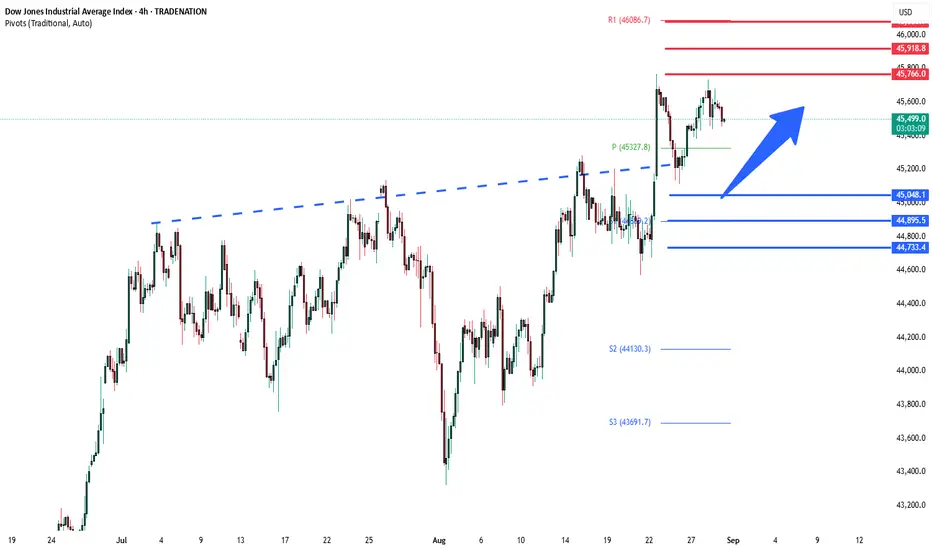
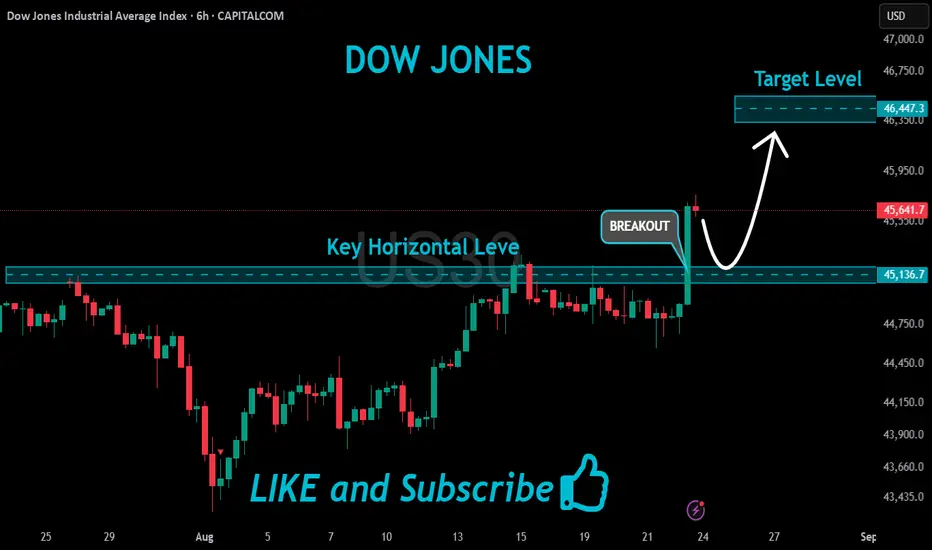
US30 Will Keep Growing!
HI,Traders !
#US30 is trading in an
Uptrend and the bullish
Breakout reinforces our
Bullish bias so after the
Potential pullback and retest
Of the new support of 45136.7
A further bullish continuation
Is to be expected !
Comment and subscribe to help us grow !
DOW JONES INDEX (US30): Bullish Move Continues
In the yesterday's video, I explained how to buy US30 from a key support.
We can see that the market nicely respected the underlined structure
and bounced.
I believe that more growth is ahead.
Next resistance - 45640
❤️Please, support my work with like, thank you!❤️
I am part of Trade Nation's Influencer program and receive a monthly fee for using their TradingView charts in my analysis.
Us30 1500 pips set upFX:US30
www.tradingview.com
was a slow day but out set up played out securing a total of 1500 pips
the target was buy side liquidity

Dow Key Trading Levels Key Support and Resistance Levels
Resistance Level 1: 45766
Resistance Level 2: 45920
Resistance Level 3: 45080
Support Level 1: 44900
Support Level 2: 44733
Support Level 3: 44566
This communication is for informational purposes only and should not be viewed as any form of recommendation as to a particular course of action or as investment advice. It is not intended as an offer or solicitation for the purchase or sale of any financial instrument or as an official confirmation of any transaction. Opinions, estimates and assumptions expressed herein are made as of the date of this communication and are subject to change without notice. This communication has been prepared based upon information, including market prices, data and other information, believed to be reliable; however, Trade Nation does not warrant its completeness or accuracy. All market prices and market data contained in or attached to this communication are indicative and subject to change without notice.
US30: Will 45,110 Hold or Break Lower?US30 – Overview
Bearish Drop Reaches Target, Market Consolidates at Key Levels
The Dow Jones (US30) dropped over 450 points, exactly reaching the downside targets highlighted in the previous idea.
For now, the index is expected to test 45,110 and then consolidate within the 45,110 – 45,285 range until a breakout occurs.
🔹 Technical Outlook
A 1H close below 45,110 would extend the bearish move toward 44,950. A further break lower opens the path to 44,720 → 44,610.
A 1H close above 45,285 would shift momentum bullish, targeting 45,410 → 45,580.
🔹 Key Levels
Support: 45,110, 44,950 – 44,720
Resistance: 45,285 – 45,410 – 45,580
✅ Summary:
US30 has completed its bearish move and is now consolidating around the 45,110 pivot. Watch for a confirmed 1H close to determine whether the next leg is a continuation lower or a rebound higher.

US30 Trade Set Up Aug 25 2025FX:US30
www.tradingview.com
Us30 Trade Set Up: price has created a huge gap between HH/HL so i want to see more price action play out but we got sell side liquidity on the 15m that can be tested. If price sweeps and closes above i will look for buys but if price closes below we could see the start of a bigger pull back down before continuing higher

US30 Long Opportunity US30 has been on a bullish tear recent and after the speech by Powell, the market has turned on the bullish momentum to the max. the market is currently on an impulse to the the upside and has created new highs.
Price has broken the $45000 pivot level and continues to trade above the 21, 50 and 200 SMA and in the bullish region of the RSI, currently sitting in the overextended levels at 80.
it is clear the market is in need of a deep retracement to collect liquidity and i will be target the $45000-$5250 zone for a potential zone opportunity. Waiting to see how price reacts to the level and will ride the wave pass the $445652 mark.

US30 LongUS30: New ATH Prints – Waiting for Weekly Candle Retracement
The US30 has surged to fresh all-time highs (ATH), closing last week with a strong bullish weekly momentum candle. This kind of aggressive move often sees follow-through, but smart money typically waits for a retracement to optimize entries.
Plan & Levels:
The area around $45,300 stands out as a potential buying zone, aligning with expected dollar weakness and a key Fibonacci retracement level of the prior weekly push.
Traders will watch for price to pull back toward this zone and confirm entries using lower timeframe candlestick patterns and confluence with Fibonacci support.
Technical Context:
Momentum remains firmly bullish, with higher highs and strong breadth across industrial and tech components supporting the rally.
A controlled retracement would provide fresh liquidity for continuation and could set the stage for another leg higher toward new records.
Trading Plan:
Wait for a retracement toward $45,300 to build a long position.
Validate entries using Fibonacci levels and bullish reversal candles on 4H or lower charts.
Maintain disciplined risk management, as overextended markets can show sharp pullbacks before continuation.

US30US30 is almost ready for a drop as correction, look for sells for now short term.
Disclosure: We are part of Trade Nation's Influencer program and receive a monthly fee for using their TradingView charts in our analysis.
Dow Jones: Will It Finally Break All-Time Highs?While SPX 500 and Nasdaq have already smashed their all-time highs, Dow Jones is still grinding toward its breakout. In this analysis, I’ll break down the current consolidation phase, key Fibonacci levels, and precise long triggers to watch. We’ll zoom into daily and lower time frames to find actionable entries, manage risk, and avoid FOMO.
Clear, skeptical, and to the point. 🔮
Trade smart, keep risk tight, and don’t FOMO. Share your thoughts in the comments, boost if it helps <3

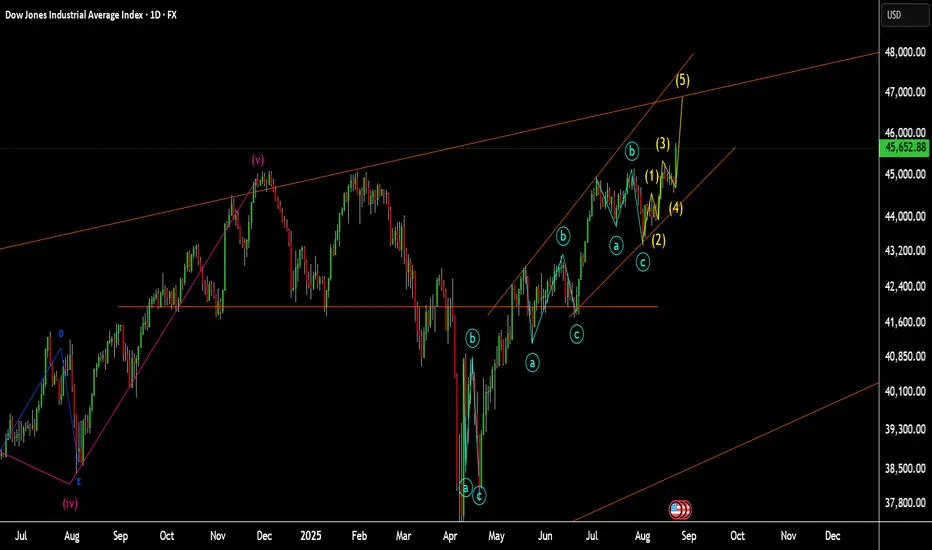
US30 in 5th waveUS30 in 5th wave
this is next long wave that start
so I assume it moves to the top resistance.