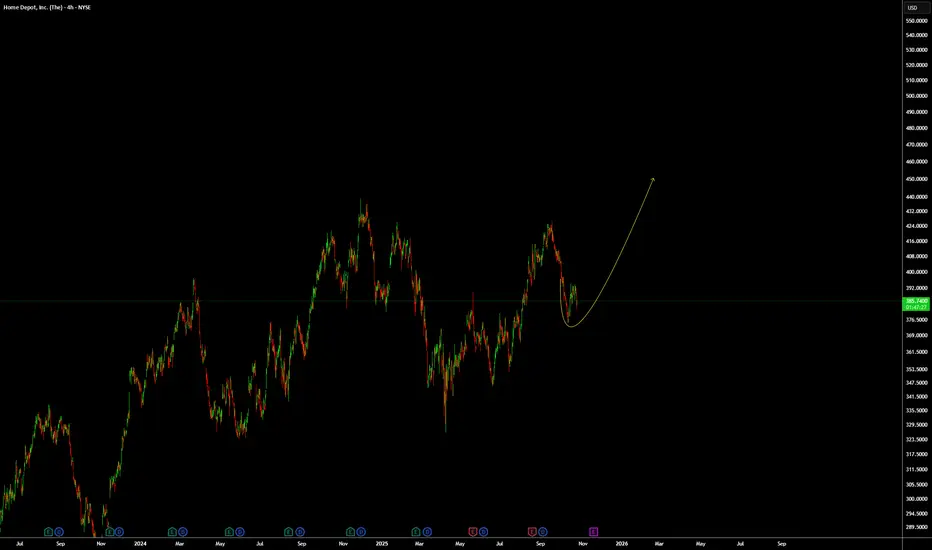
HD: If this is just a pullback, up again.For NYSE:HD (Home Depot) if this just a pullback, we will be going back up to break the top and reach 450 level.
Always remember WTW 4 Golder Rules:
1) Do not jump in
2) Do not over risk/trade
3) Do not trade without Stop Loss
4) Never ever add to a losing position!
Trade with care
We Trade Waves
WTW Team
Disclosure: We are part of Trade Nation's Influencer program and receive a monthly fee for using their TradingView charts in our analysis.
US30
Us30 Trade Set Up Oct 23 2025We are now in a strong bearish trend so i will be looking for price to sweep BSL before making internal bearish structure on the 1m-5m looking for IFVG and CISD to take sells to lower SSL

Us30 Trade Secured 1500 Pipstrade played out perfectly, made LH/LL on the 15m, closed under daily BSL so i knew the target had to the daily FVG as imbalance. Waited for BSL to be taken with a BOS in the 15m to push down

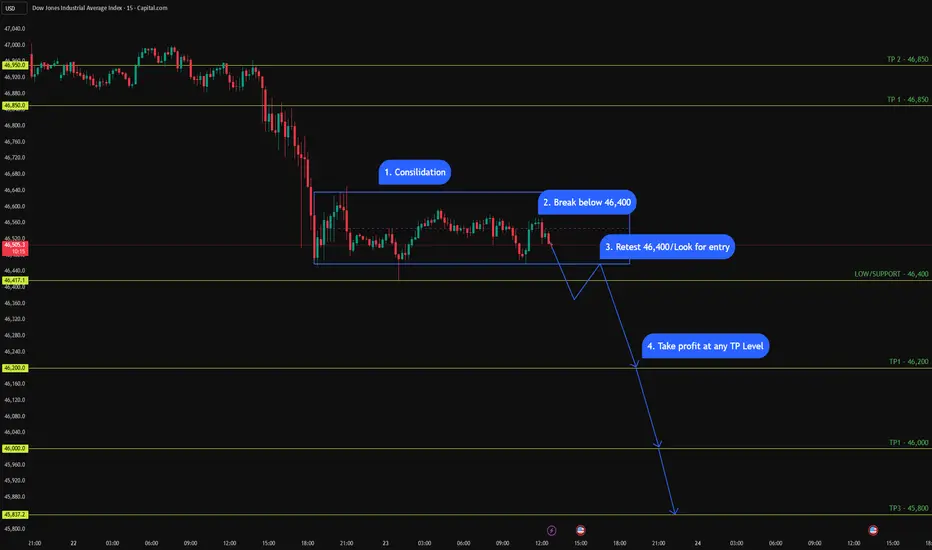
US30 (15M - 1M Daily Setup) - Bearish Bias US30 (15M - 1M Daily Setup) - Bearish Bias 📉
Price is consolidating under key resistance, forming lower highs. I’m watching 46,400 as the make-or-break level.
✅ Plan:
1️⃣ Consolidation phase complete
2️⃣ Looking for a clean break below 46,400
3️⃣ Retest → possible short entry
4️⃣ Target zones:
• TP1 → 46,200
• TP2 → 46,000
• TP3 → 45,800
📍 Bias stays bearish as long as price remains below 46,850 – 47,000.
Let’s see if the breakdown plays out. 👀
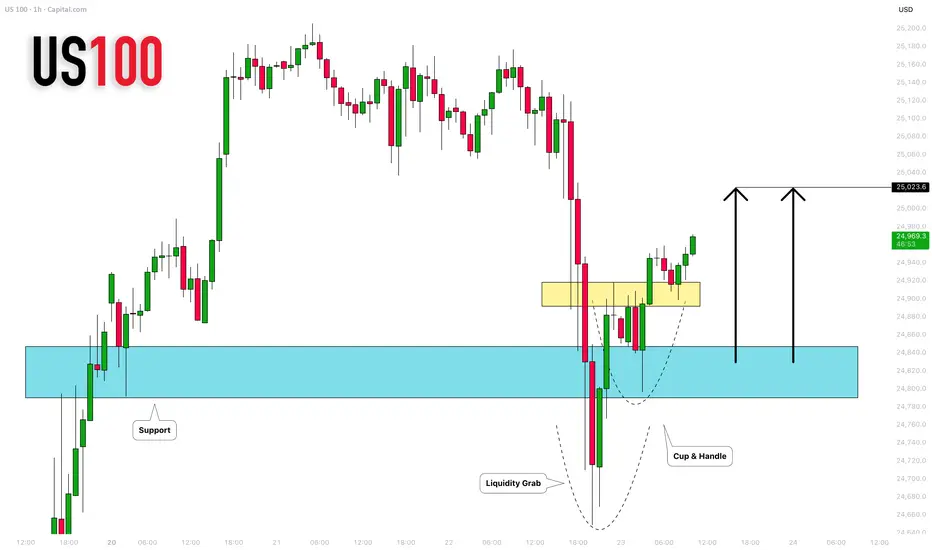
NASDAQ INDEX (US100): Bullish Move After the Trap
I see a confirmed liquidity grab below a key horizontal support
on an hourly time frame.
A formation of a cup & handle pattern and a breakout of its neckline
afterward suggest a strong buygin interest.
The market will rise more and reach at least 25023 level.
❤️Please, support my work with like, thank you!❤️
I am part of Trade Nation's Influencer program and receive a monthly fee for using their TradingView charts in my analysis.
Us30 Trade Set Up Oct 22 2025Price swept a daily BSL and closed under it and has left a lot of SSL plus a daily gap below so i will want to see a sweep of internal BSL followed by a CISD on the 1m-5m to target PDL and 50% of the daily gap

Dow bullish breakout supported at 46600Key Support and Resistance Levels
Resistance Level 1: 47156
Resistance Level 2: 47285
Resistance Level 3: 47413
Support Level 1: 46600
Support Level 2: 46460
Support Level 3: 46270
This communication is for informational purposes only and should not be viewed as any form of recommendation as to a particular course of action or as investment advice. It is not intended as an offer or solicitation for the purchase or sale of any financial instrument or as an official confirmation of any transaction. Opinions, estimates and assumptions expressed herein are made as of the date of this communication and are subject to change without notice. This communication has been prepared based upon information, including market prices, data and other information, believed to be reliable; however, Trade Nation does not warrant its completeness or accuracy. All market prices and market data contained in or attached to this communication are indicative and subject to change without notice.

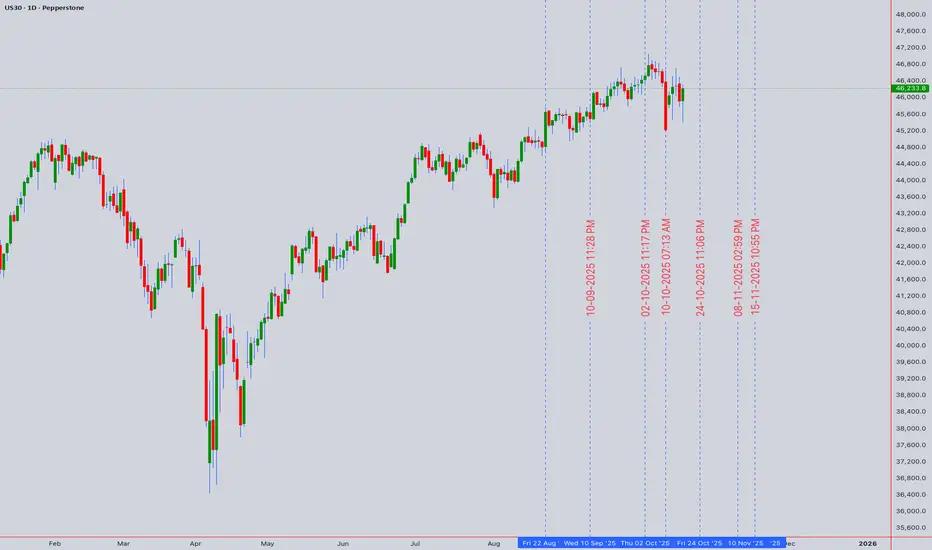
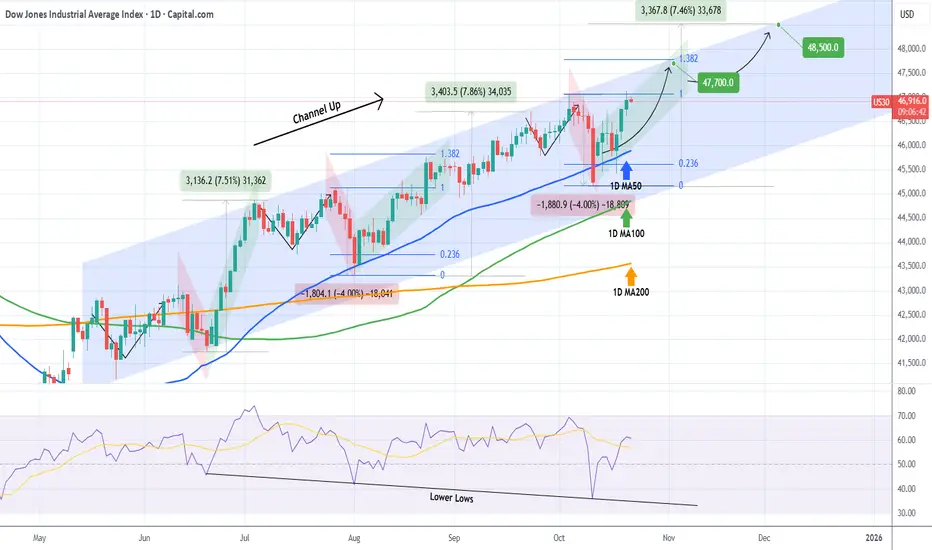
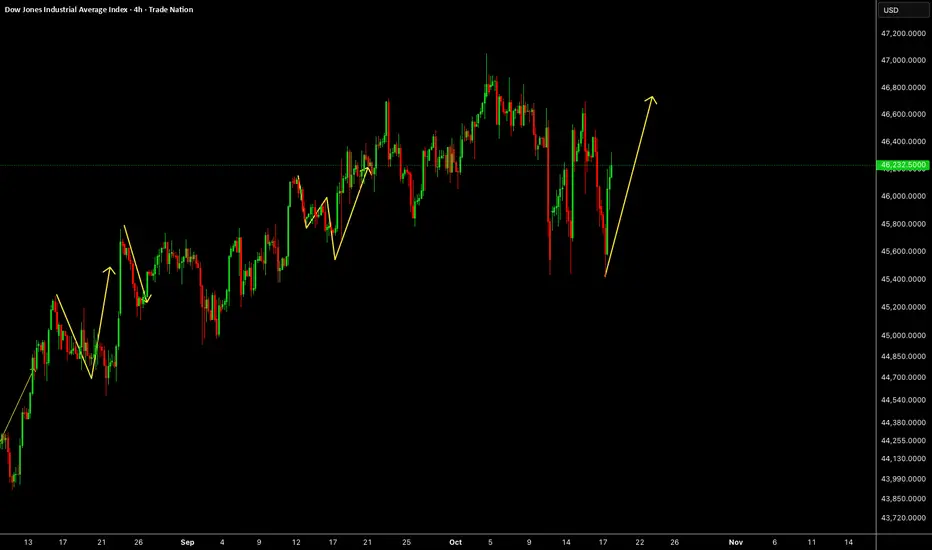
DOW JONES eyes two Bullish Targets before the end of the year.Dow Jones (DJI) has been trading within a 5-month Channel Up and is currently on its new Bullish Leg following the October 10 bounce on its 1D MA50 (blue trend-line).
As you can see, there is a high degree of symmetry between both the Bearish and Bullish Legs within this pattern and if that continues to hold, the immediate Target of the current Bullish Leg is the 1.382 Fibonacci extension at 47700, which we've already mentioned on our previous analysis.
This time however, we also set a second Target towards the end of the year, being a +7.50% rise (standard Leg as you can see) from the bottom at 48500. Both Targets would make ideal technical Higher Highs for the Channel Up.
Notice also how the October 10 bounce took place also on the 1D RSI's Lower Lows trend-line. An additional indication of a strong support for the long-term bullish trend.
-------------------------------------------------------------------------------
** Please LIKE 👍, FOLLOW ✅, SHARE 🙌 and COMMENT ✍ if you enjoy this idea! Also share your ideas and charts in the comments section below! This is best way to keep it relevant, support us, keep the content here free and allow the idea to reach as many people as possible. **
-------------------------------------------------------------------------------
💸💸💸💸💸💸
👇 👇 👇 👇 👇 👇
US30: Breakout or Pullback? Key zones in play
SPREADEX:DJI Technical Analysis – Price Action Scenarios Based on Supply & Demand Zones
Timeframe: 30-Minute
Chart: Wall Street Index (US30)
Source: TradingView
________________________________________
🔍 Overview
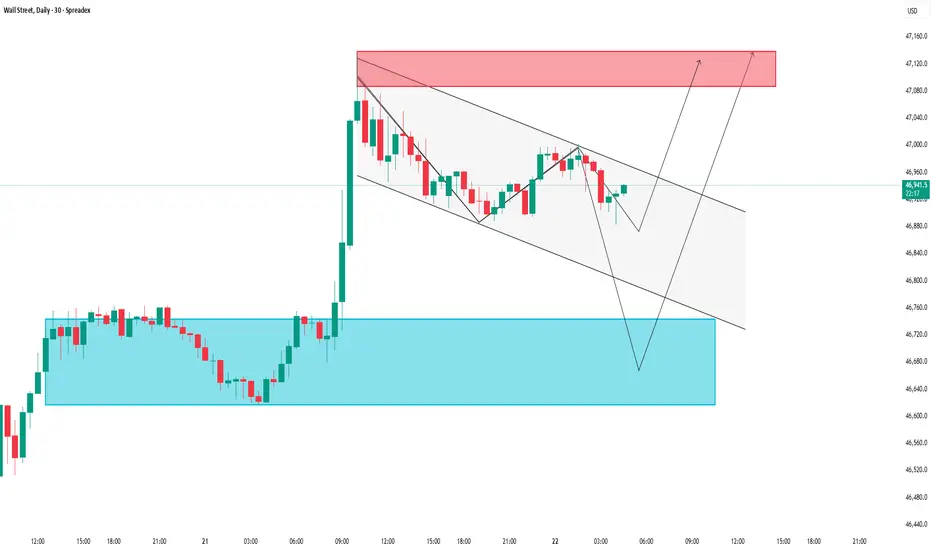
In this Wall Street index analysis, the US30 is currently consolidating within a descending price channel after a sharp bullish breakout from a key demand zone. The chart outlines potential price action scenarios based on key support and resistance levels derived from supply and demand dynamics.
________________________________________
Key Supply & Demand Zones
🔵 Demand Zone (Support Area): 46,660 – 46,720 USD
This is the deep support zone where price previously reversed sharply. It represents a high-probability buying area if retested.
🟢 Short-Term Support / Accumulation Zone: 46,880 – 46,950 USD
Price has shown multiple reactions here, indicating accumulation and temporary demand. A break below this area could lead to a move toward the lower demand zone.
🔴 Supply Zone (Resistance Area): 47,100 – 47,160 USD
This is a potential reversal zone where sellers may become active again. A breakout above this area could signal continuation of the bullish trend.
________________________________________
🧭 Technical Structure & Price Action Scenarios
The chart shows two main forecast scenarios for US30:
📉 Scenario 1: Bearish Pullback to the Lower Demand Zone
• Price gets rejected at the upper boundary of the descending channel.
• If bearish momentum continues, expect a decline toward the 46,660 – 46,720 USD zone.
• Look for bullish reversal signals such as a hammer or bullish engulfing candle before considering long positions.
📈 Scenario 2: Bullish Breakout Toward the Supply Zone
• If price sustains above 46,950 USD and breaks the descending trendline, a bullish move may be confirmed.
• Target zone: 47,100 – 47,160 USD.
• A successful breakout here could open up a continuation toward higher levels.
________________________________________
📌 Supporting Indicators
• Parabolic SAR: Dots are showing a potential shift during the retracement. Watch for dots flipping below price to support bullish continuation.
• Breakout Confirmation: The previous breakout above the 46,880 range adds weight to the current bullish outlook.
________________________________________
✅ Trading Setup Summary
Scenario Key Zone Action
📉 Pullback 46,660 – 46,720 Watch for long entry (support test)
📈 Breakout 46,950 Long toward 47,100 – 47,160
• Support Holding Above: 46,880 – 46,950 USD
• Resistance Zone to Watch: 47,100 – 47,160 USD
________________________________________
⚠️ Final Thoughts
The current structure indicates a pullback within a broader bullish context. Watch how price reacts at support zones and the descending channel. Traders should wait for clear confirmation before entering positions and maintain strict risk management.
📈 This setup is suitable for day traders and short-term swing traders looking to trade the US30 index based on clean price action and supply & demand logic.
Please like and comment below to support our traders. Your reactions will motivate us to do more analysis in the future 🙏✨
Harry Andrew @ ZuperView
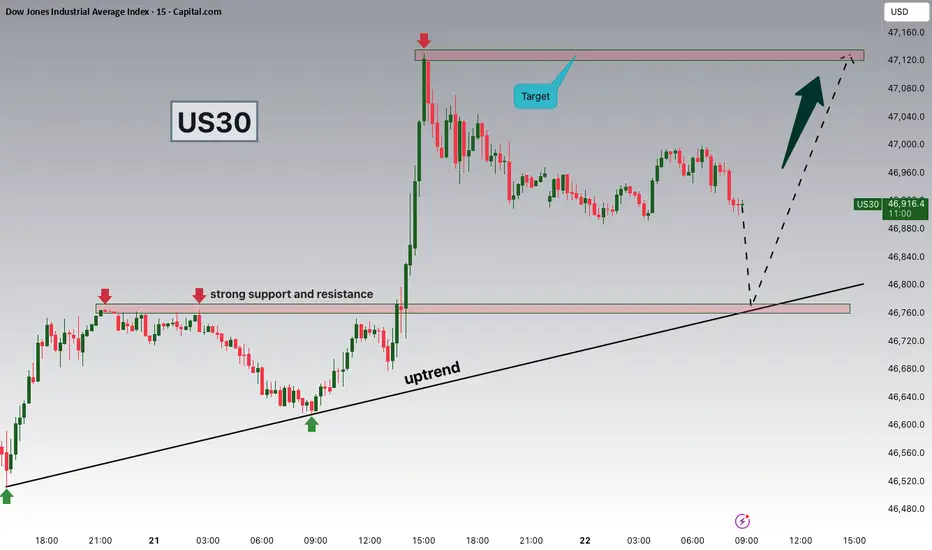
Dow Jones Testing 46,760 – Bounce or Breakdown Ahead?Hey Traders, in today’s trading session we’re closely monitoring US30 for a buying opportunity around the 46,760 zone. The Dow Jones remains in a broader uptrend and is currently undergoing a correction phase, approaching a key support and resistance confluence at 46,760.
Market Structure:
The index continues to print higher highs and higher lows, confirming bullish market structure. The current retracement could offer a potential continuation setup if buyers regain control near this level.
Key Level:
46,760 — an important technical zone where trendline support meets horizontal structure, providing a potential reaction point for bulls.
Outlook:
If buying pressure emerges from this area, a move toward 47,400–47,600 could be on the table in the coming sessions.
💬 What’s your take on US30 here?
Do you see a bounce from support or a deeper pullback coming? Share your view in the comments!
Trade safe,
Joe.
Us30 Trade Set Up Oct 21 2025Daily BSL have been swept and price is at a strong 4h resistance so if price sweeps PDL and closes under i will look for bearish structure on the 1m/5m forming IFVG/CISD to take sells to SSL or 50% of the 4h FVG but if price comes for SSL/London lows first i will look for short term buys to PDH

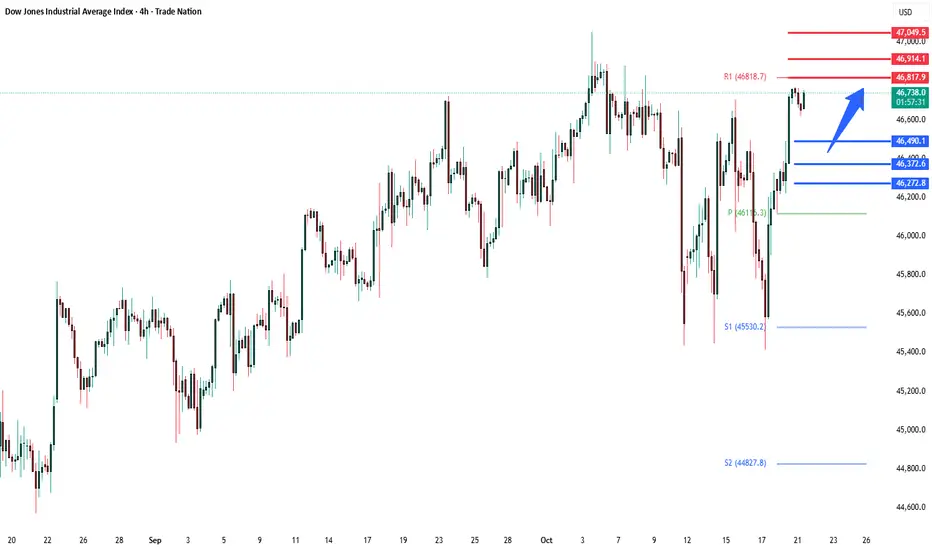
DowJones Key Trading LevelsKey Support and Resistance Levels
Resistance Level 1: 46817
Resistance Level 2: 46915
Resistance Level 3: 47050
Support Level 1: 46490
Support Level 2: 46370
Support Level 3: 46270
This communication is for informational purposes only and should not be viewed as any form of recommendation as to a particular course of action or as investment advice. It is not intended as an offer or solicitation for the purchase or sale of any financial instrument or as an official confirmation of any transaction. Opinions, estimates and assumptions expressed herein are made as of the date of this communication and are subject to change without notice. This communication has been prepared based upon information, including market prices, data and other information, believed to be reliable; however, Trade Nation does not warrant its completeness or accuracy. All market prices and market data contained in or attached to this communication are indicative and subject to change without notice.
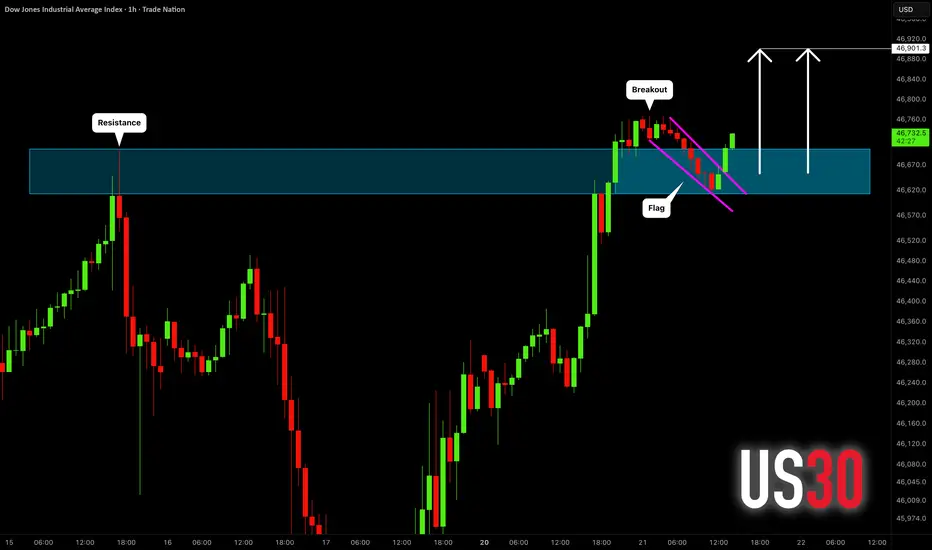
DOW JONES INDEX (US30): Bullish Continuation Confirmed
US30 index violated a major horizontal resistance yesterday.
The price started a correctional movement then, steadily
falling within a bullish flag pattern.
A breakout of its resistance line is a strong bullish signal.
Odds will be high, the index will hit 46900 level soon.
❤️Please, support my work with like, thank you!❤️
I am part of Trade Nation's Influencer program and receive a monthly fee for using their TradingView charts in my analysis.
US30 Eyes 46,600 Resistance as Correction Extends Within TrendHey Traders, in tomorrow’s trading session we are monitoring US30 for a potential selling opportunity around the 46,600 zone. The Dow Jones remains in a broader downtrend and is currently in a corrective phase, approaching a key resistance level aligned with the descending trendline.
Structure:
Price continues to form lower highs and lower lows, indicating persistent bearish momentum. The ongoing pullback toward 46,600 could offer a potential continuation setup in line with the prevailing downtrend.
Key level in focus:
46,600 — a significant resistance zone and trendline confluence area where sellers have previously regained control.
Fundamentals:
Market sentiment remains fragile as uncertainty over US fiscal policy and geopolitical risks weigh on risk assets, supporting potential downside pressure on the Dow.
Next move:
Watching for bearish confirmation signals near 46,600 — a rejection from this zone could open the door for a continuation toward recent lows.
Trade safe,
Joe.

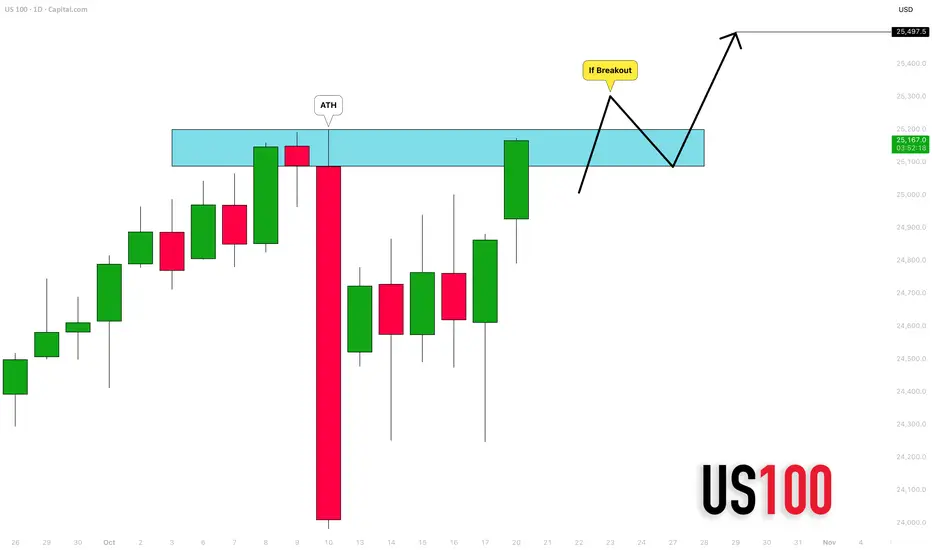
NASDAQ INDEX (US100): Get Ready for Breakout
Nasdaq index is currently testing a resistance based on a current
all-time high.
With a high probability, the market is going to break that.
A daily candle close above will confirm a violation.
A further growth will be expected at least to 25500 level then.
❤️Please, support my work with like, thank you!❤️
I am part of Trade Nation's Influencer program and receive a monthly fee for using their TradingView charts in my analysis.
U30 Trade Set Up Oct 20 2025I want to see price sweep BSL/London highs to then look for internal bearish structure on the 1m-5m to take sells to internal SSL

SPX | DAILY ANALYSIS #6Hello and welcome back to DP.
Let’s kick off the weekday together by analyzing the **S&P 500 Index (SPX)**.
🟠 Market Overview
Previous Close: 6692.50
Current Daily Range: 6678.00 – 6705.80
Asia Session High: 6705.80
Asia Session Low: 6678.00
The index has seen significant selling pressure over the past week. She broke below the previous demand zone at 6715–6700, forming a new demand zone between 6680–6665.
This could suggest:
* Sellers are gaining momentum, OR
* Short positions were liquidated to make room for new entries.
🔵 Key Levels to Watch
Resistance Zone (Upside Target):
6711 – A break and hold above this level could lead to a test of 6735 and potentially new highs near 6755.
Support Zone (Blue Box):
6680 – 6665 – This is a critical support zone.
If broken, we may see the index fall toward:
First Support (Yellow Box): 6645
Deeper Support Zone: 6620 – 6605
If the 6680 zone holds and we see bullish confirmation (e.g., strong buying wicks, volume spike, or bullish engulfing candle), buyers may regain control and push the price back up toward the 6710–6730 range.
🧠 Trading Outlook
Bullish Bias Above: 6711
Bearish Bias Below: 6680
Neutral Zone: 6680–6710 (watch for consolidation or fakeouts)
📌 Note: The current structure suggests we are at a decision point. Be patient, wait for confirmation, and manage your risk accordingly.
Take care and have a great trading day!
For informational purposes only – not financial advice. © DIBAPRISM
Amir D. Kohn

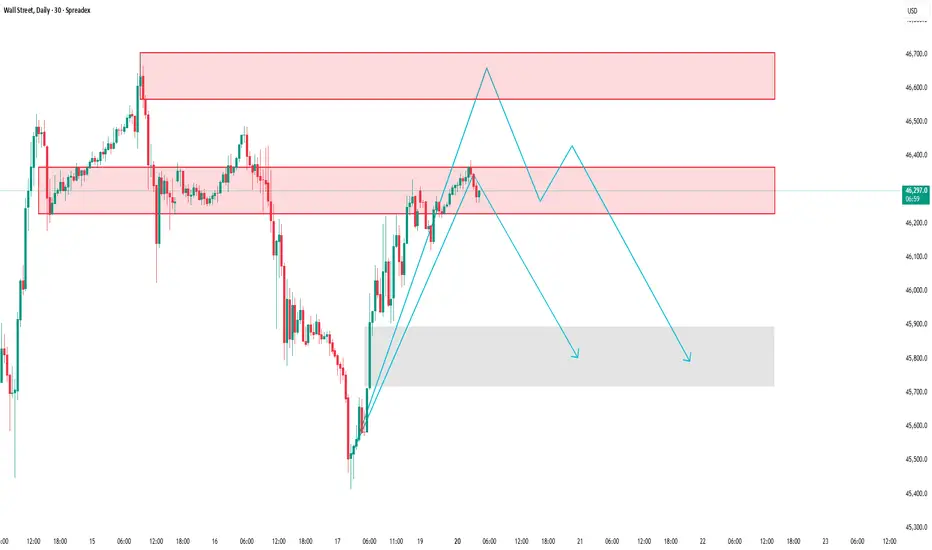
US30: Testing key supply zone, possible pullback ahead
SPREADEX:DJI – Price Reaction at Supply Zone | Possible Short-Term Correction
Timeframe: 30-Minute Chart
Analysis Style: Price Action • Supply & Demand • Market Structure
________________________________________
🧭 Market Context
After a strong rally from the lower demand zone, the Wall Street Index is now approaching a key supply area that previously triggered a sharp downward move.
At this level, sellers are beginning to step in again, and price momentum is starting to fade — suggesting a potential short-term correction ahead.
________________________________________
🧩 Market Structure & Key Zones
🔴 Supply Zone #1: 46,227 – 46,370
→ The first reaction zone, where previous selling pressure started a strong decline.
🔴 Supply Zone #2 (Major Resistance): 46,572 – 46,700
→ A higher zone where strong bearish momentum originated before.
🟢 Demand Zone: 45,900 – 45,700
→ A previous accumulation area that fueled the recent bullish leg — possible support zone if price pulls back.
________________________________________
📊 Current Price Behavior
Price has reached the 46,227 – 46,370 area and is showing signs of buyer exhaustion.
Multiple rejections and slower bullish candles near this level indicate a loss of momentum.
If the short-term bullish structure breaks, the market may shift toward a corrective phase.
________________________________________
📉 Trading Scenario
✅ Primary Scenario (Bearish Reaction Expected):
1. Price might retest 46,229–46,400 once more.
2. Failure to break above this level could lead to a downward “push.”
3. Target zone for the correction: 45,800 – 45,900.
⚙️ Alternative Scenario:
• If price closes clearly above 46,400, the short-term bearish setup becomes invalid.
• In that case, the next resistance to watch lies around 46,600 – 46,700.
________________________________________
💡 Conclusion
The Wall Street Index is currently testing a critical supply zone with visible signs of slowing momentum.
Unless bulls regain control above 46,400, the market may experience a short-term pullback toward the lower demand area.
This analysis is for educational and informational purposes only — not financial advice. Always confirm with your own price action and risk management strategy before making any trading decisions.
Please like and comment below to support our traders. Your reactions will motivate us to do more analysis in the future 🙏✨
Harry Andrew @ ZuperView
US500 rallied despite lingering risks of regional banks stress
Fears surrounding regional banks that rattled markets quickly faded, as reassuring earnings results and President Trump’s conciliatory tone toward China restored investor confidence.
Earlier this week, Zions Bank and Western Alliance Bank reported losses tied to loan fraud, reviving fears reminiscent of the Silicon Valley Bank collapse. However, stronger-than-expected earnings and limited signs of credit deterioration reassured investors and eased market jitters. Moody’s noted that while concerns over bad loans persist, there is little evidence of systemic risk. They added that regional banks’ key health metrics remain solid.
US500 briefly tested the support at 6530 before approaching the resistance at 6700 again. The index remains above bullish EMAs, indicating a potential extension of bullish momentum.
If US500 closes above 6700, it may gain upward momentum toward the next resistance at 6800. Conversely, if it closes near EMA21, the index may retreat toward the next support at 6530.

US30 Under Pressure! SELL!
My dear followers,
I analysed this chart on US30 and concluded the following:
The market is trading on 46.226 pivot level.
Bias - Bearish
Technical Indicators: Both Super Trend & Pivot HL indicate a highly probable Bearish continuation.
Target - 45.961
Safe Stop Loss - 46.378
About Used Indicators:
A super-trend indicator is plotted on either above or below the closing price to signal a buy or sell. The indicator changes color, based on whether or not you should be buying. If the super-trend indicator moves below the closing price, the indicator turns green, and it signals an entry point or points to buy.
Disclosure: I am part of Trade Nation's Influencer program and receive a monthly fee for using their TradingView charts in my analysis.
———————————
WISH YOU ALL LUCK

US30US30 still have some upside, correction and one more push up is possible in this week.
Disclosure: We are part of Trade Nation's Influencer program and receive a monthly fee for using their TradingView charts in our analysis.
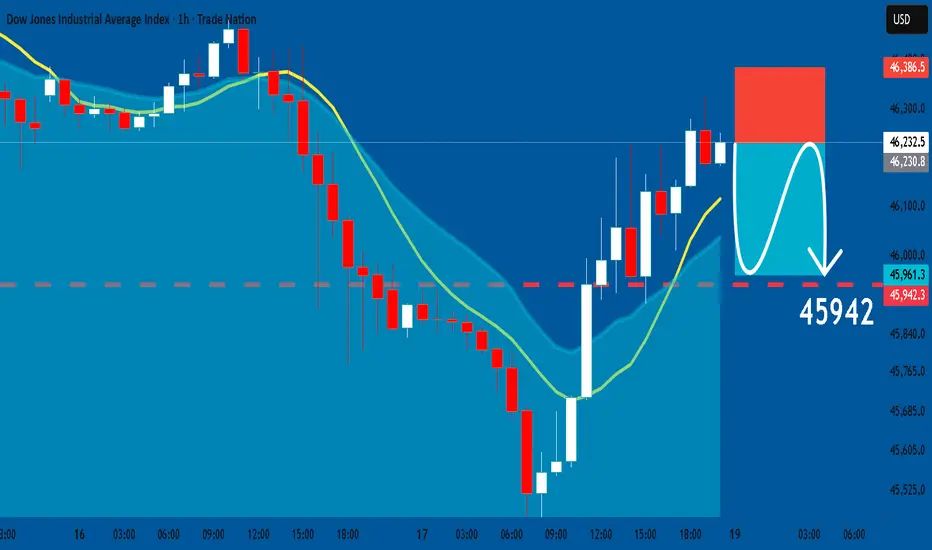
US30: Short Trade Explained
US30
- Classic bearish pattern
- Our team expects retracement
SUGGESTED TRADE:
Swing Trade
Sell US30
Entry - 46232
Stop - 46386
Take - 45943
Our Risk - 1%
Start protection of your profits from lower levels
Disclosure: I am part of Trade Nation's Influencer program and receive a monthly fee for using their TradingView charts in my analysis.
❤️ Please, support our work with like & comment! ❤️
US30 (DJI) Technical Forecast: Navigating Critical JunctureThe US30 consolidates near a significant technical inflection point at 46,233.8 . Our multi-timeframe analysis reveals a battle between bullish structure and emerging bearish divergences.
📊 Multi-Timeframe Synthesis & Market Structure
Daily (Trend Bias): The primary trend remains bullish above the key support confluence of 4 5,800 (50 EMA & Rising Trendline). However, price is testing the lower boundary of a bullish channel. A break below 45,800 would signal a deeper correction towards 45,200.
4H & 1H (Swing Setup): The index is forming a potential Bearish Rising Wedge . RSI on the 4H chart shows a clear bearish divergence, indicating weakening momentum. This is a cautionary sign for swing bulls.
Intraday (15M/5M - Precision): Price is trapped between immediate resistance at 46,450 and support at 46,100. The 5M chart shows Anchored VWAP (from yesterday's low) acting as dynamic resistance. A break below 46,100 targets 45,950.
🧠 Key Technical Narratives & Theories
Elliott Wave & Wyckoff: The pullback from the recent high exhibits characteristics of a Wave 4 correction or a Wyckoffian re-distribution phase. Volume analysis on breakdowns will be key.
Gann Angle & Square of 9: Critical Gann support resides near 45,950-46,000. A decisive break below this zone opens the path for a move towards the next Gann square level near 45,500.
Ichimoku Cloud: On the 4H, price is hovering above the Kumo (cloud). The Tenkan-Sen (red line) is flat, indicating short-term equilibrium. A break below the cloud would be a strong bearish trigger.
⚖️ Momentum & Volume Assessment
RSI (14): Reading of 52 on the 1D, neutral but leaning bearish on lower timeframes with divergences.
Bollinger Bands (20): Price is pressing the middle band (20 SMA). A sustained break below it often signals a shift to a short-term bearish phase.
Anchored VWAP & Volume: Recent up-moves have occurred on declining volume, suggesting a lack of strong bullish conviction—a potential bull trap formation.
🛠️ Trade Plan & Levels
Swing Short Idea: Consider shorts on a break & close below 46,100 (15M), targeting 45,800 and 45,500. Stop loss above 46,550.
Intraday Long Idea: Only above 46,450 (with volume), targeting 46,700. Stop loss below 46,300.
Intraday Short Idea: On a rejection from 46,450 or break of 46,100, targeting 45,950.
💡 The Bottom Line
The US30 is at a critical decision point. The bullish trend is under threat until price reclaims 46,700. The weight of evidence from divergences and pattern formation favors a bearish breakdown in the short term. Risk is elevated; position size accordingly.
Disclaimer: This is technical analysis, not financial advice. Trade at your own risk.