Us30 Trade Set Up Oct 17 2025Im overall still bearish so if we get a BOS of the 15m high i will expect price to target 4h FVG before continuing down to SSL levels or i would want to see price close under 15m swing low to then continue down
US30

Bearish drop?Dow Jones (US30) could rise to the pivot, whichis a pullback resistance and could reverse to the 1st support.
Pivot: 46,211.80
1st Support: 45,274.72
1st Resistance: 46,876.77
Disclaimer:
The above opinions given constitute general market commentary, and do not constitute the opinion or advice of IC Markets or any form of personal or investment advice.
Any opinions, news, research, analyses, prices, other information, or links to third-party sites contained on this website are provided on an "as-is" basis, are intended only to be informative, is not an advice nor a recommendation, nor research, or a record of our trading prices, or an offer of, or solicitation for a transaction in any financial instrument and thus should not be treated as such. The information provided does not involve any specific investment objectives, financial situation and needs of any specific person who may receive it. Please be aware, that past performance is not a reliable indicator of future performance and/or results. Past Performance or Forward-looking scenarios based upon the reasonable beliefs of the third-party provider are not a guarantee of future performance. Actual results may differ materially from those anticipated in forward-looking or past performance statements. IC Markets makes no representation or warranty and assumes no liability as to the accuracy or completeness of the information provided, nor any loss arising from any investment based on a recommendation, forecast or any information supplied by any third-party.

Us30 Trade Set Up Oct 16 2025Price is trading in between PDH/PDL and has filled a 4h and 1h bearish FVG so for sells id want to see London highs/BSL swept but closed under followed by internal 1m bearish structure to take sells to Asia lows/SSL or PDL but for buys id want to see Asia lows/SSl swept first to then look for bullish structure on the 1m to catch buys to PDH

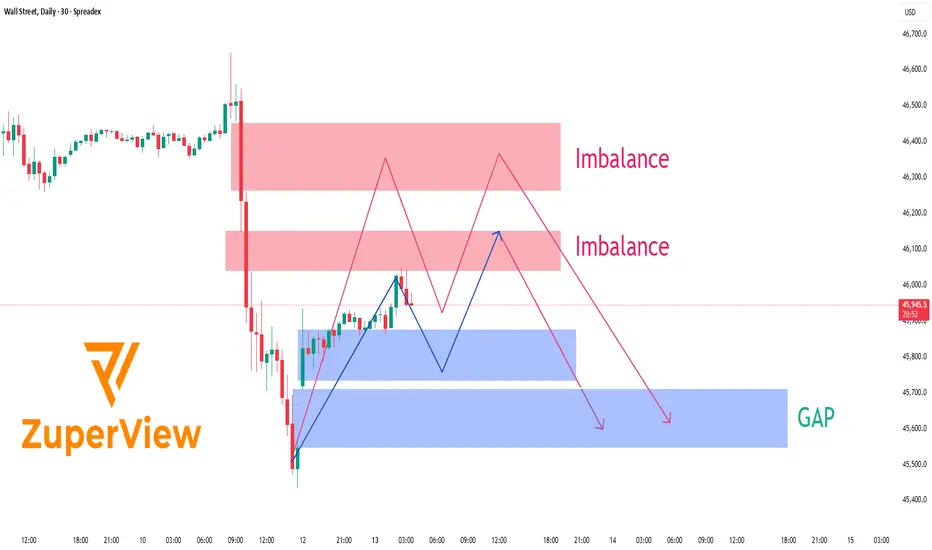
US30: Rebound before the stormTechnical Outlook – Wall Street Index (30-Minute Chart)
After the announcement that the U.S. will impose a 100 % tariff on Chinese imports, Wall Street ⚡ plunged sharply, leaving behind distinct Imbalance zones and an unfilled GAP lurking below current price levels.
At present, price is hovering around 45,950 💵, showing a modest rebound after tapping into a short-term demand zone. Above, two notable Imbalance areas stand out — around 46,000-46,150 and 46,250-46,450 - both formed as aggressive sell orders flooded the market following the latest wave of trade-war headlines 🌍.
The likely scenario 🎯:
Price could continue to retrace upward ↗️ to test one of these supply/imbalance zones before sellers re-enter the market. If selling pressure remains dominant, the index may resume its decline toward the GAP area around 45,500 - 45,650 📉, where liquidity is still unfilled and buyers may look to step back in.
Current price action indicates a corrective pullback rather than a full reversal. Trading volume is thinning 📉, candlestick patterns show signs of exhaustion 🕯️, and the upper imbalance zones remain untouched — all signaling that sellers still hold the upper hand.
________________________________________
🌍 Fundamental Context – U.S. vs. China Tensions Heating Up
On October 10, President Trump officially declared a 100 % additional tariff on Chinese goods, effective November 1, 2025 — the most aggressive move since the 2018-2019 trade war.
Beijing immediately condemned the plan, warning of “corresponding countermeasures”, including restrictions on rare-earth exports and higher port fees on U.S. vessels. While strong in tone, China has so far stopped short of announcing a direct tariff retaliation, signaling a cautious approach while keeping the door open for talks.
Washington, meanwhile, insists the measure aims to “protect American interests and reduce over-reliance on China’s supply chains,” but officials also noted that negotiations remain possible if China shows “substantive goodwill.”
Financial markets reacted swiftly 💥:
• U.S. and Asian equities dropped 2–3 % on average.
• USD strengthened, while gold and JPY rallied as safe-haven flows increased.
• Tech and industrial stocks with strong China exposure saw the largest losses.
Overall, risk sentiment remains fragile as investors brace for a prolonged phase of trade uncertainty.
________________________________________
💡 Trading Summary
Short-term structure favors a sell-the-rally approach. The market may retest upper imbalance zones before resuming its downtrend toward the 45,500 USD GAP area.
If U.S.–China tensions intensify further, downside momentum could accelerate. Conversely, any sign of renewed dialogue or tariff delay could trigger a short-term rebound — but bias remains bearish until the market reclaims 46,300 USD convincingly.
In short: patience, risk control, and reaction to headlines are key this week. ⚖️
Please like and comment below to support our traders. Your reactions motivate us to do more analysis in the future 🙏✨
Harry Andrew @ ZuperView
US30: Flash pump not enough to break resistanceSPREADEX:DJI Analysis – Weak flash pump signals a possible pullback ahead.
📊 Technical Overview
On the 30-minute timeframe, Wall Street (US30) has recently shown a quick rebound — a flash pump — after a strong flash dump earlier in the week. Price is now trading near the 46,400 – 46,500 area, right below the major resistance zone between 46,600 – 46,750 (highlighted in green).
Below, the support range around 46,050 – 46,200 (marked in red) remains the key demand area.
⚙️ Market Structure Insight
The recent flash pump recovered quickly from the previous drop, but the momentum appears insufficient to break through the prior flash dump zone. This imbalance often indicates a short-term exhaustion in buying pressure, meaning the market could need one more corrective leg before finding new strength.
🧭 Main Scenario
The most likely scenario is that price will move sideways or slightly pull back toward the 46,200 support zone before deciding its next major move.
• If buyers defend 46,200 successfully, the index could attempt another test of 46,700.
• However, failure to hold that support might open the door to a deeper correction.
💡 Personal View
The weak flash pump following the previous flash dump signals that the market is still in a consolidation and absorption phase. A short-term pullback could help reset momentum before a more sustainable trend emerges.
⛔ This analysis represents a personal technical perspective and should not be taken as investment advice. Always manage your risk before entering any position.
Please like and comment below to support our traders. Your reactions will motivate us to do more analysis in the future 🙏✨
Harry Andrew @ ZuperView

US30 Trade Plan – Range Breakout + Smart Money ManipulationI’m currently watching the US30 (Dow Jones Index) 🏦. On the 4-hour timeframe, we can see a strong uptrend forming — higher highs and higher lows 📈. Whether this trend continues remains to be seen, but having a solid trading plan is key ✅.
Here’s mine: On the 30-minute timeframe, price is currently moving within a defined range. If we see a break above the range, followed by a retracement and failed retest of the range high, I’ll be looking for a long opportunity 🚀.
If price instead breaks below the range, there could also be a short opportunity, though my preference is to stay long given the higher-timeframe bullish structure ⚙️.
⚠️ Keep an eye out for market manipulation — smart money algorithms often trigger fake breakouts to draw in buyers before sweeping liquidity and continuing the move. Stay alert and manage risk carefully.
📉 Disclaimer: This content is for educational purposes only and not financial advice.

US30 Short From Resistance!
HI,Traders !
#US30 went up sharply
But the price will soon hit
A wide horizontal resistance
Of 46641.8 from where we will
Be expecting a pullback and
A local move down !
Comment and subscribe to help us grow !

Us30 Trade Set Up Oct 15 2025Price has swept PDH and has formed a bullish 4h FVG which i am expecting price to come to 50% of it before continuing higher

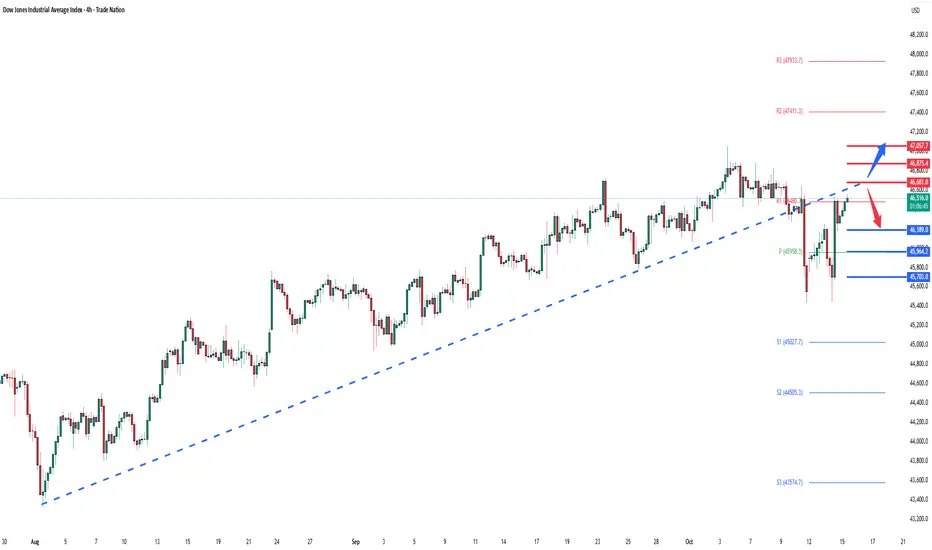
DowJones retest of pivotal 46680 level? Key Support and Resistance Levels
Resistance Level 1: 46680
Resistance Level 2: 46875
Resistance Level 3: 47060
Support Level 1: 46190
Support Level 2: 45965
Support Level 3: 45700
This communication is for informational purposes only and should not be viewed as any form of recommendation as to a particular course of action or as investment advice. It is not intended as an offer or solicitation for the purchase or sale of any financial instrument or as an official confirmation of any transaction. Opinions, estimates and assumptions expressed herein are made as of the date of this communication and are subject to change without notice. This communication has been prepared based upon information, including market prices, data and other information, believed to be reliable; however, Trade Nation does not warrant its completeness or accuracy. All market prices and market data contained in or attached to this communication are indicative and subject to change without notice.
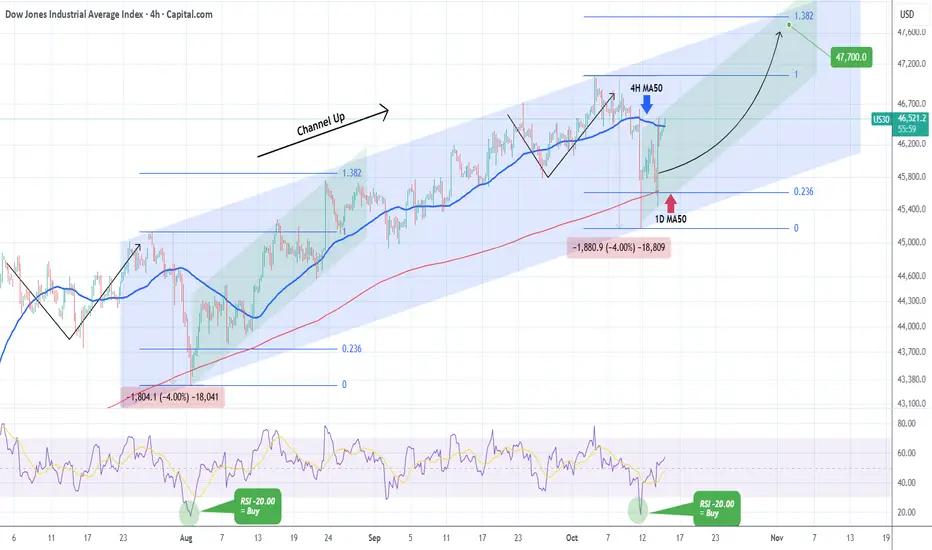
DOW JONES bounced at the bottom of the Channel Up. Buy signal.Dow Jones (DJI) has been trading within a 3-month Channel Up, with last Friday's flash crash breaching marginally below its 1D MA50 (red trend-line). That touched the bottom of the pattern and is technically a Higher Low, identical to the what the previous Bearish Leg did on the August 01 Low.
As you can see both Legs declined by -4.00% with their 4H RSIs touching the -20.00 level and rebounded. That is a technical Buy Signal, the strongest you can get within this Channel Up, and as long as the pattern's bottom holds, we expect another rise to the 1.382 Fibonacci extension (Our Target is 47700), similar to August's Bullish Leg.
-------------------------------------------------------------------------------
** Please LIKE 👍, FOLLOW ✅, SHARE 🙌 and COMMENT ✍ if you enjoy this idea! Also share your ideas and charts in the comments section below! This is best way to keep it relevant, support us, keep the content here free and allow the idea to reach as many people as possible. **
-------------------------------------------------------------------------------
💸💸💸💸💸💸
👇 👇 👇 👇 👇 👇
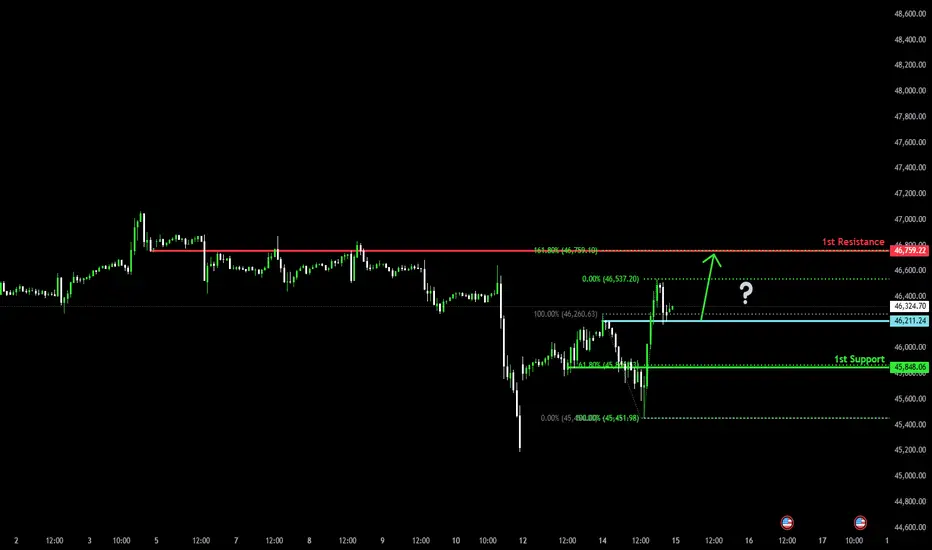
Bullish momentum to extend?Dow Jones (US30) is reacting off the pivot, which acts as a pullback support and could rise to the 1st resistance that aligns with the 161.8% Fibonacci extension.
Pivot: 46,211.24
1st Support: 45,848.06
1st Resistance: 45,759.22
Disclaimer:
The above opinions given constitute general market commentary, and do not constitute the opinion or advice of IC Markets or any form of personal or investment advice.
Any opinions, news, research, analyses, prices, other information, or links to third-party sites contained on this website are provided on an "as-is" basis, are intended only to be informative, is not an advice nor a recommendation, nor research, or a record of our trading prices, or an offer of, or solicitation for a transaction in any financial instrument and thus should not be treated as such. The information provided does not involve any specific investment objectives, financial situation and needs of any specific person who may receive it. Please be aware, that past performance is not a reliable indicator of future performance and/or results. Past Performance or Forward-looking scenarios based upon the reasonable beliefs of the third-party provider are not a guarantee of future performance. Actual results may differ materially from those anticipated in forward-looking or past performance statements. IC Markets makes no representation or warranty and assumes no liability as to the accuracy or completeness of the information provided, nor any loss arising from any investment based on a recommendation, forecast or any information supplied by any third-party.
Dow Jones Returns to the 46,000 Level Since the beginning of the week, the Dow Jones Index has maintained a notable bullish bias, extending a two-day winning streak as the equity benchmark posts a gain of around 2.20% in the short term. For now, buying pressure has supported the price recovery following the sharp correction seen last Friday, which was triggered by the escalation of trade tensions between China and the United States.
Although no major trade agreement has been announced, the aggressive tone of the tariff threats appears to have eased slightly, helping the market regain confidence in the short term. However, it’s important to note that if tensions escalate again, the Dow Jones could once more show heightened sensitivity to such developments, quickly reactivating selling pressure in the coming trading sessions.
Uptrend at Risk
The uptrend line, which had been sustained through much of 2025, has started to weaken following last Friday’s sharp correction. As a result, the average bullish momentum has entered a neutral zone in the short term. Currently, there is a recovery attempt from the previous downward move, though it has not yet been strong enough to bring prices back to recent highs.
If buying pressure fails to remain decisive over the next few sessions, a period of market indecision could emerge, potentially leading to a sideways range in the short term.
RSI
The RSI line continues to hover around the 50 level, reflecting a neutral momentum over the past 14 sessions. As long as the indicator stays within this range, neutrality may dominate the market bias, leading to indecisive price movements in the coming days.
MACD
The MACD histogram also remains near the neutral (0) level, indicating that there is no clear directional strength in short-term moving averages. This reinforces the idea of indecision in the market, suggesting that the price action may remain range-bound without a defined trend in the near term.
Key Levels to Watch:
46,790 points – Major Resistance: Corresponds to the all-time high area of the index. Buying activity approaching or surpassing this level could reactivate the bullish trend and establish a dominant buying bias.
45,741 points – Near-Term Barrier: Aligns with the 50-period simple moving average. As long as prices continue to fluctuate around this level, a new short-term consolidation range could form.
44,834 points – Critical Support: Represents the most stable neutral zone in recent weeks and coincides with the Ichimoku cloud boundary in the short term. A decisive break below this level could trigger a stronger bearish bias, putting the year-long uptrend at risk and potentially signaling the start of a new downward phase in the short term.
Written by Julian Pineda, CFA – Market Analyst

Us30 Trade Set Up Oct 14 2025Price has swept both PDH and PDL and has formed a bearish 4h FVG, so i will be trading with the bearish trend looking for sells after London highs get swept as liquidity and look for a 1m IFVG/CISD to target swing lows

DowJones trend change? Key resistance zone at 46262Key Support and Resistance Levels
Resistance Level 1: 46262
Resistance Level 2: 46476
Resistance Level 3: 46700
Support Level 1: 45433
Support Level 2: 45253
Support Level 3: 45025
This communication is for informational purposes only and should not be viewed as any form of recommendation as to a particular course of action or as investment advice. It is not intended as an offer or solicitation for the purchase or sale of any financial instrument or as an official confirmation of any transaction. Opinions, estimates and assumptions expressed herein are made as of the date of this communication and are subject to change without notice. This communication has been prepared based upon information, including market prices, data and other information, believed to be reliable; however, Trade Nation does not warrant its completeness or accuracy. All market prices and market data contained in or attached to this communication are indicative and subject to change without notice.

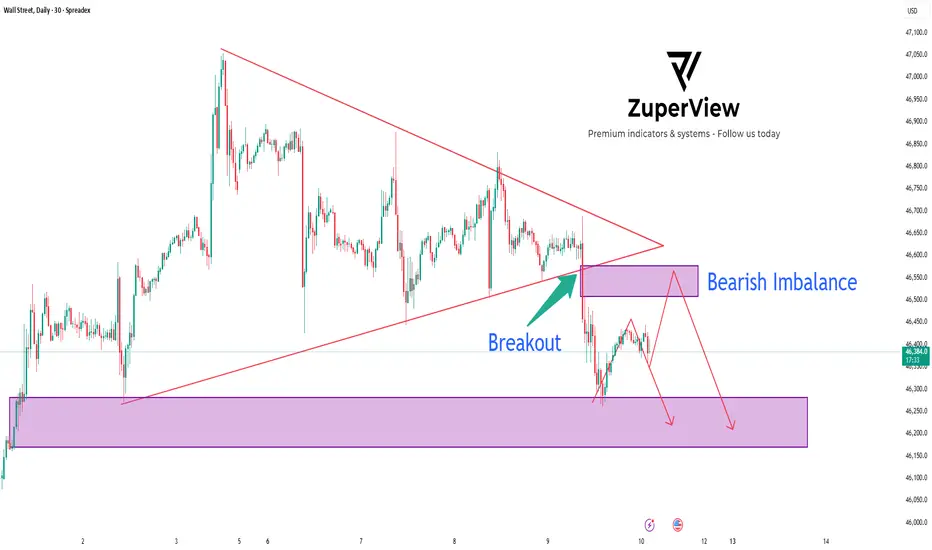
US30: Triangle breakout signal deeper sell move
📉 US30 Analysis: 4-Layer Resistance, Bearish Imbalance & Triangle Breakout | TradingView
The SPREADEX:DJI just printed a clean bearish breakout from a symmetrical triangle pattern on the 30-minute chart 🕒.
What makes this setup stand out is the 4-layer resistance zone perfectly overlapping with a Bearish Imbalance, creating a strong confluence for a potential continuation to the downside.
________________________________________
🧠 Technical Overview
On TradingView, the chart shows multiple lower highs forming inside a symmetrical triangle — a sign of buying exhaustion and seller accumulation. After several attempts, price finally broke below the structure, confirming a bearish market shift.
Key zones:
🔴 4-Layer Resistance: 46,850 → 46,550
⚫ Bearish Imbalance: 46,500 – 46,550
🟣 Demand Zone / Support: 46,150 – 46,250
Each resistance layer acted as a rejection point, showing how Smart Money continues to distribute orders and defend that area aggressively.
________________________________________
📊 Breakout – Retest – Continuation Setup
Following the breakout, price made a quick pullback to retest the 4-layer resistance zone — right where the Bearish Imbalance sits.
This is a textbook Breakout–Retest–Continuation pattern on TradingView, confirming that sellers are still in control.
1️⃣ Breakout: Price breaks below the triangle.
2️⃣ Retest: Price retraces to test the 4-layer resistance and imbalance.
3️⃣ Continuation: Strong rejection signals the next bearish leg.
________________________________________
💡 Trading Plan
Our trading plan for this setup is straightforward. I’m waiting for price to retest the 46,500–46,550 zone and show clear signs of rejection — such as a bearish engulfing candle or a break of structure on lower timeframes.
If confirmed, I’ll look to enter a short position targeting the Demand Zone around 46,150–46,250.
A stop loss would be placed just above 46,650, beyond the resistance cluster, to protect against false breakouts.
This plan aligns perfectly with Smart Money Concept (SMC) and Price Action trading, offering a strong risk-to-reward ratio 📈.
________________________________________
🧩 Market Psychology
✅ The four consecutive rejections at the same price zone clearly show how institutional traders are defending supply levels.
✅ Every time price pushes higher, Smart Money sells into liquidity, leaving wicks and imbalances behind.
✅ This behavior reinforces the bearish bias and supports the idea of a continued drop once short-term liquidity is collected.
________________________________________
🔎 Summary
✅ Bearish breakout confirmed from the triangle pattern
🔴 Strong 4-layer resistance overlapping with Bearish Imbalance
📉 Expecting price to continue toward the lower Demand Zone
This setup is clean, confluence-rich, and ideal for traders using TradingView, Price Action, and Smart Money Concepts.
A well-timed short from this zone could deliver a high-probability trade with excellent structure confirmation 🔥.
Please like and comment below to support our traders. Your reactions will motivate us to do more analysis in the future 🙏✨
Harry Andrew @ ZuperView
NASDAQ INDEX (US100): Bearish Outlook Explained
US100 stopped growing after a test of the underlined intraday horizontal supply zone.
A formation of a bearish engulfing candle after its test suggests a strong
bearish pressure from that.
I think that the market will drop at least to 24030 level.
❤️Please, support my work with like, thank you!❤️

Dow Jones - Looking To Sell Pullbacks In The Short TermH4 - Strong bearish move.
Uptrend line breakout.
No opposite signs.
Currently it looks like a pullback is happening.
Expecting bearish continuation after pullback until the strong resistance zone holds.
If you enjoy this idea, don’t forget to LIKE 👍, FOLLOW ✅, SHARE 🙌, and COMMENT ✍! Drop your thoughts and charts below to keep the discussion going. Your support helps keep this content free and reach more people! 🚀

US30 H4 | Bullish RiseDow Jones (US30) has reacted off the buy entry at 45,831.82, which is a pullback support and oculd potentially rise from this level to the take profit.
Stop loss is at 45,441.31, which is a pullback support.
Take profit is at 46,530.01, which is an overlap resistance.
High Risk Investment Warning
Trading Forex/CFDs on margin carries a high level of risk and may not be suitable for all investors. Leverage can work against you.
Stratos Markets Limited (tradu.com ):
CFDs are complex instruments and come with a high risk of losing money rapidly due to leverage. 65% of retail investor accounts lose money when trading CFDs with this provider. You should consider whether you understand how CFDs work and whether you can afford to take the high risk of losing your money.
Stratos Europe Ltd (tradu.com ):
CFDs are complex instruments and come with a high risk of losing money rapidly due to leverage. 66% of retail investor accounts lose money when trading CFDs with this provider. You should consider whether you understand how CFDs work and whether you can afford to take the high risk of losing your money.
Stratos Global LLC (tradu.com ):
Losses can exceed deposits.
Please be advised that the information presented on TradingView is provided to Tradu (‘Company’, ‘we’) by a third-party provider (‘TFA Global Pte Ltd’). Please be reminded that you are solely responsible for the trading decisions on your account. There is a very high degree of risk involved in trading. Any information and/or content is intended entirely for research, educational and informational purposes only and does not constitute investment or consultation advice or investment strategy. The information is not tailored to the investment needs of any specific person and therefore does not involve a consideration of any of the investment objectives, financial situation or needs of any viewer that may receive it. Kindly also note that past performance is not a reliable indicator of future results. Actual results may differ materially from those anticipated in forward-looking or past performance statements. We assume no liability as to the accuracy or completeness of any of the information and/or content provided herein and the Company cannot be held responsible for any omission, mistake nor for any loss or damage including without limitation to any loss of profit which may arise from reliance on any information supplied by TFA Global Pte Ltd.
The speaker(s) is neither an employee, agent nor representative of Tradu and is therefore acting independently. The opinions given are their own, constitute general market commentary, and do not constitute the opinion or advice of Tradu or any form of personal or investment advice. Tradu neither endorses nor guarantees offerings of third-party speakers, nor is Tradu responsible for the content, veracity or opinions of third-party speakers, presenters or participants.

Us30 Trade Set Up Oct 13 2025Overall price is still bearish but today i can see price sweeping SSL, touching 50% of the 1h Gap and targeting the 4h FVG before continuing its bearish trend

US30 - Futures Rebound as Trump Calms U.S.–China Trade TensionsUS30 – Overview | Futures Rise as Trump Softens Tone on China
U.S. stock index futures advanced Monday, recovering from Friday’s pullback, as investors shifted back to risk assets following President Donald Trump’s softer stance on China.
Trump signaled a more measured approach, easing concerns over trade escalation after previously announcing steep tariffs and export restrictions tied to rare earth controls.
Market sentiment improved modestly, though caution remains as investors await further clarity on policy direction and upcoming U.S. data.
Technical Outlook
The Dow Jones maintains a bearish bias while trading below the pivot zone at 46,000.
As long as the price holds under this level, momentum favors downside toward 45,680 → 45,470, with increased pressure if a 1H candle closes below 45,680.
A 1H close above 46,120 would shift sentiment to bullish, targeting 46,400 → 46,630, potentially confirming a short-term reversal.
Pivot Line: 45,920
Resistance: 46,120 · 46,400 · 46,630
Support: 45,680 · 45,500 · 45,285
Summary:
US30 remains bearish below 46,000, with a possible retest of key supports at 45,680–45,470.
A break above 46,120 would invalidate the bearish view and open the way for a recovery toward 46,400.
US 30 POETENTIAL BULLISH RUNAfter setting a strong low on Friday, Dow Jones Industrial Average is likely to correct close to the rejection thus cueing for long entries. be on the lookout for those buys at around 45300. Buy stops at the current weekly high.

US30The Dow Jones (US30) has experienced a strong bearish move, breaking below recent consolidation levels. Currently, price is testing a key demand zone around 45,263 – 45,206, where a potential short-term reversal may occur if buyers step in.
Key Reversal Zones:
🔹 45,686.9 – Possible first reaction zone / intraday support.
🔹 46,178.6 – First bullish target if a rebound occurs.
🔹 46,769.8 – 46,996.3 – Major resistance / key reversal area to watch for rejection or continuation.
As long as the price holds above 45,200, we could see a relief rally toward the upper resistance zones. A breakdown below this level could open the way to deeper bearish continuation.
📈 Bias: Short-term bullish correction within a larger bearish structure.
🕓 Timeframe: 4H

Us30US30 have had a drop last week due to tariff news, if we don't open with the gap then we will push up otherwise further drop can happen.
Disclosure: We are part of Trade Nation's Influencer program and receive a monthly fee for using their TradingView charts in our analysis.
