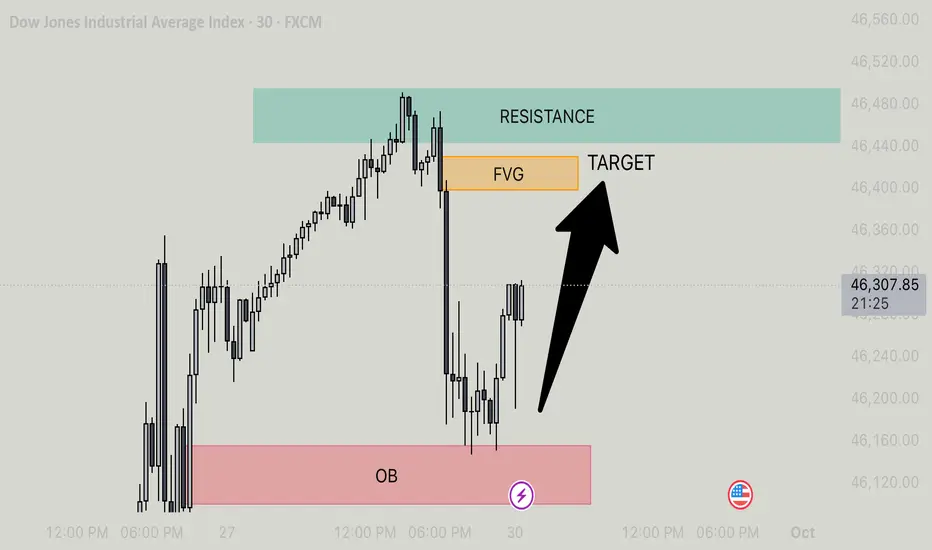
US30 - BULLISH MOMENTUM TARGETING FVG AFTER OB REJECTION Price is currently in a clear bullish phase following a strong reaction from the marked Order Block (OB) zone. This OB acted as a high-probability demand area, where institutional buying likely stepped in, reversing the prior bearish move and initiating a shift in market structure. The subsequent price action has formed a series of higher lows and bullish candles, indicating sustained buying pressure and a potential continuation toward the upside.
The next key area of interest is the Fair Value Gap (FVG), which represents an inefficiency in price where no trading occurred. These imbalances are often targeted by institutions to rebalance the market, and price tends to gravitate toward them. In this case, the FVG is positioned just below a well-defined resistance zone, creating a high-probability target for the current bullish move.
Given the lack of immediate overhead resistance before the FVG, and the presence of strong bullish momentum, price is expected to continue climbing until it reaches the FVG zone. Once this area is filled, we may see a reaction or potential rejection, but for now, the structure supports a move upward. Traders should watch for continuation patterns, such as bullish flags or breakouts, as confirmation that price will tap into the FVG before any significant reversal occurs.
US30
Us30 Trade Set Up Sep 29 2025Price is now bullish creating HH/HL and closed above PDH so i will look for internal SSL to be swept then a 1m IFVG/CISD retest to price higher towards BSL
www.tradingview.com

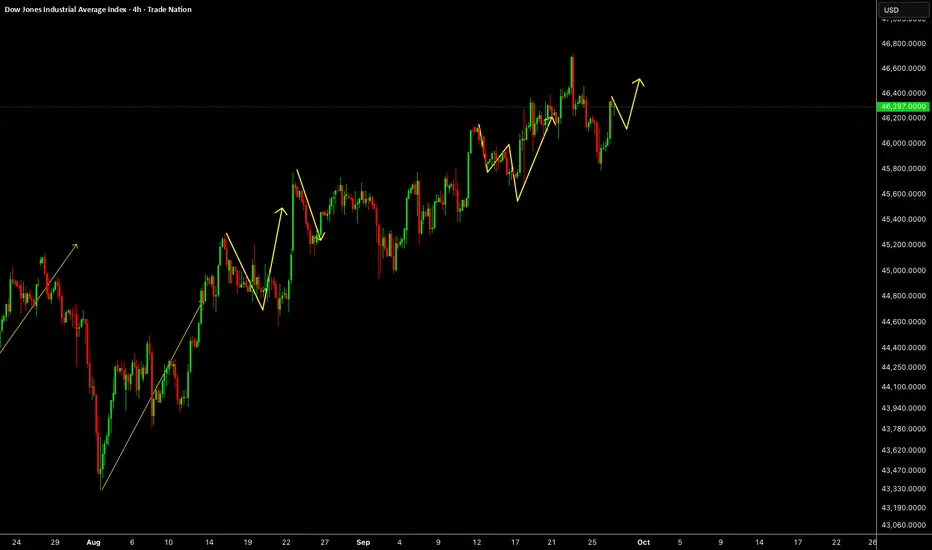
US30US30 needs some correction and one more push up to take ATH.
Disclosure: We are part of Trade Nation's Influencer program and receive a monthly fee for using their TradingView charts in our analysis.
US30 A Fall Expected! SELL
My dear subscribers,
My technical analysis for US30 is below:
The price is coiling around a solid key level - 46250
Bias - Bearish
Technical Indicators: Pivot Points High anticipates a potential price reversal.
Super trend shows a clear sell, giving a perfect indicators' convergence.
Goal - 46113
My Stop Loss - 46325
About Used Indicators:
By the very nature of the supertrend indicator, it offers firm support and resistance levels for traders to enter and exit trades. Additionally, it also provides signals for setting stop losses
Disclosure: I am part of Trade Nation's Influencer program and receive a monthly fee for using their TradingView charts in my analysis.
———————————
WISH YOU ALL LUCK

US30: 50K MAGNET ACTIVATED! Historic Breakout Loading# 🚀 US30: 50K MAGNET ACTIVATED! Historic Breakout Loading 📊
Current Price: 49,269.7 | Date: Sept 27, 2025 ⏰
📈 INTRADAY TRADING SETUPS (Next 5 Days)
🎯 BULLISH SCENARIO
Entry Zone: 49,200 - 49,300 📍
Stop Loss: 49,000 🛑
Target 1: 49,600 🎯
Target 2: 49,850 🚀
🎯 BEARISH SCENARIO
Entry Zone: 49,350 - 49,400 📍
Stop Loss: 49,500 🛑
Target 1: 48,900 🎯
Target 2: 48,650 📉
🔍 TECHNICAL ANALYSIS BREAKDOWN
📊 KEY INDICATORS STATUS:
RSI (14): 64.8 ⚡ *Bullish Momentum Zone*
Bollinger Bands: Upper Band Squeeze 🔥
VWAP: 49,180 - Strong Support Base 💪
EMA 20: 49,150 ✅ *Golden Cross Active*
Volume: Above Average 📊 *Institutional Flow*
🌊 WAVE ANALYSIS:
Elliott Wave: Wave 3 Extension in Progress 🌊
Fibonacci Target: 50,200 (161.8% Extension) 🎯
🔄 HARMONIC PATTERNS:
Bullish Cypher Completion at 49,100 ✨
Gartley PRZ Active - 49,050 Zone 🔄
⚖️ SWING TRADING OUTLOOK (1-4 Weeks)
🚀 BULLISH TARGETS:
Psychological: 50,000 🏆
Weekly Target: 50,300 🌙
Gann Square: 50,625 ⭐
📉 BEARISH INVALIDATION:
Weekly Support: 48,800 ⚠️
Critical Break: 48,500 🚨
🎭 MARKET STRUCTURE:
Trend: Strong Bullish Impulse 💪
Momentum: Accelerating 🔥
Wyckoff Phase: Mark-up Phase 📈
Ichimoku: All Systems Green 🟢
🏆 HISTORIC LEVELS:
50K Psychological: Major Magnet 🧲
All-Time High: 49,450 (Breaking Soon!) 💥
Monthly Pivot: 49,100 Support 🛡️
⚡ RISK MANAGEMENT:
Max Risk per Trade: 1% 🛡️
R:R Ratio: Minimum 1:3 ⚖️
Trailing Stops: Every 200 points 📏
🌍 MARKET CATALYSTS:
Economic Data Supporting Rally 📈
Corporate Earnings Momentum 💼
Fed Policy Tailwinds Continue 🏛️
🔥 CRITICAL WATCH ZONES:
Breakout: 49,350 confirmed close 💥
Support: 49,100 | 48,950 | 48,800 🛡️
Resistance: 49,500 | 49,750 | 50,000 🚧
🎯 FINAL VERDICT:
US30 poised for HISTORIC BREAKOUT to 50K! 🚀
Multiple confluences aligning perfectly! 💯
Bull flag formation targeting new ATH! 📈
Trade Management: Buy dips to VWAP support 💎
Key Level: Hold above 49,100 crucial 🔑
---
*⚠️ Disclaimer: Trading involves significant risk. Use proper position sizing. Educational purposes only.*
For individuals seeking to enhance their trading abilities based on the analyses provided, I recommend exploring the mentoring program offered by Shunya Trade. (Website: shunya dot trade)
I would appreciate your feedback on this analysis, as it will serve as a valuable resource for future endeavors.
Sincerely,
Shunya.Trade
Website: shunya dot trade
🔔 Follow for Live Updates | 💬 Drop Your 50K Predictions Below

US30: Bearish Continuation & Short Trade
US30
- Classic bearish setup
- Our team expects bearish continuation
SUGGESTED TRADE:
Swing Trade
Short US30
Entry Point - 46297
Stop Loss - 46377
Take Profit - 46148
Our Risk - 1%
Start protection of your profits from lower levels
Disclosure: I am part of Trade Nation's Influencer program and receive a monthly fee for using their TradingView charts in my analysis.
❤️ Please, support our work with like & comment! ❤️

US30 Resistance Cluster Above!
HI,Traders !
#US30 made a bearish
Breakout of the support
Cluster of the rising and
Horizontal support levels
Which is now a resistance
Cluster round 46329.8 then
Went down and made a local
Pullback on Thursday and
Friday but we are bearish
Biased mid-term so we
Will be expecting a further
Bearish move down this week !
Comment and subscribe to help us grow !

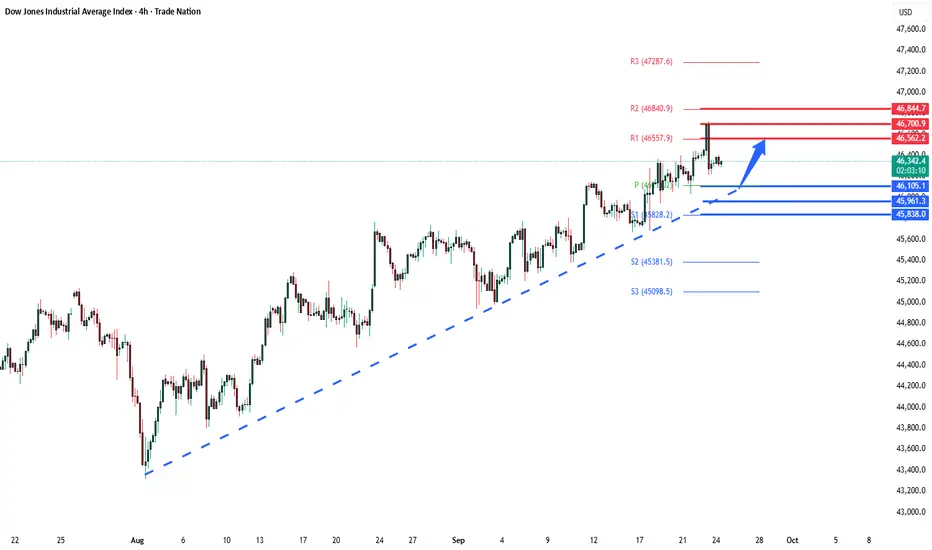
DowJones Key Trading Levels Key Support and Resistance Levels
Resistance Level 1: 46560
Resistance Level 2: 46700
Resistance Level 3: 46850
Support Level 1: 45960
Support Level 2: 45840
Support Level 3: 45670
This communication is for informational purposes only and should not be viewed as any form of recommendation as to a particular course of action or as investment advice. It is not intended as an offer or solicitation for the purchase or sale of any financial instrument or as an official confirmation of any transaction. Opinions, estimates and assumptions expressed herein are made as of the date of this communication and are subject to change without notice. This communication has been prepared based upon information, including market prices, data and other information, believed to be reliable; however, Trade Nation does not warrant its completeness or accuracy. All market prices and market data contained in or attached to this communication are indicative and subject to change without notice.
Us30 Trade Set Up Sep 26 2025Price pushed up from the daily FVG yesterday and has formed a 4h bearish FVG which acts has imbalance to be filled to if price continues to make internal bullish structure i will look for buys to target 50% of the 4h FVG/PDH
www.tradingview.com

US30: Rebound to resistance & continue to break down
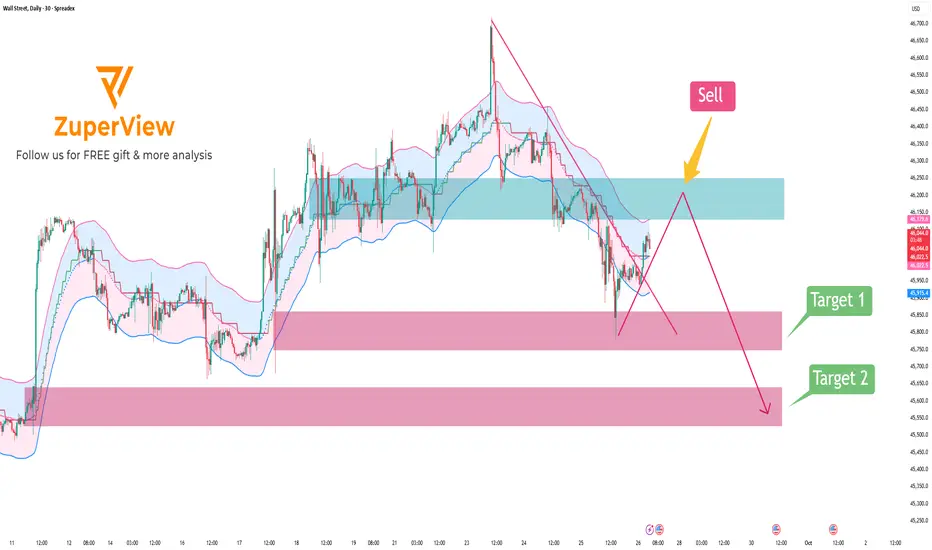
📝 1. Market Context
The SPREADEX:DJI dropped sharply from the recent high around 46,700 down to near 45,700, showing that sellers are currently in control in the short term. After this sharp decline, price is experiencing a mild recovery but still remains within a clearly defined downtrend channel and below key resistance.
🟥 2. Resistance Zone
The major resistance is located around 46,250 – 46,130 (highlighted in blue on the chart):
• This zone overlaps with the EMA and the upper band of the Keltner Channel.
• It was previously a sideways consolidation area that has now turned into resistance.
• It also intersects with the descending trendline, making a bearish rejection likely.
🟩 3. Support Zone
The nearest support lies at 45,858 – 45,748 (first pink zone).
If price breaks below this level, it is likely to continue falling toward the lower support zone at 45,520 – 45,640 (second pink zone).
🚨 4. Bearish Scenario
• Main scenario: Wait for a price pullback into the 46,250 – 46,130 area and watch for bearish signals → then SELL.
• Target: First target at 45,860 – 45,750 → if broken, expect further decline toward 45,520 – 45,640.
• Invalidation: A daily close above 46,250 would invalidate this bearish setup.
Please like and comment to support our traders. Your feedback motivates us to produce more analysis in the future 🙏✨
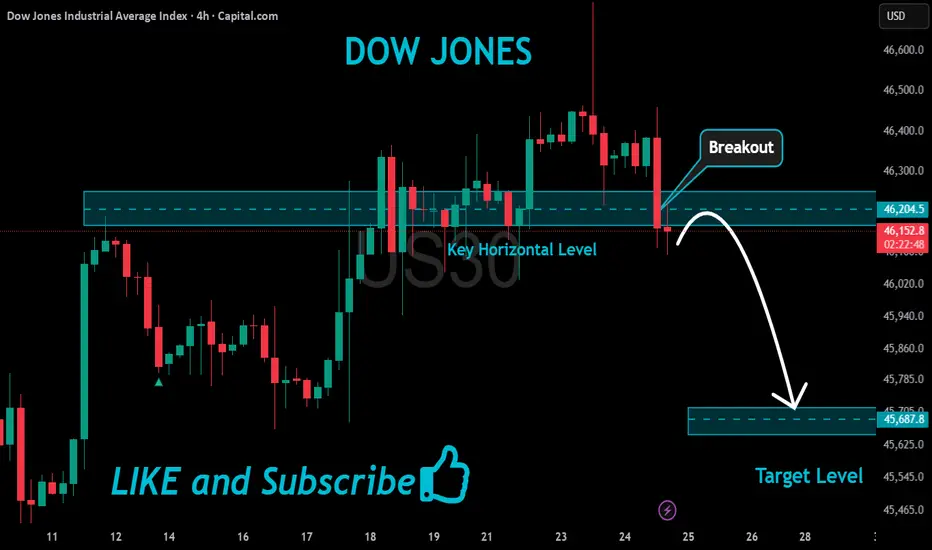
US30 Bearish Breakout!
HI,Traders !
#US30 made a bearish
Breakout of the key horizontal
Level of 46203.3 which is now
A resistance and the breakout
Is confirmed so we are bearish
Biased and we will be expecting
A further move down !
Comment and subscribe to help us grow !
Dow corrective pullback - pivotal zone!Key Support and Resistance Levels
Resistance Level 1: 46560
Resistance Level 2: 46700
Resistance Level 3: 46845
Support Level 1: 46100
Support Level 2: 45960
Support Level 3: 45840
This communication is for informational purposes only and should not be viewed as any form of recommendation as to a particular course of action or as investment advice. It is not intended as an offer or solicitation for the purchase or sale of any financial instrument or as an official confirmation of any transaction. Opinions, estimates and assumptions expressed herein are made as of the date of this communication and are subject to change without notice. This communication has been prepared based upon information, including market prices, data and other information, believed to be reliable; however, Trade Nation does not warrant its completeness or accuracy. All market prices and market data contained in or attached to this communication are indicative and subject to change without notice.
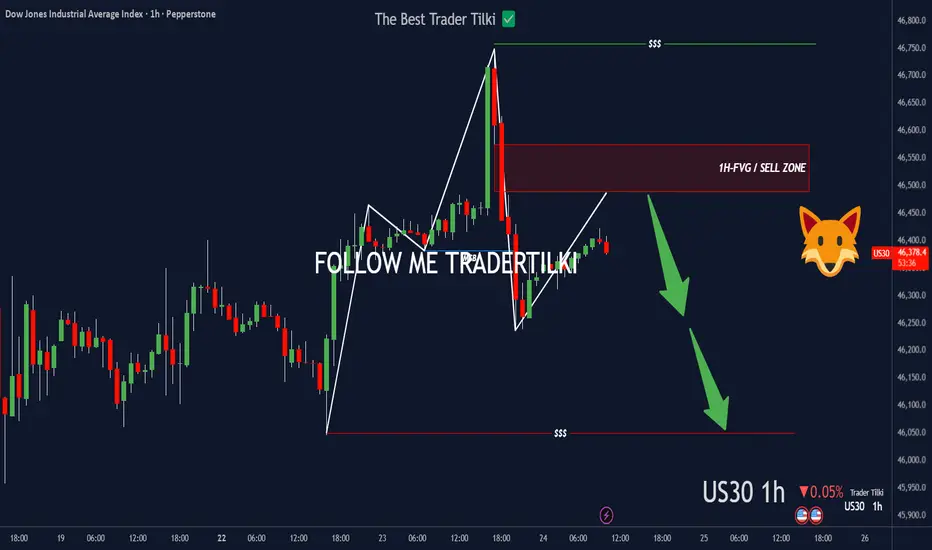
US30 left a footprint—FVG’s callin’.Hey Guys,
Once US30 hits my SELL zone, I’m pulling the trigger—targeting 46049.0
• Entry: 46574.5.0 or 46488.9
Set the stop point according to your own margin, my friends.
Every like you drop pushes me to share more setups like this. Big thanks to everyone showing support!
US30 H4 | Bearish drop offBased on the H4 chart analysis, we could see the price rise to the sell entry at 46,338.64, which is a pullback resistance that aligns with the 50% Fibonacci retracement and could drop from this level to the take profit.
Stop loss is at 46,676.09, which is a swing high resistance.
Take profit is at 45,762.38, which has been identified as an overlap support that lines up with the 50% Fibonacci retracement.
High Risk Investment Warning
Trading Forex/CFDs on margin carries a high level of risk and may not be suitable for all investors. Leverage can work against you.
Stratos Markets Limited (tradu.com ):
CFDs are complex instruments and come with a high risk of losing money rapidly due to leverage. 65% of retail investor accounts lose money when trading CFDs with this provider. You should consider whether you understand how CFDs work and whether you can afford to take the high risk of losing your money.
Stratos Europe Ltd (tradu.com ):
CFDs are complex instruments and come with a high risk of losing money rapidly due to leverage. 66% of retail investor accounts lose money when trading CFDs with this provider. You should consider whether you understand how CFDs work and whether you can afford to take the high risk of losing your money.
Stratos Global LLC (tradu.com ):
Losses can exceed deposits.
Please be advised that the information presented on TradingView is provided to Tradu (‘Company’, ‘we’) by a third-party provider (‘TFA Global Pte Ltd’). Please be reminded that you are solely responsible for the trading decisions on your account. There is a very high degree of risk involved in trading. Any information and/or content is intended entirely for research, educational and informational purposes only and does not constitute investment or consultation advice or investment strategy. The information is not tailored to the investment needs of any specific person and therefore does not involve a consideration of any of the investment objectives, financial situation or needs of any viewer that may receive it. Kindly also note that past performance is not a reliable indicator of future results. Actual results may differ materially from those anticipated in forward-looking or past performance statements. We assume no liability as to the accuracy or completeness of any of the information and/or content provided herein and the Company cannot be held responsible for any omission, mistake nor for any loss or damage including without limitation to any loss of profit which may arise from reliance on any information supplied by TFA Global Pte Ltd.
The speaker(s) is neither an employee, agent nor representative of Tradu and is therefore acting independently. The opinions given are their own, constitute general market commentary, and do not constitute the opinion or advice of Tradu or any form of personal or investment advice. Tradu neither endorses nor guarantees offerings of third-party speakers, nor is Tradu responsible for the content, veracity or opinions of third-party speakers, presenters or participants.

US30: Late-Cycle Pop or Pullback Setup?The 𝐃𝐨𝐰 is pressing fresh highs into a historically soft seasonal window with stretched momentum and limited follow-through. I’m initiating/adding to a daily timeframe short aiming for a retrace back into prior breakout territory. My baseline path is a drift lower toward 44,500–44,000 (T1) and then the broader demand band near 43,000–42,2500 (T2), where I’ll reassess.
This isn’t a “crash” call—just a tactical mean-reversion as macro tailwinds fade, breadth narrows and the first Fed cut shifts the narrative from “rates down” to “why they’re down.”
Technicals:
• Stretched swing: Price has stair-stepped higher with shallow pullbacks; we’re now extended above the 50/100-DMA stack with waning impulse on push days (smaller real bodies, upper wicks).
• Local resistance: Repeated stalls into the same supply shelf. I’m leaning into the most recent failed extension and fading the box.
Structure map:
• Entry: around/into the failed-break zone 46.4k area.
• Invalidation: daily close > recent spike highs around 47.7k-48.0k.
• Targets: T1 45,000–44,500 (prior ATH retest / micro-POC region); T2 44,000–43,000.
• Risk: 0.5–1.0R per add; scale in only on rejection prints or lower-highs.
Fundamentals:
1) The first Fed cut is not automatically bullish.
The Fed delivered a 25 bps cut in September and signaled more easing, which historically can coincide with late-cycle growth scares and choppier equity returns rather than a straight-line melt-up. The cut was framed around cooling activity and inflation progress. 
2) Growth data is mixed—manufacturing still weak.
The ISM Manufacturing PMI remained in contraction in August (48.7)—below the 50 expansion line—signaling ongoing softness in goods demand. That is typically a headwind for the Dow’s cyclical mix. 
3) ES500 (S&P 500) breadth is narrow; concentration risk elevated.
Mega-caps continue to dominate performance and index leadership, while equal-weight underperforms and concentration risk stays high—conditions that historically increase pullback vulnerability. 
4) Valuations are rich versus history.
FactSet’s mid-summer forward 12-month P/E for the S&P 500 hovered well above 5- and 10-year averages (>22x vs. ~19x/17x), leaving less cushion if growth wobbles or margins compress. 
5) Sentiment & seasonality aren’t tailwinds.
September/early Q4 are seasonally tricky—historically the weakest stretch for US equities—just as the market tries to price the path of cuts vs. growth. 
6) Policy & trade headline risk.
Tariff timelines and “reciprocal” duties remain in play (with officials signaling Aug-1 implementation and additional measures possible), a rolling overhang for global cyclicals and exporters tied into the Dow complex. 
Note: Please remember to adjust this trade idea according to your individual trading conditions, including position size, broker-specific price variations, and any relevant external factors. Every trader’s situation is unique, so it’s crucial to tailor your approach to your own risk tolerance and market environment.

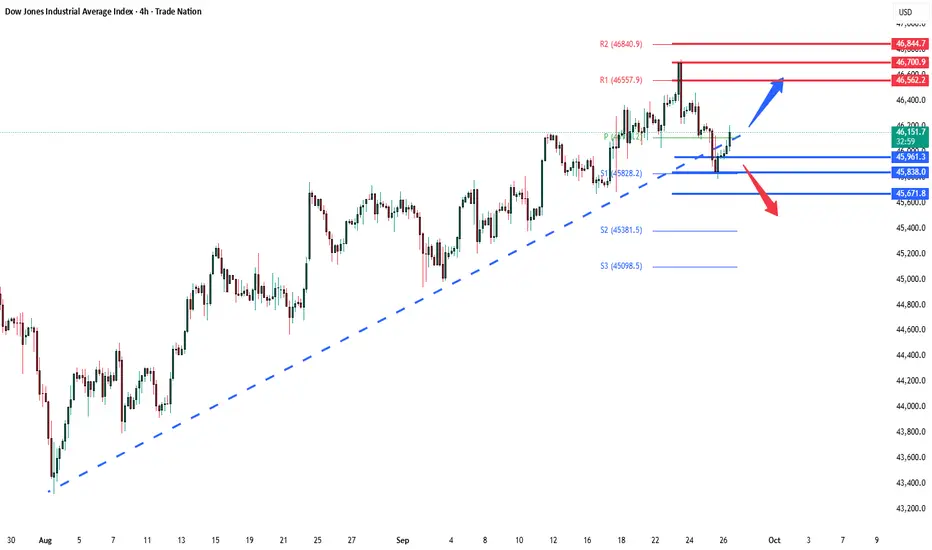
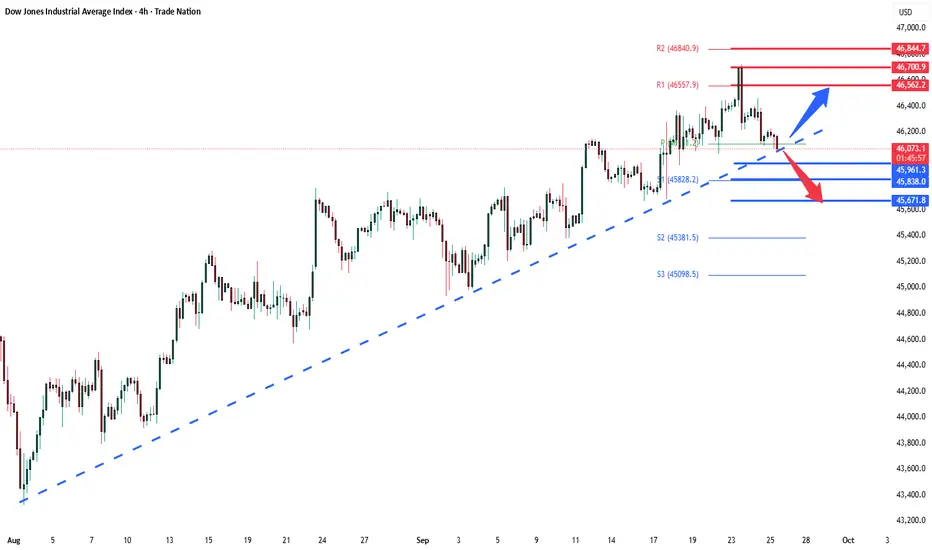
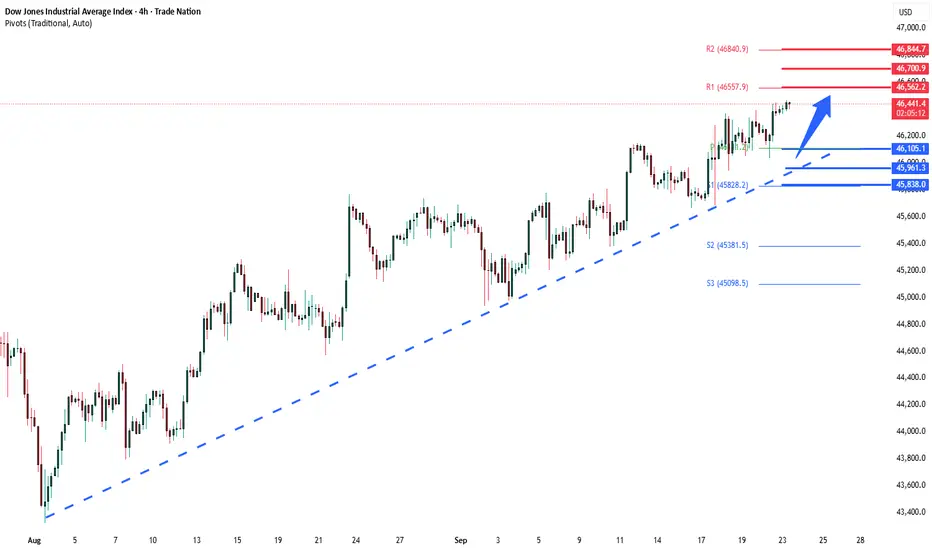
Bullish continuation?Dow Jones (US30) is reacting off the pivot which acts as an overlap support and could bounce to the 1st resistance which has been identified as a swing high resistance.
Pivot: 46,123.56
1st Support: 45,765.51
1st Resistance: 46,704.98
Disclaimer:
The above opinions given constitute general market commentary, and do not constitute the opinion or advice of IC Markets or any form of personal or investment advice.
Any opinions, news, research, analyses, prices, other information, or links to third-party sites contained on this website are provided on an "as-is" basis, are intended only to be informative, is not an advice nor a recommendation, nor research, or a record of our trading prices, or an offer of, or solicitation for a transaction in any financial instrument and thus should not be treated as such. The information provided does not involve any specific investment objectives, financial situation and needs of any specific person who may receive it. Please be aware, that past performance is not a reliable indicator of future performance and/or results. Past Performance or Forward-looking scenarios based upon the reasonable beliefs of the third-party provider are not a guarantee of future performance. Actual results may differ materially from those anticipated in forward-looking or past performance statements. IC Markets makes no representation or warranty and assumes no liability as to the accuracy or completeness of the information provided, nor any loss arising from any investment based on a recommendation, forecast or any information supplied by any third-party.

Us30 Trade Set Up Sep 24 2025price pushed down hard yesterday but still made a HL on the 1h also created a 1h FVG so i will want to see a test of that, if it respects it i will look for internal 1m bearish structure to look for sells but if it trades through it i will look for buys to PDH
www.tradingview.com

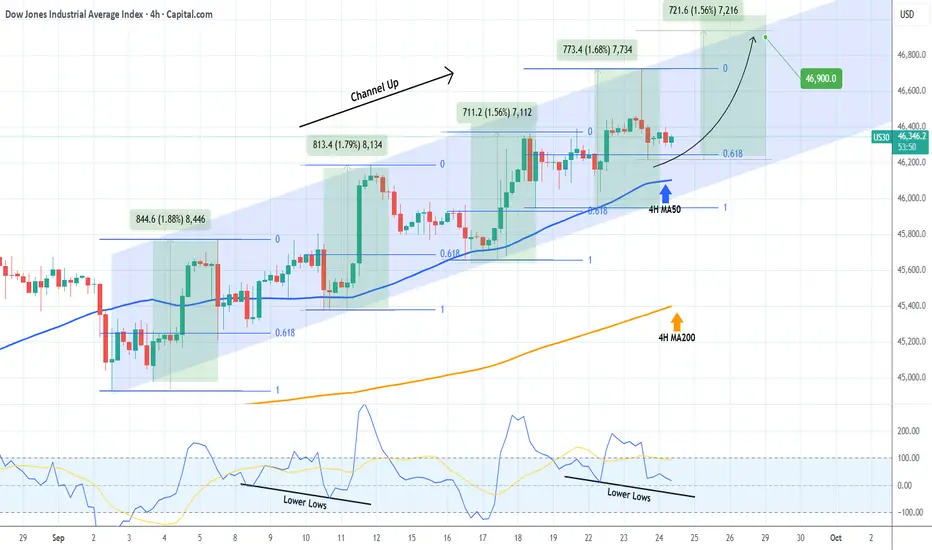
DOW JONES forming a bottom ahead of the next rally.Dow Jones (DJI) has been trading within a Channel Up since the start of September and right now it is consolidating after having hit the 0.618 Fibonacci retracement level, following a Higher High rejection at the top of the pattern.
As you can see, the 0.618 Fib was always pull-back tested after a Higher High, with the 4H MA50 (blue trend-line) also or at least coming very close to. As a result, the current 4H candle consolidation is technically a bottoming process before the new Bullish Leg.
The weakest Bullish Leg of this Channel Up has been +1.56%, which more than covers our 46900 Target.
-------------------------------------------------------------------------------
** Please LIKE 👍, FOLLOW ✅, SHARE 🙌 and COMMENT ✍ if you enjoy this idea! Also share your ideas and charts in the comments section below! This is best way to keep it relevant, support us, keep the content here free and allow the idea to reach as many people as possible. **
-------------------------------------------------------------------------------
💸💸💸💸💸💸
👇 👇 👇 👇 👇 👇
Dow overbought corrective pullback supported at 46100Key Support and Resistance Levels
Resistance Level 1: 46560
Resistance Level 2: 46700
Resistance Level 3: 46845
Support Level 1: 46100
Support Level 2: 45960
Support Level 3: 45840
This communication is for informational purposes only and should not be viewed as any form of recommendation as to a particular course of action or as investment advice. It is not intended as an offer or solicitation for the purchase or sale of any financial instrument or as an official confirmation of any transaction. Opinions, estimates and assumptions expressed herein are made as of the date of this communication and are subject to change without notice. This communication has been prepared based upon information, including market prices, data and other information, believed to be reliable; however, Trade Nation does not warrant its completeness or accuracy. All market prices and market data contained in or attached to this communication are indicative and subject to change without notice.
US30 Update On the low time frame, US30 is consolidating aroundUS30 Update
On the low time frame, US30 is consolidating around 46,351 – 46,398 after testing the breakout zone.
Key levels:
46,398 – 46,351 → short-term decision zone. A breakout above this area could confirm bullish continuation toward 47,170.
46,177 – 45,796 → support zone for the main uptrend. As long as price holds above this, the bullish cycle remains intact.
Upside scenario: If price reclaims and holds above 46,398, momentum strengthens for another push higher, with 47,170 as the next major resistance.
Downside risk: If price fails to hold above 46,177, deeper correction could follow, with 45,796 as first support.
Cycle level: 41,097 is the cycle start and a critical must-hold area for the long-term bullish structure.
📌 Summary
Above 46,398 → bullish continuation toward 47,170.
Hold above 46,177 – 45,796 → main uptrend safe.
Break below 45,796 → correction risk, broader weakness possible.
41,097 → cycle start and major long-term support.

Us30 Trade Set Up Sep 23 2025Price swept PDH in London session and formed a SSL at Asia lows so if price sweeps it and closes above i will look for 1m IFVG and CISD to take higher but if price closes under i will look for sells to test 1h FVG

DowJones Key support at 46100Key Support and Resistance Levels
Resistance Level 1: 46560
Resistance Level 2: 46700
Resistance Level 3: 46845
Support Level 1: 46100
Support Level 2: 45960
Support Level 3: 45840
This communication is for informational purposes only and should not be viewed as any form of recommendation as to a particular course of action or as investment advice. It is not intended as an offer or solicitation for the purchase or sale of any financial instrument or as an official confirmation of any transaction. Opinions, estimates and assumptions expressed herein are made as of the date of this communication and are subject to change without notice. This communication has been prepared based upon information, including market prices, data and other information, believed to be reliable; however, Trade Nation does not warrant its completeness or accuracy. All market prices and market data contained in or attached to this communication are indicative and subject to change without notice.
DOW JONES (US30): Confirmed BoS & More Growth
I see another confirmed break of structure and a violation
of an important intraday horizontal resistance on a 4h time frame on US30 Index.
Odds will be high, that the market will continue rising.
Next resistance - 46550
❤️Please, support my work with like, thank you!❤️
I am part of Trade Nation's Influencer program and receive a monthly fee for using their TradingView charts in my analysis.
