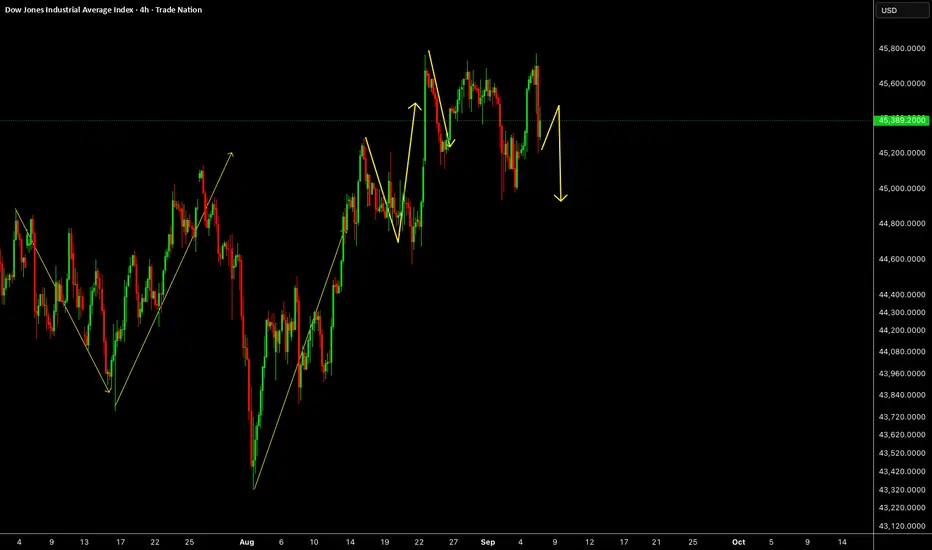
US30US30 needs some correction and then continue the same direction.
Disclosure: We are part of Trade Nation's Influencer program and receive a monthly fee for using their TradingView charts in our analysis.
Us30analysis

Us30 Trade Set Up Sep 12 2025www.tradingview.com
Price has made a ATH so i will need more context but for now we got a big bullish 4h FVG and a bearish 4h FVG. If price respects and fails to close above the bearish FVG i will look for sells to the 50% of the Bullish FVG but if price continues to make HH/HL and can trade through the 50% of the bearish FVG i will look for buys

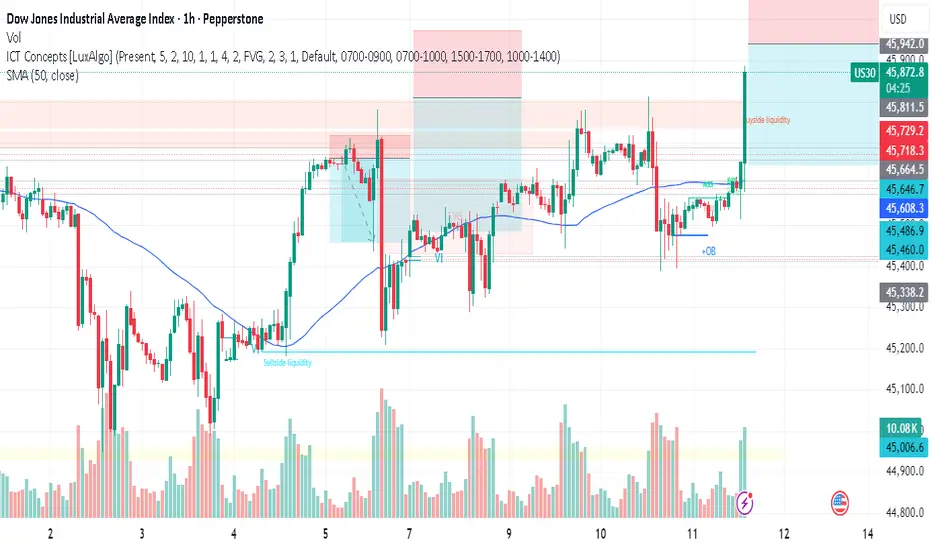
DOW30/US30 ANOTHER OPPORTUNITY TO SHORTTeam, I been waiting for this price 45880 AND 45915
STOP LOSS AT 46050
TARGET 1 AT 45735-65 - take partial 70% bring stop loss to BE
TARGET 2 AT 45575-45615
LETS GO
Us30 Trade Set Up Sep 11 2025www.tradingview.com
Price has pushed up above a key zone but left a SSL so i will expect price to sweep it before making internal structure on the 1m-2m creating a IFVG before going higher to PDH

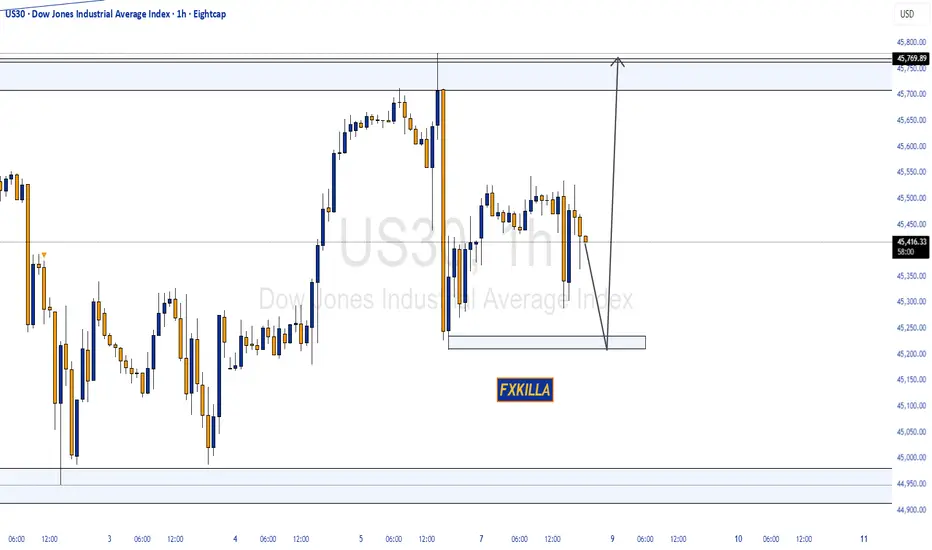
DOW JONES HIGH PROBABILITY SETUPS SOON!!!🚨 US30 HIGH PROBABILITY SETUPS 🚨
* Here We Can See Clearly The Next Potential Moves For US30 Coming Hours/Days.
* Keep Your Eyes Close On Your Trading Positions.
* Happy PIP Hunting Traders.
FXKILLA.

US30 Resistance Ahead!
HI,Traders !
#US30 keeps growing
In an uptrend but the
Index will soon hit the
Horizontal resistance
Of 45700.0 from where
We will be expecting a
Local bearish correction !
Comment and subscribe to help us grow !

Us30 Trade Set Up Sep 10 2025FX:US30
www.tradingview.com
price has testes PDH and has made a BSL and SSL with a 15m FVG so i want to see either price test BSL, close under, form 1m-2m IFVG to target SSL or come to test 15m FVG, respect it, form 1m-2m IFVG and go higher

Us30 Trade Set Up Sep 9 2025FX:US30
www.tradingview.com
Price is playing within a 1h HH/HL range so overall still bullish. We also got a 1h FVG thats holding so if price sweeps SSL and respects the 1h FVG again i will look for a 1m-2m IFVG for buys back up towards BSL, but if price inverts the 1h FVG i will look for sells down to PDL

US30 Strategy: Sideways Range, Liquidity Run, and Entry Zones📊 Dow Jones (US30) Update 📊
The Dow Jones (US30) is currently bullish 🟢📈 and pushing higher on the 4H timeframe ⏰. We can see a value area forming 🏦, with price ranging sideways 🔄 and building liquidity above and below the range 💧.
My plan is to watch for a potential liquidity run above the range 🚀, followed by a deep pullback 🔽 that could present a high-probability entry opportunity 🎯.
⚠️ This outlook is for educational purposes only and not financial advice. 📚

DOW JONES HIGH PROBABILITY SETUP SOON!!!🚨 US30 HIGH PROBABILITY SELL/BUY SETUP 🚨
* Here We Can See Clearly The Next Potential Moves For US30 Coming Hours/Days.
* Keep Your Eyes Close On Your Trading Positions.
* Happy PIP Hunting Traders.
FXKILLA.
Us30 Trade Set Up Sep 8 2025FX:US30
www.tradingview.com
Price is currently at a 1h FVG and in between BSL/SSL so i want to see either liquidity level swept followed by a 1m/2m IFVG or RB formed and tested to continue higher.
I am overall bullish due to price making HH/HL but it is monday which usually has low volume so not expecting huge moves today

US30US30 has some more downside to complete this bigger correction before any upside.
Disclosure: We are part of Trade Nation's Influencer program and receive a monthly fee for using their TradingView charts in our analysis.
Us30 Trade Set Up Sep 5 2025FX:US30
www.tradingview.com
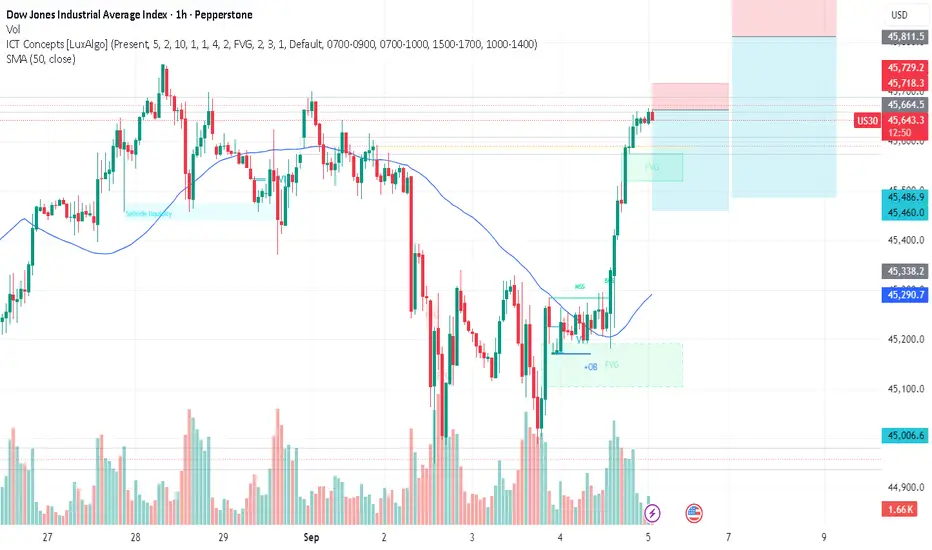
price is making HH/HL and is testing ATH soon so i will be waiting for a pullback into 15m FVG then a continuation higher

Dow Jones Overextended: Watching for an Institutional Unwind 📊 Dow Jones (US30) remains bullish 🟢, but in my view, it’s looking overextended 📈. Price has traded into a key level 🎯 where we could see a potential pullback, especially as we approach the end of the week 📅, when institutions and big money 💼 may begin unwinding positions.
👀 The play here is to watch for the high of the week/day ⏫ and look for a counter-trend reversal 🔄 that could drive price lower into the weekly close 📉.
⚠️ Keep in mind: Monday’s opening often creates a stop run 🛑 possibly offering a deeper pullback, giving us a double dose of liquidity grabs 💧. This sets the stage for a fairly deep retracement, which could present an opportunity to counter trend short if conditions align 🧩.
📌 My focus is on a break below the current range 🔓 as a trigger for potential entry.
⚠️ This is for educational purposes only and not financial advice 📚

US30 Bullish Setup: From Pullback to Measured Moves📊 The US30 (Dow Jones) is trending bullish on the 4-hour chart ⏰. We’ve just seen a pullback into equilibrium ⚖️, and I’ve taken a long position 📈. In the video 🎥, I break down how I set my targets 🎯 using the Fibonacci retracement 🔢 — first identifying the equilibrium pullback, then projecting measured moves above for profit targets 🚀. (Not financial advice ⚠️)

DOW/US30 - BEST STRATEGY OF THE YEAR - LETS GOTeam, carefully plan for tonight on NON FARM PAYROLL
HERE IS THE DATA
Weekly jobless claims increase 8,000 to 237,000
Continuing claims fall 4,000 to 1.940 million
Private payrolls increase 54,000 in August
Trade deficit widens 32.5% to $78.3 billion in July
Last month, the same day, market drop for two days over 1000 points.
PLEASE CAREFULLY structure this - DO SMALL VOLUME FOR THIS ONLY
Short now at 45645-45655 - I think the market look EXHAUSTED
STOP LOSS tight at 45680 or give more room at 45720
Target 1 at 45525-45500 - take 60%-70% partial and bring stop loss to BE
Target 2 at 45425-45380
OR WAIT FOR THIS ZONE TO KILL THE MARKET - 45800-45900 - stop loss at 46050
Target 1 - 45650 -45620
Target 2 - 45550-45520
LETS GO
Us30 Trade Set Up Sep 4 2025FX:US30
www.tradingview.com
Price has made a HH but hasnt broken out of it so i want to see price test SSL and either close above with a 1m-2m IFVG to go higher or close under to go down towards PDL

US30 Bearish Breakout!
HI,Traders !
#US30 made a bearish
Breakout of the rising support
Line and we are bearish biased
So we will be expecting a
Further bearish move down !
Comment and subscribe to help us grow !

Us30 Trade Set Up Sep 3 2025FX:US30
www.tradingview.com
price has made LH but a HL and has respected a 1h FVG multiple times so i am expecting price to continue lower towards PDL

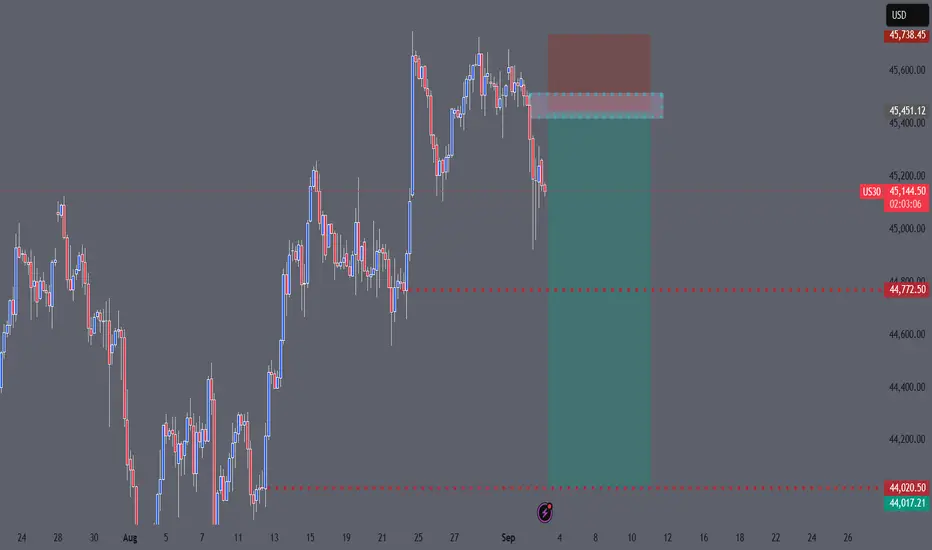
US30 WILL BLEEDWe are entering a short (sell) trade on US30 because the market failed to create new highs and reversed from a strong resistance/supply zone with good breakout, Structure and momentum now favor the downside. Targets are set at 44,770 and 44,020, with a stop above 45,740 to manage risk.
Us30 Trade Set Up Sep 2 2025FX:US30
www.tradingview.com
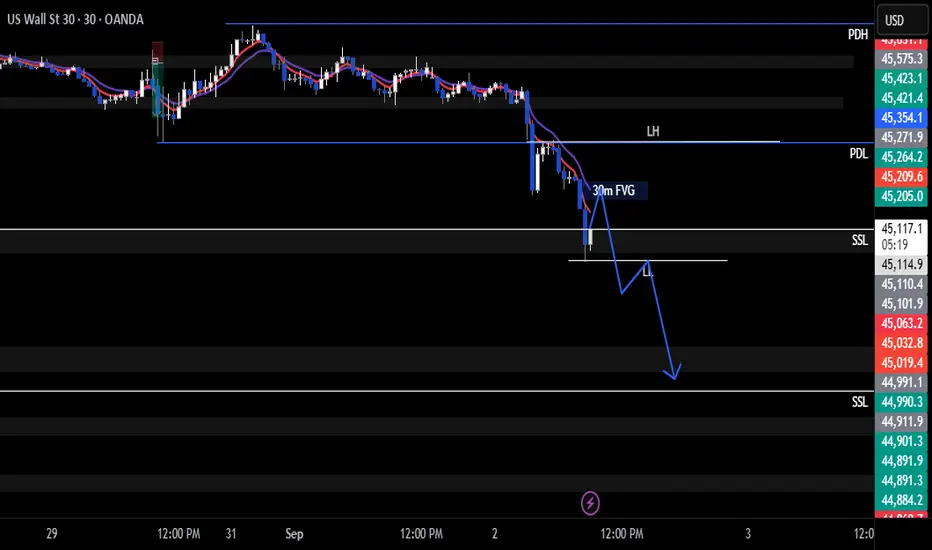
Price has dumped due to tariff talks and has swept PDL and a daily SSL so i am expecting price to pull back to test 30m FVG before continuing down
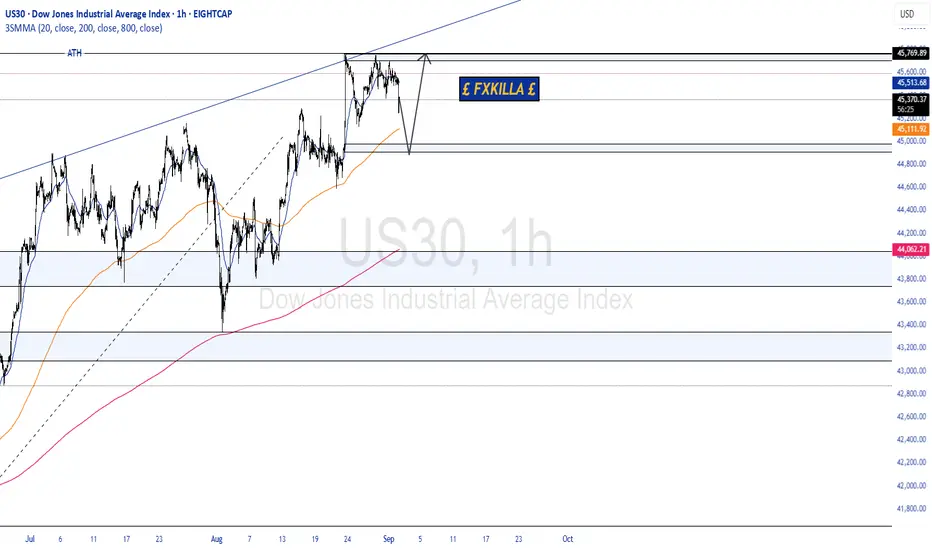
DOW JONES HIGH PROBABILITY SETUPS SOON!!🚨 US30 HIGH PROBABILITY SELL/BUY SETUPS 🚨
*Here We Can See Clearly The Next Potential Moves For US30 Coming Hours/Days.
* Keep Your Eyes Close On Your Trading Positions.
* Happy PIP Hunting Traders.
£ FXKILLA £
Us30 Trade Set Up Sep 1 2025FX:US30
www.tradingview.com
Price is in a bigger time frame consolidation but on the 1h it has made LH/LL and swept PDH already so overall i will be looking for sells either under this key level or a test of 1h FVG before targeting PDL as sellside liquidity
