US30 Trade Set Up Aug 25 2025FX:US30
www.tradingview.com
Us30 Trade Set Up: price has created a huge gap between HH/HL so i want to see more price action play out but we got sell side liquidity on the 15m that can be tested. If price sweeps and closes above i will look for buys but if price closes below we could see the start of a bigger pull back down before continuing higher
Us30analysis

US30 Long Opportunity US30 has been on a bullish tear recent and after the speech by Powell, the market has turned on the bullish momentum to the max. the market is currently on an impulse to the the upside and has created new highs.
Price has broken the $45000 pivot level and continues to trade above the 21, 50 and 200 SMA and in the bullish region of the RSI, currently sitting in the overextended levels at 80.
it is clear the market is in need of a deep retracement to collect liquidity and i will be target the $45000-$5250 zone for a potential zone opportunity. Waiting to see how price reacts to the level and will ride the wave pass the $445652 mark.

US30 LongUS30: New ATH Prints – Waiting for Weekly Candle Retracement
The US30 has surged to fresh all-time highs (ATH), closing last week with a strong bullish weekly momentum candle. This kind of aggressive move often sees follow-through, but smart money typically waits for a retracement to optimize entries.
Plan & Levels:
The area around $45,300 stands out as a potential buying zone, aligning with expected dollar weakness and a key Fibonacci retracement level of the prior weekly push.
Traders will watch for price to pull back toward this zone and confirm entries using lower timeframe candlestick patterns and confluence with Fibonacci support.
Technical Context:
Momentum remains firmly bullish, with higher highs and strong breadth across industrial and tech components supporting the rally.
A controlled retracement would provide fresh liquidity for continuation and could set the stage for another leg higher toward new records.
Trading Plan:
Wait for a retracement toward $45,300 to build a long position.
Validate entries using Fibonacci levels and bullish reversal candles on 4H or lower charts.
Maintain disciplined risk management, as overextended markets can show sharp pullbacks before continuation.

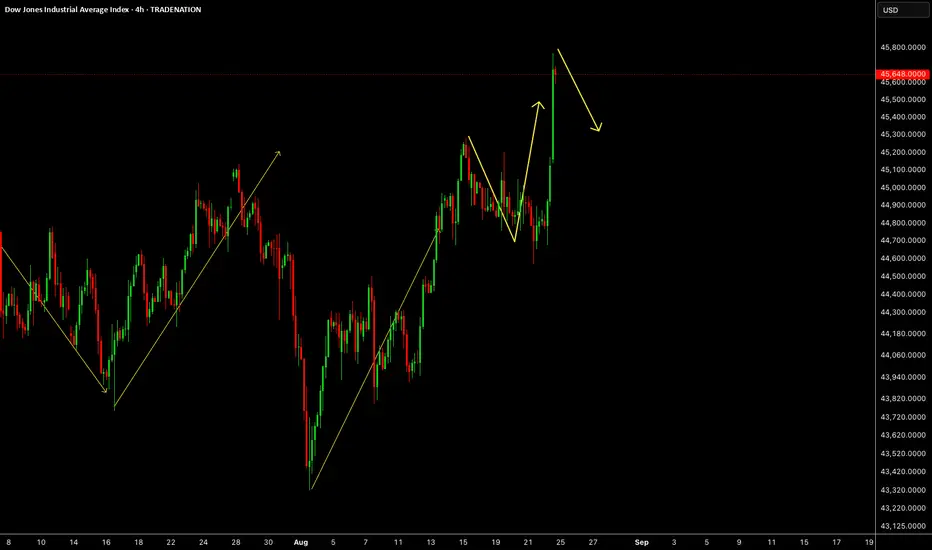
US30US30 is almost ready for a drop as correction, look for sells for now short term.
Disclosure: We are part of Trade Nation's Influencer program and receive a monthly fee for using their TradingView charts in our analysis.
US3o Trade Set Up Aug 22 2025www.tradingview.com
FX:US30
Us30 Trade Set Up: price is making HH/HL on the 1h and is close to testing PDH, so i will wait to see if price closes above HH and PDH to continue higher towards BSL or if price sweeps PDH as liquidity, closes under and forms internal IFVG+CISD to go lower towards HL/PDL

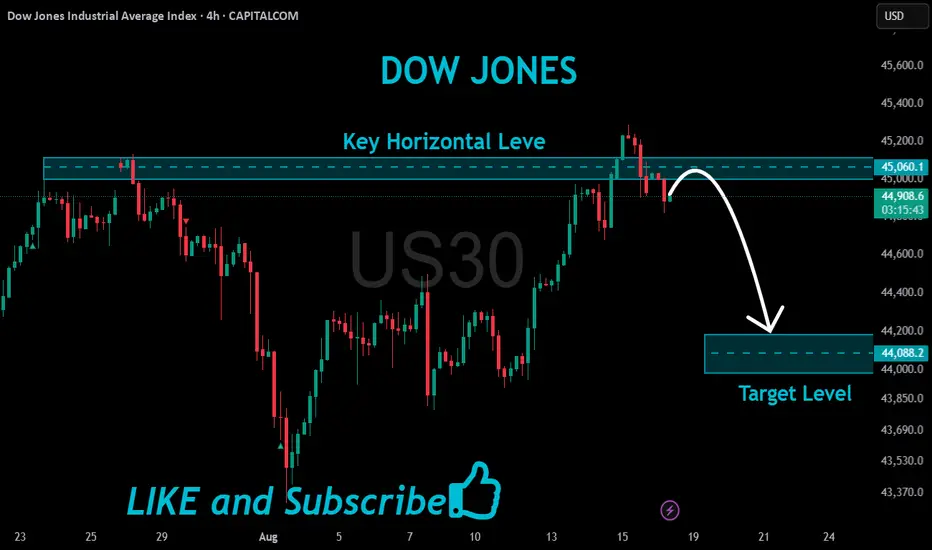
US30 Bearish Breakout!
HI,Traders !
#US30 made a bearish
Breakout of the key horizontal
Level of 45060.1 which is now
A resistance and the breakout
Is confirmed so we are bearish
Biased and we will be expecting
A further bearish move down !
Comment and subscribe to help us grow !
US30 Outlook: Waiting for Range Break Confirmation Dow JonesI’m looking at the US30 📊 right now, and price is currently range-bound 🔄, reflecting ongoing pressure in the market. While I’m watching closely for an opportunity, it’s important to recognize when to step aside and wait for the market to set up 🕰️. If we see a break below the current range low followed by a retest ⬇️, that could present a selling opportunity. Conversely, if price breaks higher and retests the previous high ⬆️, that could offer a buy setup. For now, I’m remaining on the sidelines 🪑 until one of these scenarios unfolds with the momentum I’m looking for 🚀. (Not financial advice.)

US30US30 still have some upside, wait for correction and look for buy setups.
Disclosure: We are part of Trade Nation's Influencer program and receive a monthly fee for using their TradingView charts in our analysis.

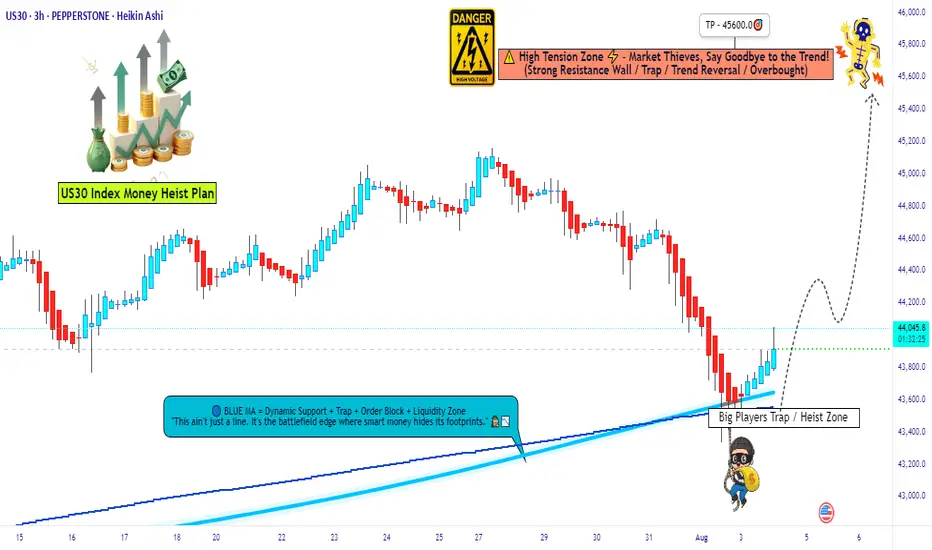
Heist Alert: Dow 30 Bullish Surge Incoming – Lock In Targets🦹♂️💎 “US30 Gold Vault Heist” – Thief’s Bullish Break-In Plan! 🚨📈
(Brought to you by Thief Trader – Layered Entry. Zero Mercy. Big Bags.)
🌍 Welcome to the Heist Floor, Global Market Bandits!
🎯 US30 is the next vault on the hitlist – and we’re going in loud but calculated.
💣 The Setup: Bullish Raid in Progress!
The Thief has eyes on Wall Street's armored vault — US30 Index — gearing up for a multi-layered bullish assault.
💼 Using limit orders like C4 on the door hinges, we’re stacking precise entries for maximum loot extraction. This isn’t gambling — this is organized market crime.
🔓 Entry Protocol – Any Price Level Is Breachable
🪜 Layered Limit Orders: Entry at any market level, multiple orders spread like a thief’s toolkit.
No sniper candle required — we work the shadows and stack with precision.
(Use the 15m-1H TF to tighten your strike zone.)
🛑 Stop Loss – The Getaway Hatch
📍 SL parked at 43300.0 – if the mission fails, we vanish clean.
No chasing losses — the next heist awaits.
📈 Take Profit – The Loot Vault
🎯 Target: 45600
That’s the gold room, the top floor, the getaway car location.
Use trailing SLs to secure the bag mid-run if resistance agents start showing up.
🧠 Behind the Heist – What’s Fueling This Move?
Global risk-on tone? ✅
Dow futures resilience? ✅
Thief’s sentiment meter flashing GREEN? ✅
Index rebalancing & sector flow favoring bulls? ✅
We don’t just trade the chart. We rob the macro narrative.
🚫 News Caution – No Sudden Sirens
Avoid entering during red folder data drops or FOMC speeches.
Stay ghosted. Let the volatility settle, then strike. 🕵️♂️
💥 Smash the BOOST Button 💖 If You’re With the Crew!
Let’s run this like a proper cartel of information — share it, save it, tag your trader circle.
Every like supports the next robbery plan.
No signals. No fluff. Just pure market exploitation.
📌 Disclaimer: Educational analysis only. No financial advice. Manage your risk like a true thief — never expose the whole bag.
💼📊 Thief Trader Out — More heist maps coming soon.
🔐 Rob Smart. Stack Heavy. Run Fast. 🦹♂️💸📈
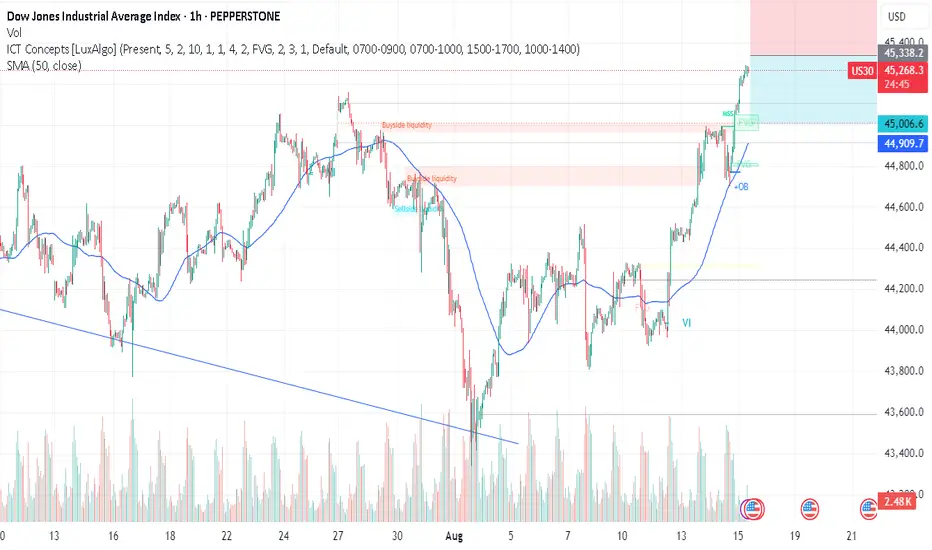
US30 Long Position US30 has broken passed the major resistance level at $45000 finally and is currently priced at $45200. The Bullish trend from the past week has created strong bullish confluences with price trading above the 21 and 50 day Moving Averages and in the bullish region of the RSI, expecting further upside potential.
With the break of the $45000 barrier, we can expect price to retrace and test this point sometime in the future and with that see a bounce from this level with the resistance turning support.
Will also be looking at other keys levels such as $44980 and $44730 should price have a deep retracement before the bullish trend resumes.

DOW - TRUMP MEETING WITH PUTIN - Team,
Today we got LONG GOLD, SHORT UK100, SHORT AUS200, all target meet at our chat room
Here is the set up trade for US30
Entry: 45,272–45,300
Stop: 45,340–45,360
TP1: 45,080
TP2: 44,880
LETS GO
US30 Risky Long!
HI,Traders !
#US30 is trading in an uptrend
So despite a local correction
We are bullish biased and
As we are already seeing
A bullish rebound from the
Local horizontal support
Of 43885.9 a further
Bullish move up is
To be expected !
Comment and subscribe to help us grow !

Dow Jones - Expecting Bullish Continuation In The Short TermH1 - Strong bullish momentum.
No opposite signs.
Until the two Fibonacci support zones hold I expect the price to move higher further.
If you enjoy this idea, don’t forget to LIKE 👍, FOLLOW ✅, SHARE 🙌, and COMMENT ✍! Drop your thoughts and charts below to keep the discussion going. Your support helps keep this content free and reach more people! 🚀
--------------------------------------------------------------------------------------------------------------------

Dow Jones (DJI) – 15M Chart Analysis | Aug 12, 2025
1. Current Price Action:
Trading at 44,026, price is consolidating within a tight range after rejection from the yellow resistance zone (~44,080).
2. Resistance Levels:
Key hurdles at 44,175, 44,325, and the major top at 44,501. Bulls must clear 44,175 for a momentum shift.
3. Support Levels:
Nearest support at 43,920, followed by 43,807. A break below these could trigger further downside pressure.
4. Trend Outlook:
Short-term sentiment is bearish-neutral with lower highs forming; buyers need a decisive breakout to change structure.
5. Trading Bias:
Bullish: Break above 44,175 → targets 44,325/44,501.
Bearish: Drop below 43,920 → opens path toward 43,807 and potentially lower.

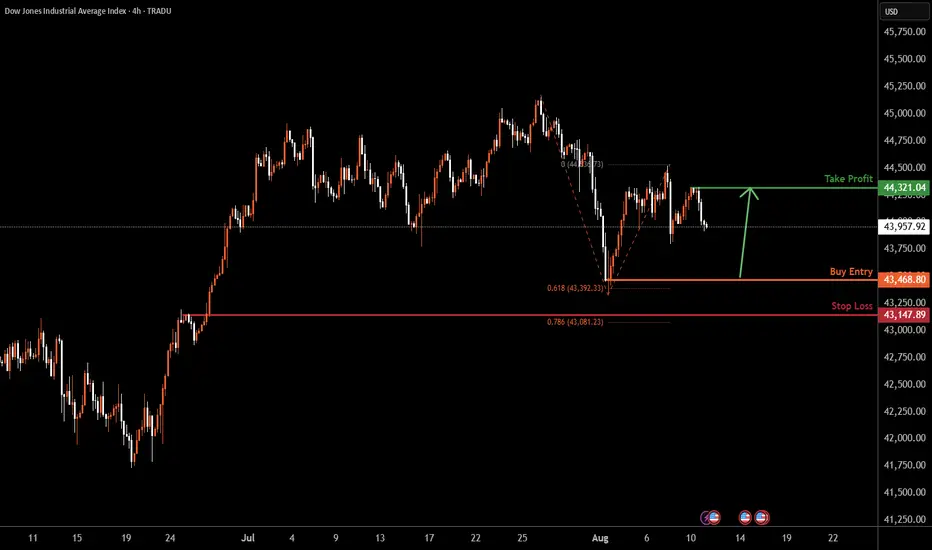
US30 H4 | Falling towards pullback supportBased on the H4 chart analysis, we could see the price fall to the buy entr at 43,468.80, which is a swing low support that is slightly above the 61.8% Fibonacci projection.
Stop loss is at 43,147.89, whihc is a pullback support that is slighlty above the 78.6% Fibonacci retracement.
Take profit is at 44,321.04, which is a swing high ressitance.
High Risk Investment Warning
Trading Forex/CFDs on margin carries a high level of risk and may not be suitable for all investors. Leverage can work against you.
Stratos Markets Limited (tradu.com ):
CFDs are complex instruments and come with a high risk of losing money rapidly due to leverage. 65% of retail investor accounts lose money when trading CFDs with this provider. You should consider whether you understand how CFDs work and whether you can afford to take the high risk of losing your money.
Stratos Europe Ltd (tradu.com ):
CFDs are complex instruments and come with a high risk of losing money rapidly due to leverage. 66% of retail investor accounts lose money when trading CFDs with this provider. You should consider whether you understand how CFDs work and whether you can afford to take the high risk of losing your money.
Stratos Global LLC (tradu.com ):
Losses can exceed deposits.
Please be advised that the information presented on TradingView is provided to Tradu (‘Company’, ‘we’) by a third-party provider (‘TFA Global Pte Ltd’). Please be reminded that you are solely responsible for the trading decisions on your account. There is a very high degree of risk involved in trading. Any information and/or content is intended entirely for research, educational and informational purposes only and does not constitute investment or consultation advice or investment strategy. The information is not tailored to the investment needs of any specific person and therefore does not involve a consideration of any of the investment objectives, financial situation or needs of any viewer that may receive it. Kindly also note that past performance is not a reliable indicator of future results. Actual results may differ materially from those anticipated in forward-looking or past performance statements. We assume no liability as to the accuracy or completeness of any of the information and/or content provided herein and the Company cannot be held responsible for any omission, mistake nor for any loss or damage including without limitation to any loss of profit which may arise from reliance on any information supplied by TFA Global Pte Ltd.
The speaker(s) is neither an employee, agent nor representative of Tradu and is therefore acting independently. The opinions given are their own, constitute general market commentary, and do not constitute the opinion or advice of Tradu or any form of personal or investment advice. Tradu neither endorses nor guarantees offerings of third-party speakers, nor is Tradu responsible for the content, veracity or opinions of third-party speakers, presenters or participants.
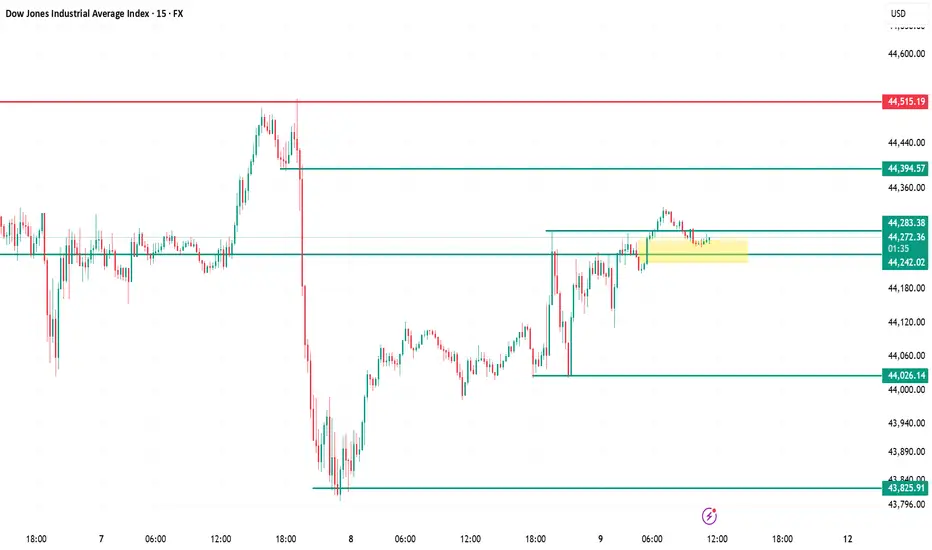
Dow Jones 15m Chart Analysis Current Position – Price is consolidating in the 44,242–44,283 demand zone after a bullish push, showing buyers defending support.
Upside Levels – Break and close above 44,394 can trigger momentum toward 44,515 (major liquidity zone).
Downside Risk – Failure to hold 44,242 likely sends price to 44,026 first, then 43,826 (previous swing low demand).
Market Structure – Short-term bullish above 44,242; turns bearish below it. Volume breakout confirmation is key for conviction.
Trading Approach – Range trade between 44,242–44,394 until a confirmed breakout; trade with tight stops to avoid whipsaws
US30US30 needs some more correction downside short term before going up to take ATH.
Disclosure: We are part of Trade Nation's Influencer program and receive a monthly fee for using their TradingView charts in our analysis.

Dow Jones: Explosive US30 Trade Setup – Entry,Trap & Exit Mapped💎 Dow Jones Robbery Blueprint: The US30 Vault Crack Plan 💎
(Maximized for reach — within TradingView title limit)
🌟Hi! Hola! Ola! Bonjour! Hallo! Marhaba!🌟
Dear Market Robbers & Money Movers 🕵️♂️💰🚨
This ain't your average analysis — it’s a Thief Trader-style 🔥tactical mission🔥 aimed at the mighty "US30/DJI" (Dow Jones Industrial Average). We're talkin' about a precision heist with a full blueprint: entry zones, trap setups, and escape exits. Read carefully — this ain’t for the faint-hearted traders! 🧠🦾
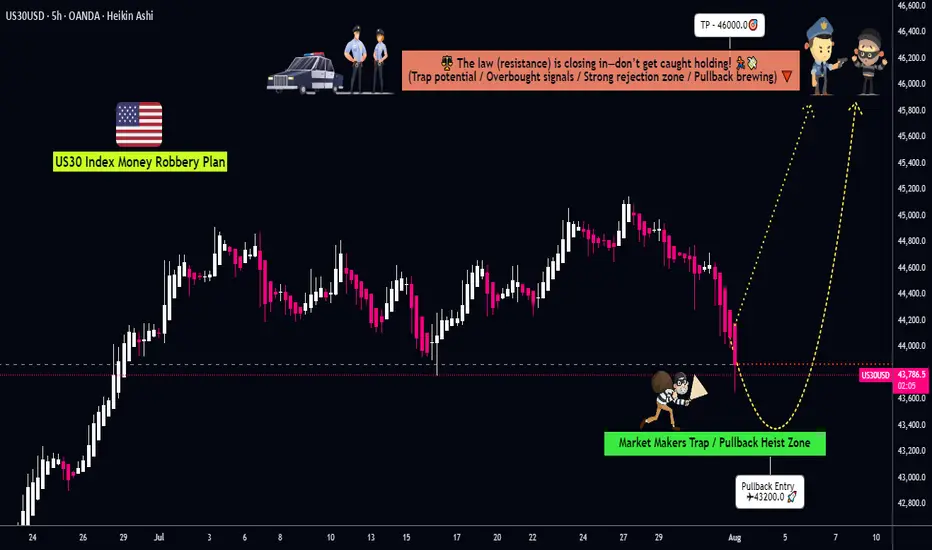
🧠 Entry Zones (The Break-In) 📈
🛠 ENTRY 1: Candle wick near 44200.0 – that’s the resistance gate. Wait for confirmation.
🎯 ENTRY 2: Sneak in at the Market Makers’ Trap around 43200.00 – a dirty zone where retailers get baited. Perfect time to strike long!
🧱 DCA/Layering strategy recommended. Stack those buy orders like a thief layering explosives on a safe. 💣💸
🛑 Risk Levels (Escape Routes/Stop Loss)
🔊 "Listen up, vault raiders! Never drop your SL until breakout is confirmed. If you jump early, you might land in a bear trap! 🪤"
🔐 Stop Zones (Based on Strategy):
🔐 Max Risk SL (5H TF): If you're deep, your last stand is at 43000.0
☝️ SL depends on your position sizing, number of entries, and risk appetite. Trade like a thief, not a gambler.
🎯 Heist Target (Profit Exit)
🏁 Escape Point: 46000.0 — or exit before heat rises! Don’t be greedy. Rob and vanish. 💨💰
🔥 Market Mood: Why the Heist Is On
"US30/DJI" is bullish AF — thanks to:
📊 Macro-Economic Wind at Our Back
📈 Institutional momentum
📰 Strong sentiment and intermarket flows
Check your chart radar: Fundamentals + technicals aligning = green light for robbery! 🟢
⚠️ Tactical Reminder: News Can Jam the Plan
📵 Avoid new entries during major economic releases
🛡 Use trailing SLs to protect running trades
Stay alert, stay alive. 💡
❤️ Support the Robbery Crew
Hit that 💥BOOST💥 — your love fuels our next mission.
Join us and ride daily heist plans with Thief Trading Style 🏴☠️🚀💰
Dow Jones Industrial Average (DJIA) – 1H Chart Analysis | Aug 8,Current Structure:
Price is trading between 44,119 resistance and 43,816 support, consolidating after a sharp drop and partial recovery.
Resistance Zone:
The 44,119 level is acting as immediate intraday resistance; a clean breakout could push toward 44,514.
Support Zone:
43,816 remains a strong floor; below this, 43,524 is the key level where last strong bullish reversal started.
Momentum Outlook:
Recovery candles are showing smaller bodies with upper wicks, suggesting buyers are cautious and momentum is fading.
Trading Bias:
Bullish: Break above 44,119 → target 44,514.
Bearish: Break below 43,816 → retest of 43,524 likely.

US30; Heikin Ashi Trade Idea📈 Hey Traders!
Here’s a fresh outlook from my trading desk. If you’ve been following me for a while, you already know my approach:
🧩 I trade Supply & Demand zones using Heikin Ashi chart on the 4H timeframe.
🧠 I keep it mechanical and clean — no messy charts, no guessing games.
❌ No trendlines, no fixed sessions, no patterns, no indicator overload.
❌ No overanalyzing market structure or imbalances.
❌ No scalping, and no need to be glued to the screen.
✅ I trade exclusively with limit orders, so it’s more of a set-and-forget style.
✅ This means more freedom, less screen time, and a focus on quality setups.
✅ Just a simplified, structured plan and a calm mindset.
💬 Let’s Talk:
💡Do you trade supply & demand too ?
💡What’s your go-to timeframe ?
💡Ever tried Heikin Ashi ?
📩 Got questions about my strategy or setup? Drop them below — ask me anything, I’m here to share.
Let’s grow together and keep it simple. 👊

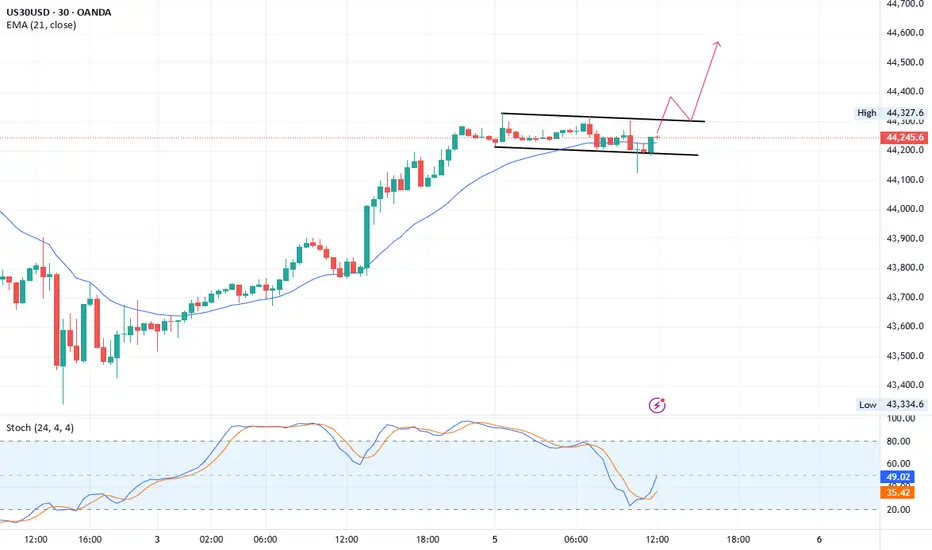
US30 Bullish flag patternUS30
M30 chart bullish flag pattern
Buy: current rate 44238
Stop Loss: 44125
1st TP: 44388
2nd TP: 44570
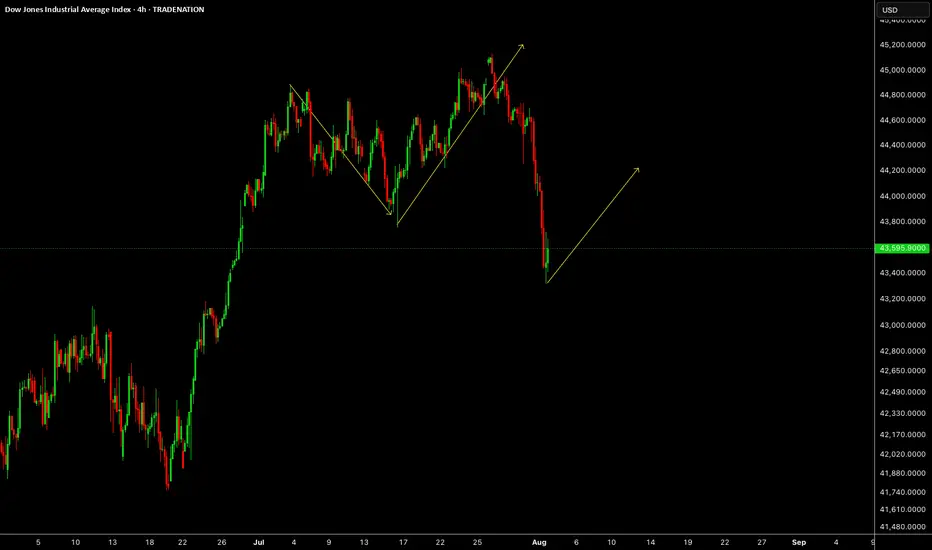
US30US30 was expected to drop last week which is what market has done. This week we need upside correction or impulse.
Disclosure: We are part of Trade Nation's Influencer program and receive a monthly fee for using their TradingView charts in our analysis.
US30 Swing Short!
HI,Traders !
#US30 keeps falling down
And the index broke the
Key wide horizontal level
Around 43924.6 which is now
A resistance and the breakout
Is confirmed so we are very
Bearish biased and we will
Be expecting a bearish
Continuation on Monday !
Comment and subscribe to help us grow !
