US30 potential long setupsMulti-Timeframe Market Analysis — Bullish Continuation Potential
3-Month Timeframe
• October 2023: Price broke all-time highs.
• Bullish order block established at $37,250; price rallied to $45,000.
• Strong retracement followed to the $39,000 region—bullish orders filled.
• Current trend: Structure remains bullish with institutional support evident.
Monthly Timeframe
• Post-ATH liquidity collected at $41,750; retested in January with insufficient momentum.
• Price returned to $45,000 before retracing to $38,000.
• Strong bullish response from $38,000 leading into April and May.
• Price now trades above $41,750. A monthly close above this level signals further upside.
• Watch for a three-pin pattern—if confirmed, high probability of a break above previous monthly highs.
• Next target: $45,000 liquidity zone.
Weekly Timeframe
• Double bottom formation aligned with higher timeframes.
• Bullish accumulation at $41,250 drove price to $42,000, followed by a close above that level.
• Immediate resistance at $44,000, where previous bearish orders were concentrated.
• Last week ended with a bearish candle; this week opened with strong bullish momentum from $41,250.
• This timeframe supports a bullish bias, contingent on follow-through above key levels.
Daily Timeframe
• Bullish structure in alignment with monthly and weekly.
• Strong order flow noted at $41,250, enabling a break and close above $42,000.
• Next daily target: $42,800; key resistance: $42,881.
• Anticipate a possible retracement to $42,000 for further accumulation before continuation higher.
4H Timeframe
• Intraday price action highlights Friday’s retracement to $41,250 during NY session—bullish orders filled.
• Monday opened bullish; momentum slowed at $42,000 with brief retracement.
• Tuesday's NY session: 3-pin bullish pattern at $42,000, followed by a bullish close.
• Current price movement appears to be a retracement for more long orders.
• No actionable setup at the moment; monitoring for a clean 4H close above $42,350.
1H Timeframe
• Price encountered resistance at $42,350, a known liquidity region.
• Break and close above $42,300–$42,350 range confirms short-term bullish pressure.
• Awaiting next 4H candle to assess validity of long setup.
• Maintaining a neutral stance short-term; prepared to act on bullish confirmation.
________________________________________
Conclusion:
Very mindful of FOMC meeting minutes today and I am waiting to see what price action will occur after. Market structure across all major timeframes remains bullish. Pending a monthly close above $41,750 and a potential three-pin formation, the technical outlook favors continued upside. Patience remains key—await confirmation for optimal long entries.
Us30analysis

Dow Jones Short Term Sell Trading PlanM15 - Strong bearish momentum
Lower lows on the moving averages of the MACD indicator.
Until the two Fibonacci resistance zones hold I expect the price to continue lower further.
If you enjoy this idea, don’t forget to LIKE 👍, FOLLOW ✅, SHARE 🙌, and COMMENT ✍! Drop your thoughts and charts below to keep the discussion going. Your support helps keep this content free and reach more people! 🚀
--------------------------------------------------------------------------------------------------------------------
Disclosure: I am part of Trade Nation's Influencer program and receive a monthly fee for using their TradingView charts in my analysis.

US30 Locked & Loaded – Get In, Get Profit, Get Out!**💰 Market Heist Alert: US30 Setup 🔥**
Yo Money Raiders & Chart Bandits! 🏴☠️📈
US30 is ripe for the taking, and we’re rollin’ in with the *Thief Trading Style*—a slick mix of sniper-level technicals and street-smart fundamentals. Whether it’s bull or bear, we strike fast, grab profit, and vanish! 💨💸
---
**🧠 The Blueprint – US30 Hit Plan**
**📍 Entry Zones:**
🔹 **Bullish Strike 1**: Look for a pullback and **buy at 42400** – clean signal to enter the action!
🔹 **Bullish Strike 2**: Set your sights on **40900 - 40800**, inside the Institutional Buy Zone. Wait for an MA pullback, then hit it hard. Fortune favors the bold! ⚔️
🔹 **Bearish Ambush**: If price breaks down below **41600**, it’s time to ride that bear wave 🐻💨
💡 **Pro Bandit Tip**: Set alerts on key levels so you never miss the moment! 🔔
---
**🛑 Stop Loss Defense:**
Protect the stash! Use the **nearest 4H low** as your SL for day/swing trades.
Tweak based on your risk level, lot size, and open positions. 🛡️
---
**🎯 Profit Targets – Take the Loot:**
💥 **Bullish Goal**: Lock in at **44200** – or escape early if momentum cools 😎
💥 **Bearish Goal**: Target **40600** – but don’t overstay if signs reverse 🚪
🚨 Watch out for overbought/oversold traps – this is where many fall.
---
**⚠️ Risk Alert – News Incoming!**
News events = wild moves. Handle with care:
📰 Avoid new entries during major news drops
📉 Use **trailing SL** to secure profits and manage risk like a pro
Stay smart. Stay ready. This is a heist, not a gamble! 💼💣
---
**🚀 Boost the Thief Trading Movement!**
If this setup hits your style, smash that **boost** and show love to the Thief Crew! 💪
We raid charts daily with precision, profit, and a bit of outlaw swagger. Let’s own the US30 together! 🤝💵
Stay sharp, alerts on, and eyes wide—more setups coming soon.
Catch you in the green, bandits! 🤑🎉📊

DOW/US30 - PERFECT TIME FOR LONG ENTRYTeam, i hope you all making millions on SHORT BOTH SETUP UK100 AND GER30 today
However there is no perfect time to entry LONG DOW/US30 now
please follow the guideline and entry..
target 1st is 150-200 points
2nd target between 300-500 points.
we expect this swing will take tomorrow and next day for the recovery.

"US30 Heist Alert: Thief Style's Bullish Plan to Steal Profits!"🌟 Salut! Ciao! Hola! Konnichiwa! 🌟
Dear Wealth Raiders & Market Bandits, 🤑💰✈️
Here’s our slick *Thief Trading Style* heist plan for the **US30 / Dow Jones Industrial Average Cash** Index, crafted with sharp technicals and fundamentals. 💥 Stick to the chart’s long entry strategy and aim to slip out near the spicy Yellow ATR Zone—a risky, overbought level where bears and traps lurk. 🏆💸 *Grab profits and treat yourself, you’ve earned it!* 💪🎉
**Entry 📈**: The heist kicks off! Watch for a breakout above the MA line (42600.0) to jump in—bullish riches await! 🤑 Set *buy stop orders* above the MA or *buy limit orders* near the most recent 15/30-min swing low/high for pullback entries. 🚨 Set an *alert* to catch the breakout signal!
**Stop Loss 🛑**: Yo, thieves, listen up! 🗣️ For buy stop orders, hold off on placing that stop loss until the breakout confirms. 🔊 Place it at the 8H recent/swing low (40850.0) for day/swing trades. Adjust SL based on your risk, lot size, and number of orders. Play it smart, or it’s your loot on the line! ⚠️🔥
**Target 🎯**: Aim for 44500.0 or bail before the target hits. 🏴☠️
**Scalpers, eyes here 👀**: Stick to long-side scalps. Big bankrolls can dive in; smaller ones, join the swing trade heist. Use *trailing SL* to lock in your haul. 💰
💸 **US30 Market Heist Outlook**: The index is neutral but leaning bullish, fueled by key drivers. ☝ Check the fundamentals, macroeconomics, COT reports, geopolitics, sentiment, intermarket analysis, and future trend targets for the full score. 🌎🔗
⚠️ **Trading Alert: News & Position Management** 📰🚫
News can shake the market hard. To protect your loot:
- Skip new trades during news releases.
- Use trailing stop-loss orders to secure running profits.
💖 Boost our heist plan! 🚀 Hit that *Boost Button* to power up our robbery squad. With *Thief Trading Style*, we’re snatching profits daily. 🏆🤝 Stay sharp for the next heist plan! 🤑🐱👤🤩
---
### Latest Real-Time Data (UTC+1, May 16, 2025) 📊
*Data sourced from reliable platforms like Financial Juice and official market feeds.*
**Indices** 📈
- US30 (Dow Jones): 42580.0 | +0.18% 😊
- S&P 500: 5720.5 | +0.12% 😄
- NASDAQ 100: 20150.2 | +0.25% 😊
- FTSE 100: 8250.3 | -0.05% 😐
---
### Latest COT Data (Updated Friday, May 9, 2025) 📑
*Commitment of Traders (COT) report for US30/Dow Jones futures, sourced from CFTC.*
- **Non-Commercial (Speculators)**:
- Long: 45,200 contracts | +2,500 😄
- Short: 38,900 contracts | -1,200 😊
- Net Position: +6,300 (Bullish bias) 🟢
- **Commercial (Hedgers)**:
- Long: 82,500 contracts | -1,000 😐
- Short: 90,700 contracts | +800 😐
- Net Position: -8,200 (Bearish hedge) 🔴
- **Open Interest**: 165,400 contracts | +1,200 😊
- **Key Insight**: Speculators are increasing bullish bets, while hedgers lean bearish, signaling potential volatility near resistance levels like the Yellow ATR Zone. ⚠️
---
💥 Join the *Thief Trading* crew, boost the plan, and let’s raid the markets together! 🤑🚀

DOW/US30 - PLEASE FOLLOW THE STRATEGY ACCORDINGLYTeam, two are set up on LONG position for DOW/US30.
if you have seen my video, how I trade and how much I made, you would notice the difference.
With strategy 1, you make 10-15% profit on your capital, depending on how much risk you take. Please add your entry slowly. Do not trade plan one aggressively.
also, follow the target range accordingly, make sure trail stop loss to BE once the first target is reached and take 50% partial
With strategy 2, if the market allows, this is where we would kill the market. But we need to be patient. As you can see, in the last 2-3 days, I did not trade the DOW/US30 because I prefer to enter at a certain level and price action.
Please follow the plan accordingly; once it hits target 1, take 30% and bring stop loss to BE
I hope you understand my strategy. Let's make millions together.

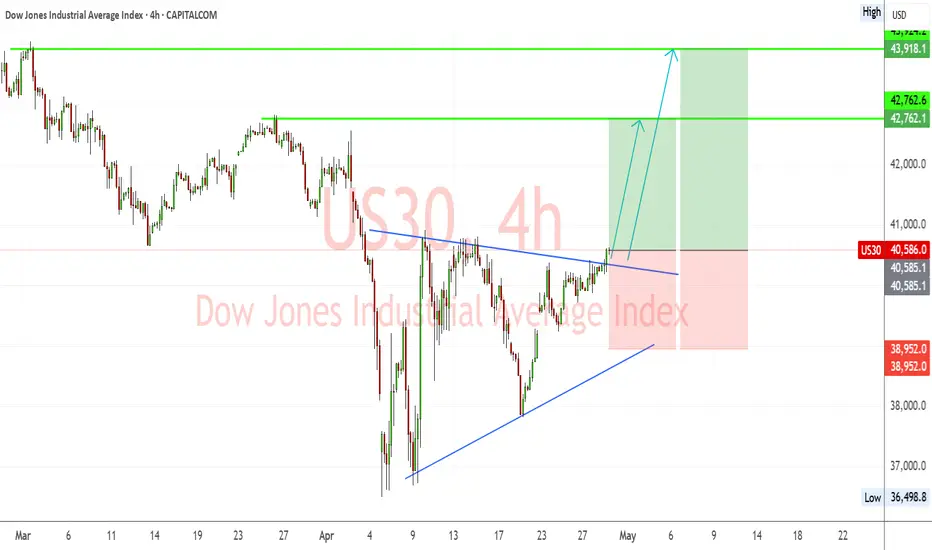
US30 Breakout from Symmetrical Triangle – Bullish Targets EyedUS30 (Dow Jones) has successfully broken out of a symmetrical triangle consolidation pattern, signaling a shift toward bullish momentum. The breakout is occurring after a strong recovery from April lows, with higher lows supporting upward price pressure.
🔹 Chart Structure:
Symmetrical triangle with a clean breakout above descending resistance.
Series of higher lows indicating accumulation.
Bullish breakout confirmed with price pushing above the 40,580 zone.
🔑 Key Levels:
Current Price: 40,586
Breakout Confirmation Level: 40,580
Immediate Resistance/TP1: 42,762
Major Resistance/TP2: 43,924
Support Zone: 38,950
Invalidation/Stop Level: Below 38,950
✅ Bullish Confluence Factors:
Breakout of symmetrical triangle pattern
Higher lows indicate bullish strength and accumulation
Momentum shift visible on lower timeframes
Positive correlation with improving US equity market sentiment
Anticipation of dovish Fed tone could boost equities
🧠 Fundamental Context:
Market is cautiously optimistic ahead of FOMC this week; dovish stance expected due to recent soft economic indicators.
Earnings season tailwinds and lower bond yields support index gains.
Ongoing political and tariff-related headlines may cause volatility, but technical breakout remains in focus.
💡 Trade Idea:
Bias: Bullish
Entry: On successful retest of 40,580 or continuation above 40,600
TP1: 42,762
TP2: 43,924
Stop Loss: Below 38,950
📌 Note: Watch for pullbacks to triangle resistance-turned-support. FOMC and US macro data releases midweek can impact momentum.
US30 ShortOverall, the Dow Jones (US30) is bullish.
But has we all know, all the gaps are always filled. I'm shorting until the gap is filled and then the market might continue it's movement to the upside.

Trade Idea: US30 Long (BUY LIMIT)Justification:
Technical Analysis:
1. Daily Chart:
• Strong bullish reversal from recent lows.
• MACD is crossing up sharply, showing fresh bullish momentum.
• RSI at 62.33 — rising but not yet overbought (room to run).
• Price reclaiming key moving averages.
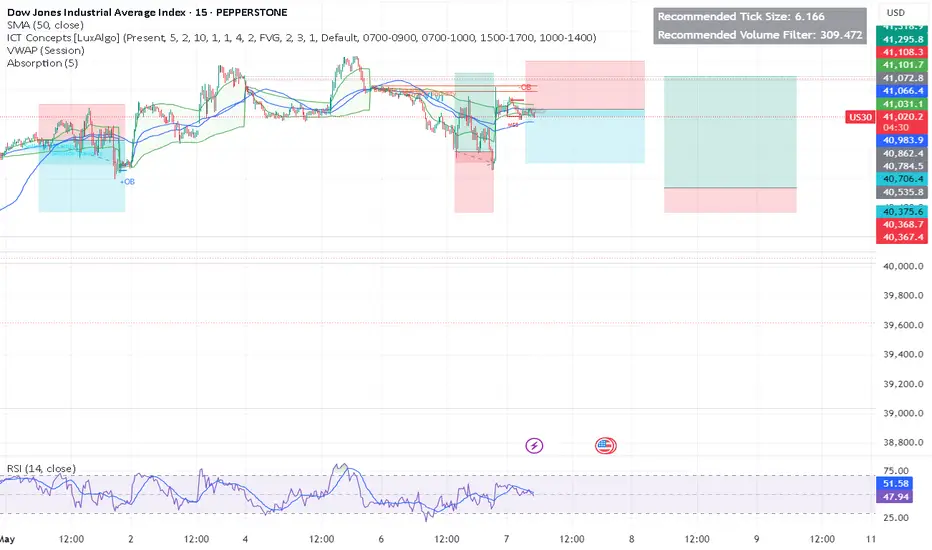
2. 15-Minute Chart:
• Clear uptrend continuation.
• MACD and RSI confirm bullish momentum.
• Price consolidating at recent highs — potential breakout formation.
3. 3-Minute Chart:
• Short-term consolidation near highs with low RSI (38.84) — possible dip-buy opportunity.
• MACD near zero — primed for a new short-term wave.
Fundamental Analysis (as of early May 2025 context):
• Likely market optimism surrounding softer inflation data and potential rate cuts.
• Dow components (industrials, financials) benefit from economic soft-landing expectations.
• VIX (if tracked) remains subdued, confirming risk-on sentiment.
⸻
Trade Plan (Long):
• Entry: 42,360
Near current consolidation zone on lower timeframes.
• Stop Loss (SL): 41,850
Below recent swing lows and key moving average support (approx. 510 pts risk).
• Take Profit (TP): 43,380
Targeting previous resistance area on the Daily chart (approx. 1020 pts reward).
FUSIONMARKETS:US30

Bullish continuation?Dow Jones (US30) has bounced off the pivot and could rise to the 1st resistance which lines up with the 145% Fibonacci extension.
Pivot: 40,653.80
1st Support: 39,774.46
1st Resistance: 42,181.26
Risk Warning:
Trading Forex and CFDs carries a high level of risk to your capital and you should only trade with money you can afford to lose. Trading Forex and CFDs may not be suitable for all investors, so please ensure that you fully understand the risks involved and seek independent advice if necessary.
Disclaimer:
The above opinions given constitute general market commentary, and do not constitute the opinion or advice of IC Markets or any form of personal or investment advice.
Any opinions, news, research, analyses, prices, other information, or links to third-party sites contained on this website are provided on an "as-is" basis, are intended only to be informative, is not an advice nor a recommendation, nor research, or a record of our trading prices, or an offer of, or solicitation for a transaction in any financial instrument and thus should not be treated as such. The information provided does not involve any specific investment objectives, financial situation and needs of any specific person who may receive it. Please be aware, that past performance is not a reliable indicator of future performance and/or results. Past Performance or Forward-looking scenarios based upon the reasonable beliefs of the third-party provider are not a guarantee of future performance. Actual results may differ materially from those anticipated in forward-looking or past performance statements. IC Markets makes no representation or warranty and assumes no liability as to the accuracy or completeness of the information provided, nor any loss arising from any investment based on a recommendation, forecast or any information supplied by any third-party.

DOW/US30 - we hope everyone make million last nightTeam, yesterday was a big win for all of us, twice the DOW/NAS massive win
today, the market will likely pull back toward the price set in the chart
make sure you have tight stop-loss
also, once it drops more than 50 points, bring stop loss to BE
we are looking at around 40930-40850
The interest rate decision within 12 hours time frame,
we expect the market will be volatile if it dumps toward our LONG entry position, which I set out in the chart.
Follow that, and you will kill the market with me
UNTIL then, I wish you all the best
Bullish momentum to extend?Dow Jones (US30) has bounced off the pivot which is an overlap support and could bounce to the 1st resistance that aligns with the 145% Fibonacci extension.
Pivot: 40,653.80
1st Support: 39,774.46
1st Resistance: 42,181.26
Risk Warning:
Trading Forex and CFDs carries a high level of risk to your capital and you should only trade with money you can afford to lose. Trading Forex and CFDs may not be suitable for all investors, so please ensure that you fully understand the risks involved and seek independent advice if necessary.
Disclaimer:
The above opinions given constitute general market commentary, and do not constitute the opinion or advice of IC Markets or any form of personal or investment advice.
Any opinions, news, research, analyses, prices, other information, or links to third-party sites contained on this website are provided on an "as-is" basis, are intended only to be informative, is not an advice nor a recommendation, nor research, or a record of our trading prices, or an offer of, or solicitation for a transaction in any financial instrument and thus should not be treated as such. The information provided does not involve any specific investment objectives, financial situation and needs of any specific person who may receive it. Please be aware, that past performance is not a reliable indicator of future performance and/or results. Past Performance or Forward-looking scenarios based upon the reasonable beliefs of the third-party provider are not a guarantee of future performance. Actual results may differ materially from those anticipated in forward-looking or past performance statements. IC Markets makes no representation or warranty and assumes no liability as to the accuracy or completeness of the information provided, nor any loss arising from any investment based on a recommendation, forecast or any information supplied by any third-party.

US30/DJI "Dow Jones" Index CFD Market Heist Plan (Day or Swing)🌟Hi! Hola! Ola! Bonjour! Hallo! Marhaba!🌟
Dear Money Makers & Robbers, 🤑💰✈️
Based on 🔥Thief Trading style technical and fundamental analysis🔥, here is our master plan to heist the US30/DJI "Dow Jones" Index CFD Market. Please adhere to the strategy I've outlined in the chart, which emphasizes short entry. Our aim is the high-risk Yellow MA Zone. Risky level, oversold market, consolidation, trend reversal, trap at the level where traders and bullish robbers are stronger. 🏆💸"Take profit and treat yourself, traders. You deserve it!💪🏆🎉
Entry 📈 : "The vault is wide open! Swipe the Bearish loot at any price - the heist is on!
however I advise to Place sell limit orders within a 15 or 30 minute timeframe most nearest or swing, low or high level for Pullback Entries.
Stop Loss 🛑:
📌Thief SL placed at the nearest/swing High or Low level Using the 1D timeframe (41000) Day/Swing trade basis.
📌SL is based on your risk of the trade, lot size and how many multiple orders you have to take.
Target 🎯: 35000 (or) Escape Before the Target
💰💵💸US30/DJI "Dow Jones" Index CFD Market Heist Plan (Swing/Day Trade) is currently experiencing a Bearish trend.., driven by several key factors.👇👇👇
📰🗞️Get & Read the Fundamental, Macro, COT Report, Geopolitical and News Analysis, Sentimental Outlook, Intermarket Analysis, Index-Specific Analysis, Future trend targets with Overall outlook score... go ahead to check 👉👉👉🔗🔗
⚠️Trading Alert : News Releases and Position Management 📰 🗞️ 🚫🚏
As a reminder, news releases can have a significant impact on market prices and volatility. To minimize potential losses and protect your running positions,
we recommend the following:
Avoid taking new trades during news releases
Use trailing stop-loss orders to protect your running positions and lock in profits
💖Supporting our robbery plan 💥Hit the Boost Button💥 will enable us to effortlessly make and steal money 💰💵. Boost the strength of our robbery team. Every day in this market make money with ease by using the Thief Trading Style.🏆💪🤝❤️🎉🚀
I'll see you soon with another heist plan, so stay tuned 🤑🐱👤🤗🤩

Everyone I am shorting DOW/US30Team I am shorting DOW, - MUST have stop loss the price could hit 40912-16 - but short slowly now, with STOP loss at 40960-65
Target 1 at 40750-40735 - reduce 30% volume
Target 2 at 40650-40600 - reduce 50% volume
Target 3 at 40550-740483 - remaining
Once the price reaches the first target, bring STOP LOSS TO BE
NEXT week, I will be releasing a video on how I made 1000% profit in 4 weeks. I would love to share my strategy with the world.

US30 Trading Into Major Resistance - Look For Dow Jones Retrace🔍 US30 Analysis: At the moment, I'm watching the US30 as it looks overextended 📈 and is trading into previous highs. 🧱 If you look left on the chart, it's approaching a key resistance level on both the weekly and daily timeframes.
I’m expecting a potential retracement 🔁 and monitoring for a bearish break of structure on the 30-minute timeframe ⏱️ as a possible setup for a counter-trend short 📉 — aiming for the imbalance zone visible on that timeframe.
📏 Drawing a Fibonacci retracement from the recent swing low to high, the 50% equilibrium 🔄 lines up perfectly with the imbalance area, adding confluence to the idea.
📚 This is shared for educational purposes only and should not be considered financial advice 💼.

Bearish drop off overlap resistance?Dow Jones (US30) is reacting off the pivot which has been identified as an overlap resistance and could drop to the 1st support.
Pivot: 40,653.80
1st Support: 39,356.30
1st Resistance: 41,490.90
Risk Warning:
Trading Forex and CFDs carries a high level of risk to your capital and you should only trade with money you can afford to lose. Trading Forex and CFDs may not be suitable for all investors, so please ensure that you fully understand the risks involved and seek independent advice if necessary.
Disclaimer:
The above opinions given constitute general market commentary, and do not constitute the opinion or advice of IC Markets or any form of personal or investment advice.
Any opinions, news, research, analyses, prices, other information, or links to third-party sites contained on this website are provided on an "as-is" basis, are intended only to be informative, is not an advice nor a recommendation, nor research, or a record of our trading prices, or an offer of, or solicitation for a transaction in any financial instrument and thus should not be treated as such. The information provided does not involve any specific investment objectives, financial situation and needs of any specific person who may receive it. Please be aware, that past performance is not a reliable indicator of future performance and/or results. Past Performance or Forward-looking scenarios based upon the reasonable beliefs of the third-party provider are not a guarantee of future performance. Actual results may differ materially from those anticipated in forward-looking or past performance statements. IC Markets makes no representation or warranty and assumes no liability as to the accuracy or completeness of the information provided, nor any loss arising from any investment based on a recommendation, forecast or any information supplied by any third-party.

US30US30 reacted from 38K level as predicted, now correction and further upside towards 41K level.
Disclosure: We are part of Trade Nation's Influencer program and receive a monthly fee for using their TradingView charts in our analysis.

Us30 Upward or downward?In the 5-minute timeframe, you can sell at the top of the trading range and buy at the bottom of the trading range (by observing reversal candles and patterns).
Alternatively, you can wait for a breakout and enter in the direction of the breakout.
Be mindful of fake breakouts

Could the price bounce from here?Dow Jones (US30) is falling towards the pivot which is an overlaps upport and could bounce to the 1st resistance which acts as a pullback resistance.
Pivot: 39,318.40
1st Support: 37,848.26
1st Resistance: 40,824.20
Risk Warning:
Trading Forex and CFDs carries a high level of risk to your capital and you should only trade with money you can afford to lose. Trading Forex and CFDs may not be suitable for all investors, so please ensure that you fully understand the risks involved and seek independent advice if necessary.
Disclaimer:
The above opinions given constitute general market commentary, and do not constitute the opinion or advice of IC Markets or any form of personal or investment advice.
Any opinions, news, research, analyses, prices, other information, or links to third-party sites contained on this website are provided on an "as-is" basis, are intended only to be informative, is not an advice nor a recommendation, nor research, or a record of our trading prices, or an offer of, or solicitation for a transaction in any financial instrument and thus should not be treated as such. The information provided does not involve any specific investment objectives, financial situation and needs of any specific person who may receive it. Please be aware, that past performance is not a reliable indicator of future performance and/or results. Past Performance or Forward-looking scenarios based upon the reasonable beliefs of the third-party provider are not a guarantee of future performance. Actual results may differ materially from those anticipated in forward-looking or past performance statements. IC Markets makes no representation or warranty and assumes no liability as to the accuracy or completeness of the information provided, nor any loss arising from any investment based on a recommendation, forecast or any information supplied by any third-party.

US30Anyone Bearish or Bullish, say something
I willl be aggressively Bullish if US30 breaks the 40000.00 key level and get a clear retest, supporting it to go higher, to 42020.00 key level.
>US30 failed to break 37864.46 key level to continue selling, now 37864.46 is supporting US30 to go higher.
>US30 is supported by the trend line.
But if US30 fails to break the 40000.00 key level. I will be going with the market structure, as US30 is been selling. But will be aggressive selling if US30 trade below 37864.46 key level
Update will be given

US30 DIP BUYEASY DOUBLE BOTTOM RETRACEMENT. Having a retracement from the previous high and breaking volume direction.

DOW/US30 - what the expectation from the marketTeam, last week we kill the market
I have prepare for the next week strategy
We currently have some small volume position long at this stage
and will add more if the market down to next level,
However, we expect some recovery at this stage.
Strategy:
TARGET 1 - 39266-39335
TARGET 2 - 39375-39467
TARGET 3 at 39600-39929
TARGET 4 at 40.400-41400 - run with mini volume and hold.

DOW/US30Team, time to go long DOW/US30
yesterday the market disappointed on the FED decision,
i just cant believe the FED compare the inflation in 2020-2021 that is where the COVID and lock down. And compare to 2024. he should have cut the interest rate to ease the market.
Given the fact the market is dropping 1000 points, i expect we should have some recover at least 200-300 points medium
Target 1 at 39225
Target 2 at 39335-39420
Target 3 at 39560-39670
We should see the market pump in 2-3 hour time frame or recover.
