US30 Trade Set Up Dec 29 2025Price has retraced down to test Daily FVG and PDL, so first id like to see if sweep PDL and fill the gap before looking for internal 1m-5m IFVG/CISD to take price higher back towards PDH
Us30analysis

US30 Trade Set Up Dec 26 2025Overall im bullish. Price has broken out of the Asia range, swept London highs so now i will wait to see if price can sweep London lows to then form 1m-5m IFVG/CISD to target PDH

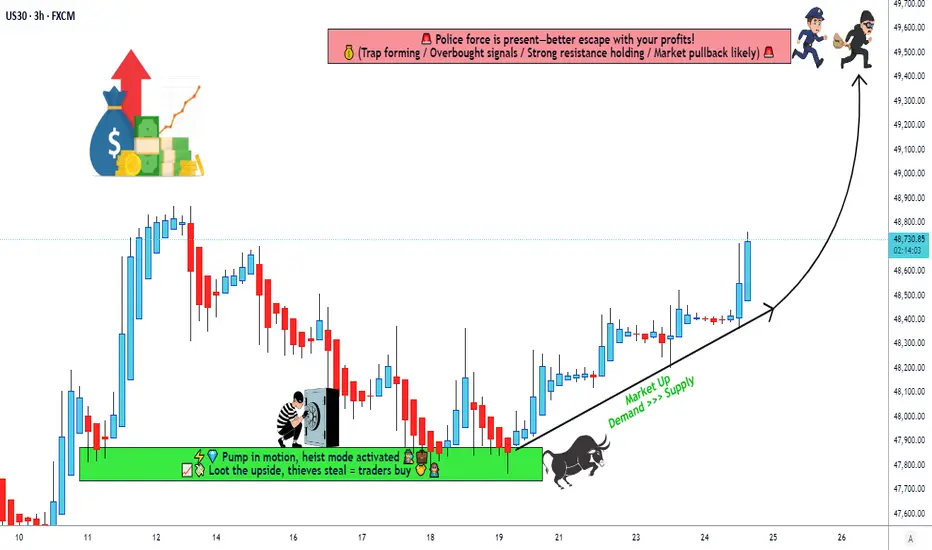
Dow Jones Buyers Control the Market — Trade With Caution!📊 US30 / DJIA "DOW JONES INDUSTRIAL AVERAGE" | CFD Day/Swing Trade
🎯 TRADE SETUP - BULLISH OPPORTUNITY 💰
CURRENT MARKET STATUS 📍
Current Price: ~$48,442 USD
52-Week Range: $36,611.78 - $48,886.86
Recent High (Dec 12): $48,886.86
Recent Trading Range: $48,254 - $48,527
Status: Consolidation Phase After Expansion
🚀 BULLISH TRADE PLAN 📈
📌 Entry Strategy
Flexible Entry Points: Apply pullback entries for better risk/reward
Optimal Zone: $48,000 - $48,300 (after corrective dips)
Entry Confirmation: Look for bullish reversal patterns from support levels
🛑 Stop Loss - MANDATORY RISK MANAGEMENT
SL Level: $48,200 (Recommended Range: $48,000 - $48,200)
⚠️ DISCLAIMER: Adjust SL based on YOUR personal risk tolerance & strategy
Risk Management: Only risk what you can afford to lose
Your Choice: You are responsible for your own SL placement
🎊 Take Profit Targets
Primary Target: $49,500
Resistance Zone: $48,750 - $49,000 (Police Barricade Level)
Technical Setup: Strong resistance + Overbought conditions expected
Exit Strategy: Take profits at zone, don't be greedy
⚠️ DISCLAIMER: TP placement is YOUR decision - manage accordingly
═════════════════════════════════════════════════════════════
📊 TECHNICAL ANALYSIS FACTORS 🔍
✅ Bullish Structure
Price action in bullish channel structure
Respecting ascending trendline
Recent sweep of Asia lows & London highs inverted
Pullback support at key Fibonacci levels (61.8% retracement)
⚠️ Caution Zones
Overbought conditions approaching resistance
Possible trap/correction near $48,750
Profit-taking pressure expected at resistance
Market consolidation showing selective participation
═════════════════════════════════════════════════════════════
💡 CORRELATED PAIRS TO MONITOR 💵
🔴 S&P 500 (SPY / SPX) - High Correlation (0.86+)
Mirror movements with DJI in blue-chip heavy market
Tech momentum affects broader index performance
Watch for divergence signals
Target: $7,200-$7,787 by end 2026
🔵 NASDAQ-100 (QQQ / NDX) - Tech Correlation
DJI has large-cap tech exposure (NVDA, MSFT in components)
QQQ outperformance may signal strength
Volatility: 4.58% vs SPY 3.03% (higher risk/reward)
🟢 Russell 2000 (IWM) - Small-Cap Divergence
Watch for small-cap underperformance
Indicates risk-off sentiment
DJI = blue-chip stability play
🟡 Treasury Yields (10Y TLT) - Inverse Relationship
Lower yields = DJI strength (current environment)
Fed cuts support valuations
Monitor yield curve for macro signals
═════════════════════════════════════════════════════════════
🌍 FUNDAMENTAL & ECONOMIC FACTORS 📌
Federal Reserve Policy (Dec 10, 2025)
Fed Funds Rate: 3.50% - 3.75% (3rd cut in 2025)
Total 2025 Cuts: 1.75% reduction since Sept 2024
2026 Outlook: Only 1-2 cuts expected (markets priced in 2 × 25bps)
Impact: Lower rates = supportive for equities ✅
Labor Market Status 👥
Job gains slowing through 2025
Unemployment rate edged up through September
Announced layoffs exceeded 1.1M through November
Market expects "low-hire, low-fire" environment
Recent data shows cooling labor market
Inflation Picture 📊
Inflation moved UP since earlier 2025
Core PCE: 2.8% (above 2% target)
Tariff-related price hikes filtering through economy
Elevated uncertainty around inflation trajectory
Economic Growth 💹
Moderate expansion of economic activity
Q1 2026 GDP boost expected from tax cuts (0.5-0.8%)
Government data gaps due to 43-day shutdown
Consensus: 2.6% GDP growth 2026
Policy Uncertainty ⚡
Trump Fed Chair nomination pending (Kevin Hassett likely)
Preference for lower rates signals potential policy shift
Fed operational transition (Powell ends May 2026)
Tariff implementation affects corporate earnings
═════════════════════════════════════════════════════════════
📈 WHY THE BULLISH CASE NOW
✅ Supporting Factors
Fed Support: Rate cuts completed, likely pause in 2026
Valuation: Blue-chip large-caps relatively attractive
Seasonality: Historical year-end rally (1-1.88% in final 10-12 days)
Tax Stimulus: Consumer tax returns expected Q1 2026
Earnings Resilience: Consumer data shows credit resilience
AI Buildout: Demand secured for years (benefits large-cap tech in DJI)
⚠️ Risk Factors
Margin Debt: Up 42% in 7 months (historically precedes declines)
Geopolitical: Elevated international tensions
Inflation Resurgence: Tariff-driven pressures remain
Recession Risk: Some Fed members worried without more cuts
Overbought Conditions: DJI near 52-week highs
═════════════════════════════════════════════════════════════
🎓 TRADE MANAGEMENT GUIDELINES
IMPORTANT DISCLAIMERS ⚠️
This is NOT financial or investment advice
Past performance ≠ future results
All trading involves substantial risk of loss
You are solely responsible for your trading decisions
Only risk capital you can afford to lose
Adjust SL & TP based on YOUR personal strategy
This analysis is for educational purposes only
Best Practices
✓ Use proper position sizing
✓ Maintain strict risk management
✓ Track your risk/reward ratio minimum 1:2
✓ Monitor economic calendar for catalysts
✓ Watch Fed speaker comments & data releases
✓ Consider correlation moves in SPY, QQQ, TLT
✓ Exit partial positions at first resistance
✓ Let winners run with trailing stops
═════════════════════════════════════════════════════════════
⏰ ECONOMIC CALENDAR WATCH 📅
Key Upcoming Data
Monthly Jobs Report (impacts unemployment rate)
PCE Inflation Data (validates Fed pause)
Fed Speaker Comments (Powell, new chair nominee)
Treasury Auctions (yields important for DJI)
Q1 2026 GDP Estimates (Trump tax cuts impact)
Trade Data (tariff implications)
═════════════════════════════════════════════════════════════
📊 CHART READING TIPS
Support: $48,000-$48,200 (order block)
Resistance: $48,750-$49,000 (police barricade)
Breakout: Above $49,000 = next phase
Breakdown: Below $48,000 = invalidates bullish case
Timeframes: 1H-4H for day trade, Daily for swing
═════════════════════════════════════════════════════════════
💬 FINAL THOUGHTS
The DJI setup presents a bullish opportunity supported by Fed accommodation and seasonal strength. However, elevated risks including margin debt, inflation concerns, and overbought conditions warrant careful position management.
Thesis: Short-term bullish bias with defined risk-reward to $49,500 target. Watch macro data and Fed communications closely.
Good luck, traders! 🎯✅
Always trade responsibly. This analysis should not be your only basis for trading decisions.
═════════════════════════════════════════════════════════════
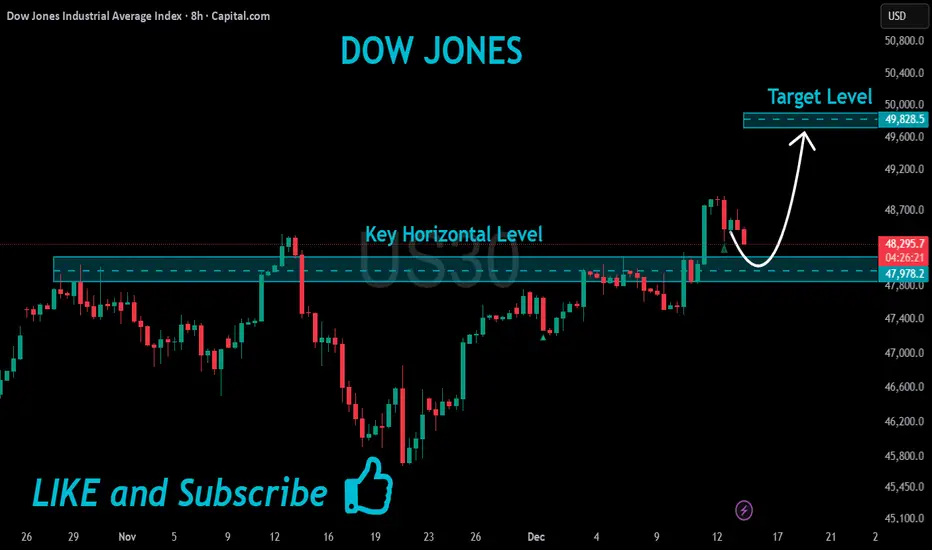
US30 Will Keep Growing!
HI,Traders !
#US30 made a bullish
Breakout of the key
Horizontal level of 47978.2
And the breakout is confirmed
So we are bullish biased
And we will be expecting
A further bullish move up !
Comment and subscribe to help us grow !
US30 Trade Set Up Dec 24 2025Price has respected a 1h bullish FVG, is making HL and swept Asia lows and highs so i will wait for a pull back into internal 5m FVG followed by 1m-5m IFVG/CISD to target PDH

Could we see a bounce from here?Dow Jones (US30) is reacting off the pivot and could bounce to the swing high resistance.
Pivot: 48,390.90
1st Support: 48,230.84
1st Resistance: 48,697.68
Disclaimer:
The opinions given above constitute general market commentary and do not constitute the opinion or advice of IC Markets or any form of personal or investment advice.
Any opinions, news, research, analyses, prices, other information, or links to third-party sites contained on this website are provided on an "as-is" basis, are intended to be informative only, and are not advice, a recommendation, research, a record of our trading prices, an offer of, or solicitation for, a transaction in any financial instrument and thus should not be treated as such. The information provided does not involve any specific investment objectives, financial situation, or needs of any specific person who may receive it. Please be aware that past performance is not a reliable indicator of future performance and/or results. Past performance or forward-looking scenarios based upon the reasonable beliefs of the third-party provider are not a guarantee of future performance. Actual results may differ materially from those anticipated in forward-looking or past performance statements. IC Markets makes no representation or warranty and assumes no liability as to the accuracy or completeness of the information provided, nor any loss arising from any investment based on a recommendation, forecast, or any information supplied by any third party

US30 H4 | Bearish Drop OffMomentum: Bullish
The price has reacted off the sell entry, which is a pullback resistance, and could drop to the 1st support.
Sell entry: 48,075.05
Pullback resistance
Stop loss: 48,478.00
Pullback resistance
Take profit: 47,497.34
Pullback suport
High Risk Investment Warning
Stratos Markets Limited (tradu.com ), Stratos Europe Ltd (tradu.com ):
CFDs are complex instruments and come with a high risk of losing money rapidly due to leverage. 70% of retail investor accounts lose money when trading CFDs with this provider. You should consider whether you understand how CFDs work and whether you can afford to take the high risk of losing your money.
Stratos Global LLC (tradu.com ): Losses can exceed deposits.
Please be advised that the information presented on TradingView is provided to Tradu (‘Company’, ‘we’) by a third-party provider (‘TFA Global Pte Ltd’). Please be reminded that you are solely responsible for the trading decisions on your account. Any information and/or content is intended entirely for research, educational and informational purposes only and does not constitute investment or consultation advice or investment strategy. The information is not tailored to the investment needs of any specific person and therefore does not involve a consideration of any of the investment objectives, financial situation or needs of any viewer that may receive it. Past performance is not a reliable indicator of future results. Actual results may differ materially from those anticipated in forward-looking or past performance statements. We assume no liability as to the accuracy or completeness of any of the information and/or content provided herein and the Company cannot be held responsible for any omission, mistake nor for any loss or damage including without limitation to any loss of profit which may arise from reliance on any information supplied by TFA Global Pte Ltd.

US30 Trade Set Up Dec 23 2025Price is making LL/LH and has broken Asia lows so i will look for internal 1m-5m bearish structure after a pullback to target PDL

Bullish bounce off?Dow Jones (US30) is falling towards the pivot, which is a pullback support and could bounce to the pullback resistance.
Pivot: 48,242.25
1st Support: 48,027.46
1st Resistance: 48,693.05
Disclaimer:
The opinions given above constitute general market commentary and do not constitute the opinion or advice of IC Markets or any form of personal or investment advice.
Any opinions, news, research, analyses, prices, other information, or links to third-party sites contained on this website are provided on an "as-is" basis, are intended to be informative only, and are not advice, a recommendation, research, a record of our trading prices, an offer of, or solicitation for, a transaction in any financial instrument and thus should not be treated as such. The information provided does not involve any specific investment objectives, financial situation, or needs of any specific person who may receive it. Please be aware that past performance is not a reliable indicator of future performance and/or results. Past performance or forward-looking scenarios based upon the reasonable beliefs of the third-party provider are not a guarantee of future performance. Actual results may differ materially from those anticipated in forward-looking or past performance statements. IC Markets makes no representation or warranty and assumes no liability as to the accuracy or completeness of the information provided, nor any loss arising from any investment based on a recommendation, forecast, or any information supplied by any third party

US30 Trade Set Up Dec 22 2025Price is in bullish structure, has swept Asia lows and London highs and inverted a 30m bearish FVG so i will want to see a pullback into it to then look for 1m-5m IFVG/CISD to target PDH

Bullish momentum to extend?Dow Jones (US30) is falling towards the pivot, which is a pullback support and could rise to the 161.8% Fibonacci extension.
Pivot: 47,063.30
1st Support: 45,135.60
1st Resistance: 50,049.13
Disclaimer:
The opinions given above constitute general market commentary and do not constitute the opinion or advice of IC Markets or any form of personal or investment advice.
Any opinions, news, research, analyses, prices, other information, or links to third-party sites contained on this website are provided on an "as-is" basis, are intended to be informative only, and are not advice, a recommendation, research, a record of our trading prices, an offer of, or solicitation for, a transaction in any financial instrument and thus should not be treated as such. The information provided does not involve any specific investment objectives, financial situation, or needs of any specific person who may receive it. Please be aware that past performance is not a reliable indicator of future performance and/or results. Past performance or forward-looking scenarios based upon the reasonable beliefs of the third-party provider are not a guarantee of future performance. Actual results may differ materially from those anticipated in forward-looking or past performance statements. IC Markets makes no representation or warranty and assumes no liability as to the accuracy or completeness of the information provided, nor any loss arising from any investment based on a recommendation, forecast, or any information supplied by any third party

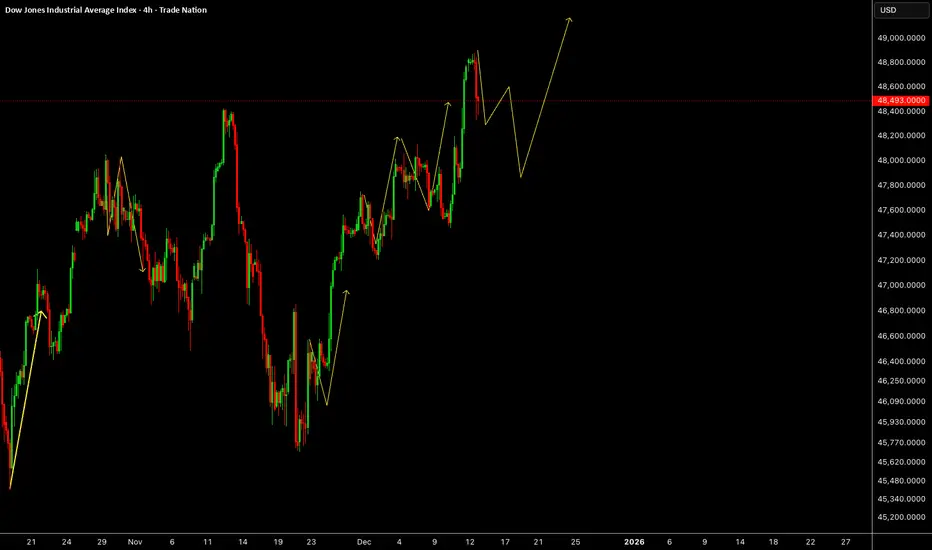
US30 Enters a Consolidation Phase After Strong ExpansionUS30 is currently transitioning into a pause following its recent impulsive move, with price action becoming more controlled on the 4H timeframe. This phase reflects a market that is reassessing momentum rather than aggressively extending in one direction. Participation appears more selective, suggesting traders are waiting for clearer macro cues before committing further. Such behaviour often precedes the next volatility expansion, making this a key phase to observe as the broader structure continues to develop.
Disclosure: We are part of Trade Nation's Influencer program and receive a monthly fee for using their TradingView charts in our analysis.

US30 Trade Set Up Dec 19 2025Price is making HL on the 1h and has broken out of Asia highs so i will want to see a pull back to sweep London lows and tap into 1h FVG to then form 1-5m IFVG/CISD to go higher to PDH and supply

US30 Trade Set Up Dec 18 2025Price has bounced off strong demand during Asia, London has broken out of Asia and has inverted 1h FVG so i will wait for a pullback followed by internal 1m-5m IFVG/CISD to push higher into PDH and fib levels

US30 Trade Set Up Dec 17 2025Price is making LL/LH on the 1h and has swept Asia highs and filled 4h FVG so i will wait for internal 1m-5m IFVG/CISD to target PDL

US30 Trade Set Up Dec 16 2025Price has respected a daily FVG multiple times and failed to sweep PDL followed by inverting a 1h FVG to then sweep Asia highs and fill a 1h bearish FVG so now i will want to see internal 1m-5m bullish structure to continue its uptrend to PDH

US30 | ANALYSIS📊 US30 Update — Key Structure Levels Active
US30 is trading around an important structure zone where buyers have shown strength before. As long as price holds above support, bullish momentum remains valid, with potential continuation toward the next resistance area.
🔓 Entry: 48,395
❌ Stop Loss: 48,192
🎯 Target: 48,627
Price action around these levels will be crucial for confirmation.
Do you expect continuation or a short-term pullback from here? Drop your bias below 👇
Your like/support helps this idea reach more traders 🚀
⚠️ Disclaimer: This post reflects personal market analysis and is not financial advice.

Dow Jones Shows Neutrality After Reaching New HighsDespite the bullish movement the index experienced following the Federal Reserve’s decision in the United States, the beginning of this week has shown a renewed bearish move, with the last two sessions accumulating a decline of nearly 1%. This indicates that a new selling bias has started to emerge within the broader long-term uptrend. For now, the optimism driven by expectations of lower interest rates appears to be fading, and as we enter a period with fewer relevant economic data releases, the index may begin to show a phase of steady indecision as the market prepares for the end of the year. This environment could bring a period of neutrality in the Dow Jones price action over the coming trading sessions.
Long-Term Uptrend Holds
For several months, a broad upward trend has been sustained in the Dow Jones, progressively pushing the index toward the psychological zone of 50,000 points. So far, no significant bearish corrections have emerged that could threaten this structure, making it the most important technical element to monitor in the coming weeks.
However, in the short term, as the price has reached new highs, a constant zone of indecision has begun to appear, which may lead to short-term bearish corrections if buying pressure fails to remain strong.
RSI
Currently, the RSI remains consistently above the neutral 50 level, indicating that buying momentum continues to dominate the index’s short-term movements. However, it is important to note the emergence of lower highs in the RSI, while the Dow Jones price itself continues to register higher highs. This behavior suggests the formation of a bearish divergence, signaling a possible imbalance in momentum that could lead to minor bearish corrections in the next sessions.
MACD
The MACD histogram is gradually moving back toward the zero line, which suggests a scenario of balanced momentum in short-term moving averages. If this behavior continues, the Dow Jones price may enter a more prolonged phase of indecision, with less directional movement.
Key Levels to Watch
48,850 points – Main resistance:
The newest high, now acting as the most important resistance. Price movements that consistently break above this level would strengthen the bullish bias and could extend the current long-term uptrend.
48,051 points – Nearby barrier:
A short-term neutrality zone that may serve as support against potential bearish corrections.
47,156 points – Important support:
This level aligns with the 50-period simple moving average and represents the key support for bearish movements. If the price retraces back to this area, the dominant uptrend may begin to lose strength, potentially activating a period of neutrality and leading to a short-term sideways range.
Written by Julian Pineda, CFA, CMT – Market Analyst

US30 Trade Set Up Dec 15 2025Price made a new ATH last week and has left a daily gap below which i will expect price to fill this week before continuing higher. So for now price is trading within a bearish 4h FVG, approaching 1h supply and has swept both Asia and London highs so i will wait and see if price makes internal 1m-5m CISD/IFVG to reverse down to Asia lows and PDL

US30: Is the Index Pausing Before the Next Expansion?US30 continues to trade within a broader constructive structure, with recent price action showing a clear pause after an aggressive upside sequence. Momentum has cooled without a full reversal, suggesting the market may be recalibrating rather than distributing before the next impulse.
**Disclosure:** We are part of Trade Nation's Influencer program and receive a monthly fee for using their TradingView charts in our analysis.
US30 Trade Set Up Dec 12 2025Price remains bullish making ATH so i will want to see price first sweep internal London lows or lower SSL first before looking for 1m-5m IFVG/CISD to continue higher

US30: Late-Cycle Pop or Pullback Setup?The 𝐃𝐨𝐰 is pressing fresh highs into a historically soft seasonal window with stretched momentum and limited follow-through. I’m initiating/adding to a daily timeframe short aiming for a retrace back into prior breakout territory. My baseline path is a drift lower toward 44,500–44,000 (T1) and then the broader demand band near 43,000–42,2500 (T2), where I’ll reassess.
This isn’t a “crash” call—just a tactical mean-reversion as macro tailwinds fade, breadth narrows and the first Fed cut shifts the narrative from “rates down” to “why they’re down.”
Technicals:
• Stretched swing: Price has stair-stepped higher with shallow pullbacks; we’re now extended above the 50/100-DMA stack with waning impulse on push days (smaller real bodies, upper wicks).
• Local resistance: Repeated stalls into the same supply shelf. I’m leaning into the most recent failed extension and fading the box.
Structure map:
• Entry: around/into the failed-break zone 46.4k area.
• Invalidation: daily close > recent spike highs around 47.7k-48.0k.
• Targets: T1 45,000–44,500 (prior ATH retest / micro-POC region); T2 44,000–43,000.
• Risk: 0.5–1.0R per add; scale in only on rejection prints or lower-highs.
Fundamentals:
1) The first Fed cut is not automatically bullish.
The Fed delivered a 25 bps cut in September and signaled more easing, which historically can coincide with late-cycle growth scares and choppier equity returns rather than a straight-line melt-up. The cut was framed around cooling activity and inflation progress. 
2) Growth data is mixed—manufacturing still weak.
The ISM Manufacturing PMI remained in contraction in August (48.7)—below the 50 expansion line—signaling ongoing softness in goods demand. That is typically a headwind for the Dow’s cyclical mix. 
3) ES500 (S&P 500) breadth is narrow; concentration risk elevated.
Mega-caps continue to dominate performance and index leadership, while equal-weight underperforms and concentration risk stays high—conditions that historically increase pullback vulnerability. 
4) Valuations are rich versus history.
FactSet’s mid-summer forward 12-month P/E for the S&P 500 hovered well above 5- and 10-year averages (>22x vs. ~19x/17x), leaving less cushion if growth wobbles or margins compress. 
5) Sentiment & seasonality aren’t tailwinds.
September/early Q4 are seasonally tricky—historically the weakest stretch for US equities—just as the market tries to price the path of cuts vs. growth. 
6) Policy & trade headline risk.
Tariff timelines and “reciprocal” duties remain in play (with officials signaling Aug-1 implementation and additional measures possible), a rolling overhang for global cyclicals and exporters tied into the Dow complex. 
Note: Please remember to adjust this trade idea according to your individual trading conditions, including position size, broker-specific price variations, and any relevant external factors. Every trader’s situation is unique, so it’s crucial to tailor your approach to your own risk tolerance and market environment.

DOW/US30 - OVER BOUGHT Team, I hope you recall the trade last 3 days ago about OPPORTUNITY OF BEAUTIFUL CHART
Since then, it has been running up over 1400 points in 3 days.
Now I find myself in a good time to SHORT, with 3-4 confluences to make that decision.
1- 1400 points up in 3 days, (2 days up because of RATE cut)
2 - Daily chart indicates overbought
3 - NEW ATH
Therefore, we expect a small retracement.
SHORT range at 48787 - 48850 - STOP LOSS above 50050
Target 1 at 48715-48650
Target 2 at 48600-48550
Target 3 at 48412-48350
LETS GO
