US30 Trade Set Up Dec 3 2025Price failed to make a HH on the 1h, swept PDH and has reversed so i will look for internal 5m-15m bearish structure to target PDL
Us30analysis

US30 Trade Set Up Dec 2 2025Price swept PDL, engulfed bearish 1h and 4h candles and is now testing 1h FVG so i will look for internal 1m-5m bullish structure followed by IFVG/CISD to take buys to PDH

US30 Trade Set Up Dec 1 2025Price is overall bullish but there are bullish daily FVGs that i will expect price to fill before continuing bullish so i will wait for London high and bearish FVG to be swept to then look for internal 1m-5m IFVG/CISD to target. But if price tests the daily FVG first, i will then look for internal structure to take buys to BSL

US30 : Bullish Continuation SetupThe Dow Jones Index continues to climb steadily on the 4-hour timeframe, with recent momentum reinforcing a constructive bullish sequence. Price action is shaping a potential continuation phase heading into December, as market sentiment remains supportive following the recent recovery leg.
Disclosure: We are part of Trade Nation's Influencer program and receive a monthly fee for using their TradingView charts in our analysis.
US30 Trade Secured 1500 PipsSet up played out perfectly, sweeping SSL/Asia Lows, engulfed on the 5m-15m to push higher to -4.25/-4.5 fib

US30 Trade Set Up Nov 28 2025Price remains bullish. Price action isnt the cleanest due to the CME shutdown but i will want to see price sweep PDL, tap into daily FVG to then form 1m-5m IFVG/CISD to continue higher to BSL

US30 Trade Set Up Nov 27 2025Price remains overall bullish but we did break structure to the downside on the 1h in London session so i will be looking for BSL sweep of London or Asia highs followed but internal 1m-5m IFVG/CISD to target 50% of 4h FVG and PDL

US30 Trade Secured 1500 PipsTrade played out perfectly, sweeping SSL in London session, inverting and engulfing on the 15m and 1h to the upside followed by a HL on the 15m to target daily FVG

US30 Trade Set Up Nov 26 2025Price remains in a bullish trend in the 1h so as long as price keeps making HL i will want to see a retest of 1h IFVG or internal SSL to then make 1m-5m IFVG/CISD to continue to fill the daily FVG and sweep BSL

US30 DOW JONES at Resistance: Here's My Trade PlanI'm keeping a close eye on US30 right now. The market has pushed into a clean bullish breakout, printing higher highs and higher lows across both the H4 and H1 timeframes. 🚀
At the moment, price is overextended and tapping into a significant resistance zone, suggesting that a retracement is likely. Some aggressive traders may look for a counter-trend short, but that comes with elevated risk. ⚠️
Personally, I’m waiting for a healthy pullback, followed by a bullish break of structure to confirm a trend continuation setup. That’s where the higher-probability opportunity may unfold. ✔️
Not financial advice — for educational purposes only.

US30 Trade Set Up Nov 25 2025Price remains bullish and has swept SSL already in Asia and London followed by a 1h engulfing and CISD so i will wait for more internal bullish structure on the 5m before looking for buys above PDH to target BSL

US30 Trade Secured 2500 PipsPlayed out perfectly, sweeping SSl and London lows to then engulf and invert on the 5m to target PDL/BSL

US30 Trade Set Up Nov 24 2025Price has swept 1h SSL in London and engulfed 1h bearish candle so i want to see a internal 15m SSL swept followed by 1m-5m IFVG/CISD to target PDH

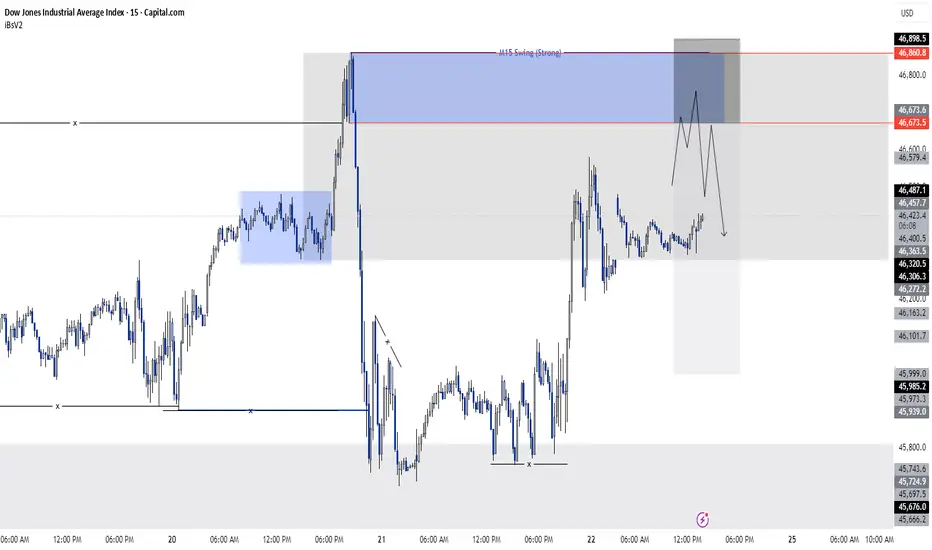
US 30 sell idea As we know, the swing structure on both the H4 and M15 timeframes is bearish. And we also know that we cannot take trades directly from the H4 timeframe, so to refine our entry we move down to the M15 timeframe and take our entry from there.
Now, on the H4 timeframe, we observed that the H4 swing is bearish, and at the same time, the H4 has also swept a fractal zone, after which the market moved downward. Now, for the market to continue its trend, it will make a pullback. We will look for this pullback on the M15 timeframe because we will take our sell entry from the M15 timeframe.
And on the M15 timeframe, when the price comes into our blue zone (46673.5 – 46860.8), we will take a sell trade.
US30 – Sharp Drop Stabilising with a Potential Recovery PathAfter a pronounced downside move, price has begun to stabilise with a volatile rebound pattern forming. If this developing structure continues to hold, a gradual upward continuation scenario may unfold as sentiment attempts to shift in the coming sessions.
Disclosure: We are part of Trade Nation's Influencer program and receive a monthly fee for using their TradingView charts in our analysis.
US30 Trade Set Up Nov 21 2025As of right now price is in a range so i want to see internal structure form first to either sweep BSL followed but 1m-5m CISD/IFVG to target lows again or a push higher to fill 4h FVG

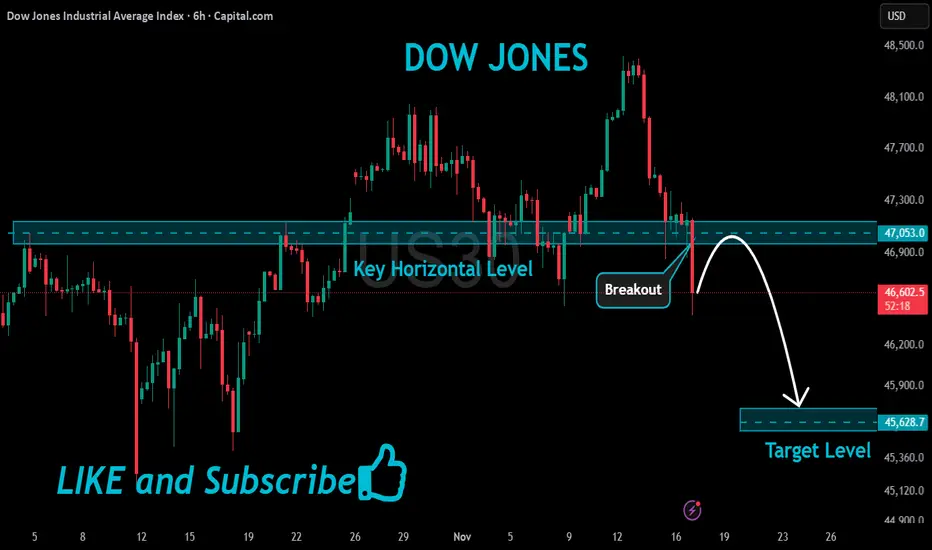
US30 Bearish Breakout!
HI,Traders !
#US30 made a bearish
Breakout of the key horizontal
Level of 47053.0 and the
Breakout is confirmed
So we are bearish biased
And we will be expecting
A further bearish move down !
Comment and subscribe to help us grow !
US30 Trade Secured 2500 Pipsprice manipulated higher into daily FVG and sweeping BSL to then engulf and BOS to the downside to target PDL

US30 Trade Set Up Nov 20 2025Over all im still bearish for indices so i want to see a sweep of BSL and tap into fib levels to then wait for for 5m-15m bearish engulfing and CISD/IVFG to target SSL/PDL

US30 Trade Set Up Nov 19 2025Us30 is still in a overall bearish trend but there is a lot of daily imbalance above that needs to be filled eventually if we sweep SSL and stay closed above, i will look for internal 1m-5m IFVG/CISD to target BSL/PDH

US30 Trade Set Up Nov 18 2025Price is showing strong bearish movement, creating LL/LH on the 1h and 15m and has BOS on the 15m so first id want to see price sweep internal BSL and tap into 15m or 1h FVG before looking for a continuation back down to lower SSL and 4h FVG

Dow Jones - Looking To Sell Pullbacks In The Short TermH1 - Strong bearish move.
No opposite signs.
Expecting bearish continuation until the two Fibonacci resistance zones hold.
If you enjoy this idea, don’t forget to LIKE 👍, FOLLOW ✅, SHARE 🙌, and COMMENT ✍! Drop your thoughts and charts below to keep the discussion going. Your support helps keep this content free and reach more people! 🚀
-------------------------------------------------------------------------------------------------------------------

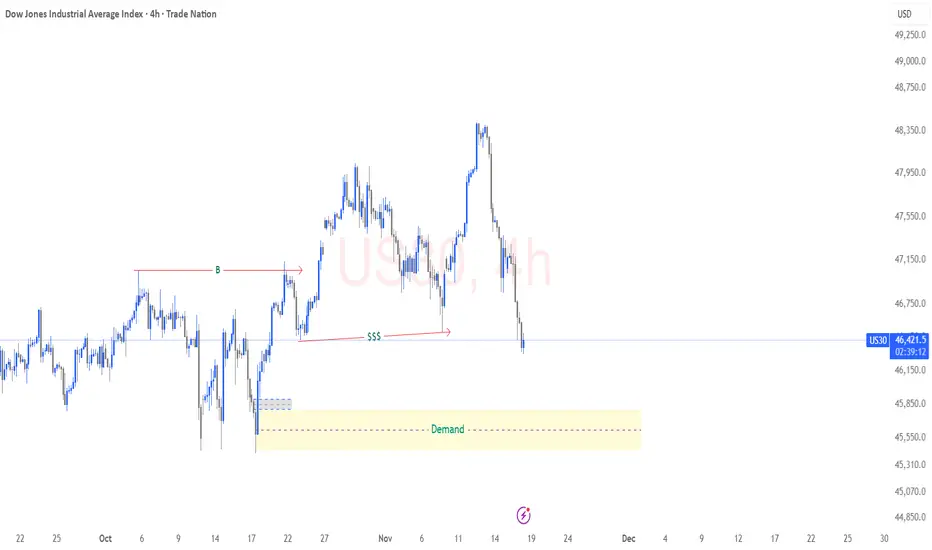
US30 – Potential Buy Setup into Higher-Timeframe Demand 4HPrice has already printed a Break of Structure (BOS), confirming bullish order flow on the 4H timeframe. The current sell-off is corrective, not a trend reversal. As price retraces, it sweeps internal liquidity (SSS) and taps into a strong 4H demand zone – the same zone that caused the BOS.
This area offers discounted pricing for a potential continuation of the bullish move. If lower-timeframe confirmations appear inside the demand zone, we can expect price to rotate upward and target the imbalance and highs left above.
A value-driven buy: wait for confirmation, then aim for bullish continuation in line with the structural bias.