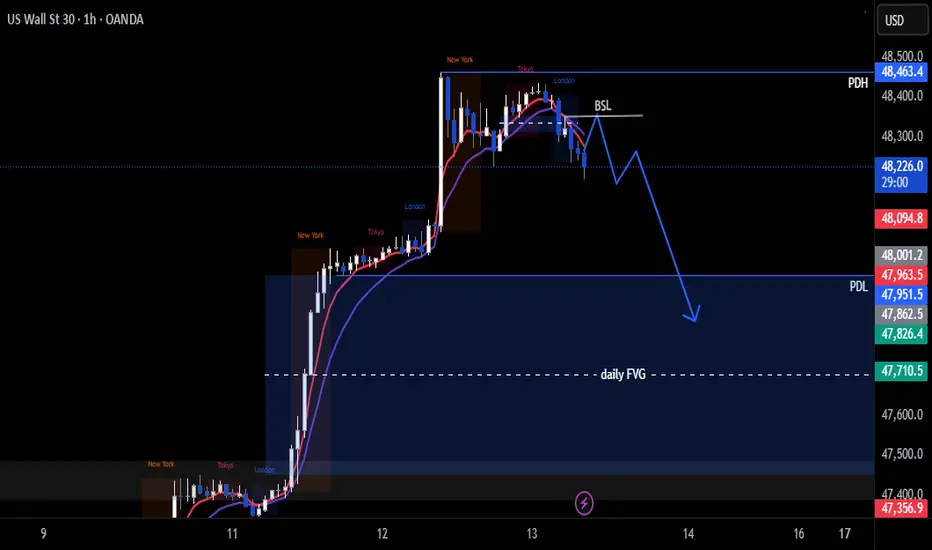
US30 Trade Set Up Nov 18 2025Price is showing strong bearish movement, creating LL/LH on the 1h and 15m and has BOS on the 15m so first id want to see price sweep internal BSL and tap into 15m or 1h FVG before looking for a continuation back down to lower SSL and 4h FVG
Us30analysis

Dow Jones - Looking To Sell Pullbacks In The Short TermH1 - Strong bearish move.
No opposite signs.
Expecting bearish continuation until the two Fibonacci resistance zones hold.
If you enjoy this idea, don’t forget to LIKE 👍, FOLLOW ✅, SHARE 🙌, and COMMENT ✍! Drop your thoughts and charts below to keep the discussion going. Your support helps keep this content free and reach more people! 🚀
-------------------------------------------------------------------------------------------------------------------

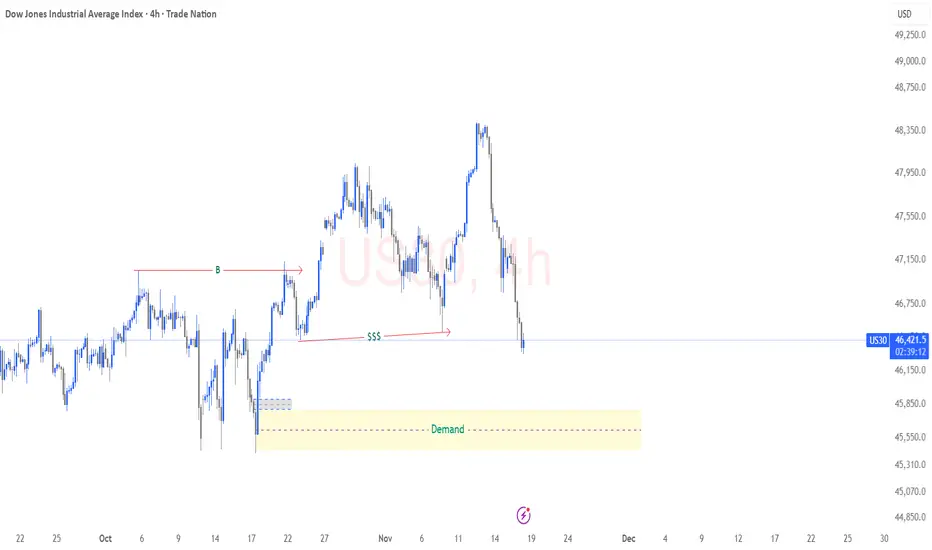
US30 – Potential Buy Setup into Higher-Timeframe Demand 4HPrice has already printed a Break of Structure (BOS), confirming bullish order flow on the 4H timeframe. The current sell-off is corrective, not a trend reversal. As price retraces, it sweeps internal liquidity (SSS) and taps into a strong 4H demand zone – the same zone that caused the BOS.
This area offers discounted pricing for a potential continuation of the bullish move. If lower-timeframe confirmations appear inside the demand zone, we can expect price to rotate upward and target the imbalance and highs left above.
A value-driven buy: wait for confirmation, then aim for bullish continuation in line with the structural bias.
US30 Trade Set Up Nov 17 2025Price has left a daily FVG that will need to be filled this week but first i want to see a sweep of SSL or PDL followed by internal 1m-5m IFVG/CISD to target BSL

Bull US30We have the HL arround price level 46,952 created from last week correction. So price maintains its bull structure.
But we still have a resistance level around 47,298 . If price breaks through our bullish trade will be activated.
Let's keep an eye on any high impact news.

US30 LongsBias: Bullish continuation, but with caution given proximity to resistance.
Setup: If price breaks cleanly above the resistance zone with momentum (i.e., a strong bullish candle, minimal wick, decent follow-through) then a long entry is justified. Entry could be placed just above the breakout candle high.
Alternative: If price rejects the resistance zone (e.g., bearish pin bar, engulfing candle, then broken trendline) then a short counter-trend trade might be viable — but only for experienced traders with tight risk control, because the broader trend is still up.
Stop-loss: For the long trade, consider placing a stop just below the breakout candle low or below the trendline pivot, whichever is tighter. For the short trade, a stop above the recent swing high/resistance zone.
Target: For the long trade, the next logical target is the next major supply area (perhaps historical highs or measured move from the consolidation). For the short trade, target near the trendline support or prior swing lows.
The chart shows a clear uptrend over the intermediate term, with a series of higher highs and higher lows.
Price has respected key structure zones (off the weekly and daily frames) and is now approaching a significant resistance region.
Volume data is not shown, but the price action suggests momentum has been backing this move (i.e., relatively strong candles, visible follow-through after retests).

US30 - Corrective Drop Completed? Next Push Up AheadUS30 has pulled back sharply and is now forming a corrective structure near the lows.
If the current sub-waves continue to align, the next leg could be an impulsive push upward to complete the broader wave pattern. Short-term fluctuations are expected, but the wave structure as a whole still favours an upward continuation once the correction is fully completed.
Disclosure: We are part of Trade Nation's Influencer program and receive a monthly fee for using their TradingView charts in our analysis.

US30 Trade Set Up Nov 14 2025I am expecting price to continue it bearish trend to sweep lower SSL but first i want to see a slight pullback into 1h FVG before continuing its trend

US30 - Entry Setups (1H Confirmation for Precision)Entry Setups (1H Confirmation for Precision)
Focus on price-action triggers at key levels. Use 1H for entries, 4H for context. All based on structure—no indicators.
Setup 1: Bullish – Buy the Support Bounce (Preferred, High Probability)
Rationale: Aligns with overall bull trend; 47,346.8 has held multiple times on 4H.
Entry Trigger: 1H bullish reversal candle (e.g., hammer or engulfing) at 47,346.8 (±20 points).
Entry Price: 47,350–47,370 (market or limit).
Stop Loss: 47,280 (below level + buffer; risk ~70 points).
Take Profits:
TP1: 47,523.2 (current 1H close) → +173 points.
TP2: 47,624.7 (prior 4H close) → +274 points.
TP3: 48,000 → +650 points.
Risk:Reward: 1:2.5–1:9.
Confluence: Strong volume on bounce; no 1H close below level.
Invalidation: 1H close <47,346.8 → switch to bearish setup.
Setup 2: Bearish – Short the Breakdown (If Triggered)
Rationale: Confirms short-term weakness if 1H/4H breaks support.
Entry Trigger: 1H close below 47,346.8, followed by retest from below (now resistance).
Entry Price: 47,330–47,340 (on retest rejection).
Stop Loss: 47,420 (above retest high; risk ~80 points).
Take Profits:
TP1: 47,000 → +340 points.
TP2: 46,987.3 → +353 points.
TP3: 46,527.3 → +813 points.
Risk:Reward: 1:4+.
Confluence: Increasing volume on drop; bearish 1H candles (e.g., marubozu).
Invalidation: Price reclaims >47,420 with bullish close → exit and flip long.
Follow me for more updates

US30 Trade Secured 1500 PipsPrice inverted a 1h FVG in London session then broke structure to the downside on the 15m, came up to sweep BSL to then target PDL

US30 Trade Set Up Nov 13 2025Price reached ATH yesterday during New York session but has closed under it during Asia and London and left a big daily gap that i am expecting price to target so i will wait for a internal BSL sweep followed by IFVG/CISD to target daily FVG
US30 Trade Set Up Nov 12 2025Price is trading above PDH and has swept ATH so i want to see a pullback to sweep SSL Asia/London lows and/or tap 4h FVG before looking to buy back up

Trading US30 DOW JONES: Bullish Momentum Here's My Trade PlanYesterday in my video 🎥, I mentioned that if US30 broke out to the upside, I'd look to enter long. That’s exactly what happened—big breakout! 🌟 Now, I’m waiting for a pullback 🕰️ to my optimal entry zone and a confirmed market structure shift for another buy opportunity 💵. (Not financial advice) 📝

US30 BULLHI
Simple market structure.
The chart speaks for itself
Quick resume, the market is currently goin through correction for bullish continuation.

US30 Trade Set Up Nov 11 2025Price is consolidating at a strong 4h resistance and has swept PDH already so i want to see either internal SSL sweep to then form internal 1m-5m IFVG/CISD to target higher BSL levels or trade under 1h FVG to push down to 4h FVG

US30 Trade Set Up Nov 10 2025Price has changed state to a bullish trend making HH/HL on the 4h and 1h so i will wait for more internal structure to form and/or a tap into bullish 1h FVG before looking for IFVG/CISD on the 1m-5m to target higher BSL/PDH
US30 Strategy: Waiting for Confirmation Amid Conflicting Trends🔥📉 Currently checking out the US30 (Dow Jones)! On the ⏰ 4-hour chart, the vibe is definitely bearish, but when you zoom out to the 📅 daily chart, things look much more bullish 🚀. For me, this index is at a real crossroads! 👉
🔎 On the 30-minute chart, I’m watching closely for a bullish breakout above the recent high and a key break of structure 🟢📈 — that would spark a potential buy opportunity!
💼 If instead, price slips below the current high and we see a bearish shift in structure 🚩📉, I’m eyeing a possible sell setup!
❗️Of course, this is just my view, not financial advice! 🚫💸

US30 : Bulls Regaining Control!After a clean correction, US30 (Dow Jones) looks set for another push upward. If structure holds, we could see momentum building toward new highs before the next potential pullback. Stay alert for confirmation around 47,400–47,600 levels!
Disclosure: We are part of Trade Nation's Influencer program and receive a monthly fee for using their TradingView charts in our analysis.

US30 Trade Set Up Nov 7 2025Indices remain under bearish pressure so i will only be looking for sells but first i want to see internal BSL or London high BSl swept first followed by 1m-5m IFVG/CISD to take sells down to 4h FVG and lower SSL levels

US30 Risky Short!
HI,Traders !
#US30 is growing now
But a horizontal resistance
Level of 47513.8 from where
We will be expecting a local
Pullback and a local move down !
Comment and subscribe to help us grow !

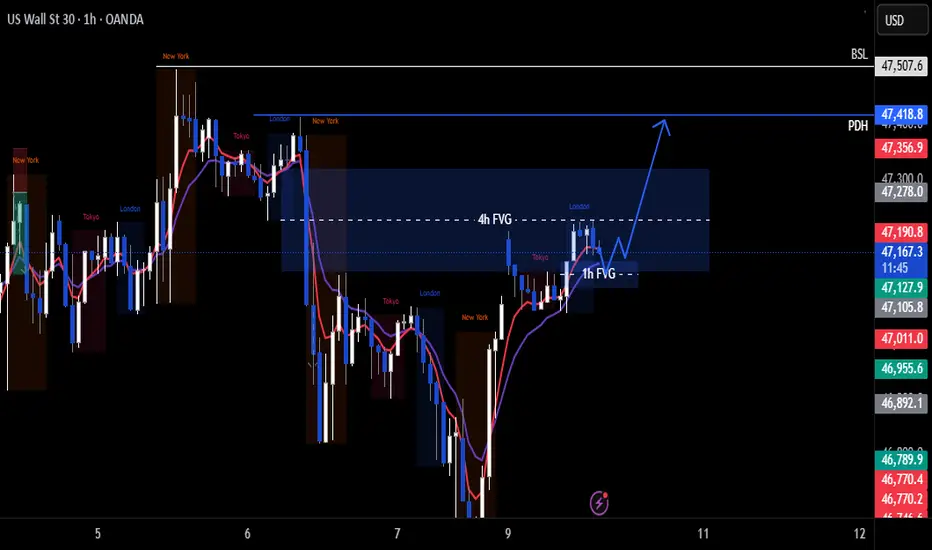
US30 Trade Set Up Nov 6 2025Price is bullish making HH/HL on the 1h and BOS of the Asia range so i will want to see price come to sweep SSL and/or tap into 1h FVG to then make 1m-5m IFVG/CISD to target PDH

US30 – Correction Toward 47100 | Next Leg Up Toward 47920US30 – MARKET OUTLOOK | Bullish Bias Above 47100
US30 is showing a mild bearish correction after facing resistance near 47460, but the broader structure remains bullish while price holds above 47100.
🔼 Above 47460: Bullish continuation toward 47750 → 47920 → 48200.
🔽 Below 47100: Bearish correction possible toward 46920 → 46600.
Pivot: 47430
Support: 47100 · 46920 · 46600
Resistance: 47750 · 47920 · 48200
US30 stays bullish while above 47100, but a confirmed close below this level could trigger a short-term bearish correction toward 46920.

US30 Trade Set Up Nov 5 2025Price is overall still bearish making LH/LL on the 1h and 15m but is consolidating on the 1h and 15m. So to see more sells i would want to see price continue to respect this 4h FVG, sweep BSL/London highs to then form 1m-5m IFVG/CISD to target SSL/Asia lows and even PDL
