Us30 Trade Secured 1500 Pipstrade played out perfectly, made LH/LL on the 15m, closed under daily BSL so i knew the target had to the daily FVG as imbalance. Waited for BSL to be taken with a BOS in the 15m to push down
Us30analysis

Us30 Trade Set Up Oct 22 2025Price swept a daily BSL and closed under it and has left a lot of SSL plus a daily gap below so i will want to see a sweep of internal BSL followed by a CISD on the 1m-5m to target PDL and 50% of the daily gap

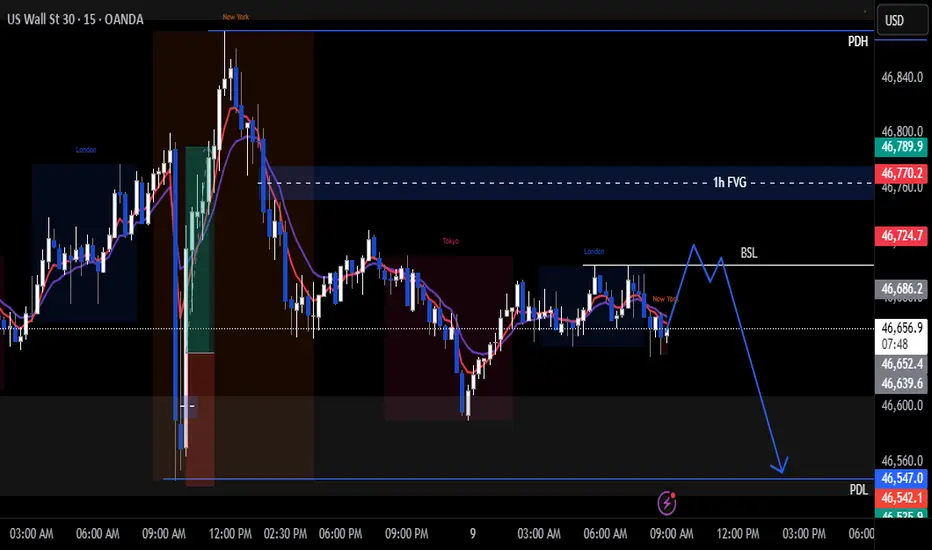
Us30 Trade Set Up Oct 21 2025Daily BSL have been swept and price is at a strong 4h resistance so if price sweeps PDL and closes under i will look for bearish structure on the 1m/5m forming IFVG/CISD to take sells to SSL or 50% of the 4h FVG but if price comes for SSL/London lows first i will look for short term buys to PDH

U30 Trade Set Up Oct 20 2025I want to see price sweep BSL/London highs to then look for internal bearish structure on the 1m-5m to take sells to internal SSL

DOW JONES INDUSTRIAL HIGH PROBABILITY SETUP SOON!!!🚨 DJ30 HIGH PROBABILITY SELL SETUP 🚨
* Here We Can See Clearly The Next Potential Move For US30 Coming Hours/Days.
* Keep Your Eyes Close On Your Trading Positions.
* Happy PIP Hunting Traders.
FXKILLA.

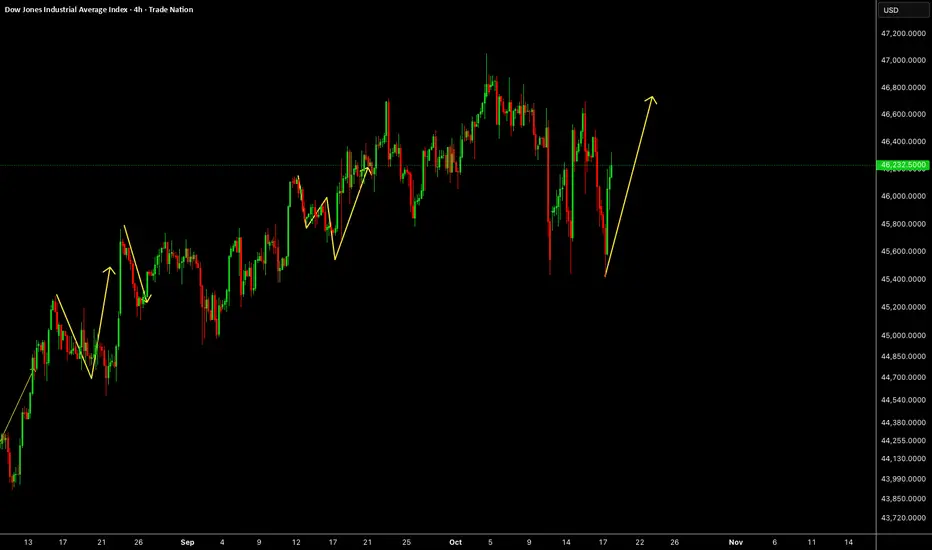
US30US30 still have some upside, correction and one more push up is possible in this week.
Disclosure: We are part of Trade Nation's Influencer program and receive a monthly fee for using their TradingView charts in our analysis.
Us30 Trade Set Up Oct 17 2025Im overall still bearish so if we get a BOS of the 15m high i will expect price to target 4h FVG before continuing down to SSL levels or i would want to see price close under 15m swing low to then continue down

Us30 Trade Set Up Oct 16 2025Price is trading in between PDH/PDL and has filled a 4h and 1h bearish FVG so for sells id want to see London highs/BSL swept but closed under followed by internal 1m bearish structure to take sells to Asia lows/SSL or PDL but for buys id want to see Asia lows/SSl swept first to then look for bullish structure on the 1m to catch buys to PDH

US30 Trade Plan – Range Breakout + Smart Money ManipulationI’m currently watching the US30 (Dow Jones Index) 🏦. On the 4-hour timeframe, we can see a strong uptrend forming — higher highs and higher lows 📈. Whether this trend continues remains to be seen, but having a solid trading plan is key ✅.
Here’s mine: On the 30-minute timeframe, price is currently moving within a defined range. If we see a break above the range, followed by a retracement and failed retest of the range high, I’ll be looking for a long opportunity 🚀.
If price instead breaks below the range, there could also be a short opportunity, though my preference is to stay long given the higher-timeframe bullish structure ⚙️.
⚠️ Keep an eye out for market manipulation — smart money algorithms often trigger fake breakouts to draw in buyers before sweeping liquidity and continuing the move. Stay alert and manage risk carefully.
📉 Disclaimer: This content is for educational purposes only and not financial advice.

US30 Short From Resistance!
HI,Traders !
#US30 went up sharply
But the price will soon hit
A wide horizontal resistance
Of 46641.8 from where we will
Be expecting a pullback and
A local move down !
Comment and subscribe to help us grow !

Us30 Trade Set Up Oct 15 2025Price has swept PDH and has formed a bullish 4h FVG which i am expecting price to come to 50% of it before continuing higher

Can Dow Jones Maintain Bullish Momentum? Analysis🎯 US30 Dow Jones: The Great Heist Setup! 🏦💰
📊 Asset Overview
US30 (Dow Jones Industrial Average) - CFD Index
Trade Type: Swing/Day Trade
Bias: BULLISH 🐂
🔍 The Master Plan: Double Moving Average Confirmation
We're hunting for a pullback retest at two critical moving averages acting as dynamic support:
✅ Simple Moving Average (SMA) alignment
✅ Kijun-Sen (Ichimoku baseline) confluence
This double confirmation gives us the green light to ride the bullish trend with institutional-level precision. Think of it as the market leaving the vault door slightly open... 🚪💎
🎯 Entry Strategy: The "Thief Layering" Method
Primary Approach: Multiple Buy Limit Orders (Layering Strategy)
Recommended Layer Entry Zones:
🟢 Layer 1: 46,000
🟢 Layer 2: 46,200
🟢 Layer 3: 46,400
💡 Pro Tip: You can add more layers based on your risk appetite and position sizing. This strategy allows you to average into the position as price pulls back to support—like catching falling diamonds! 💎
Alternative: Market execution at any pullback to the moving average confluence zone.
🛡️ Risk Management
Stop Loss: 45,600
⚠️ Important: This is MY stop loss level based on technical invalidation. You're the captain of your own ship—adjust according to YOUR risk tolerance and account size. Trade at your own risk!
🎯 Target Zone: The Police Barricade
Take Profit Target: 47,600 🚨
This level represents:
🚧 Strong resistance zone (the "Police Barricade")
📈 Potential overbought conditions
Bull trap territory
Strategy: Scale out or secure profits as we approach this level. Remember: realized profits are better than paper gains!
⚠️ Reminder: This is MY take profit target. Your exit strategy should align with your trading plan and risk management rules. Lock in profits when YOU'RE comfortable!
🌐 Correlated Assets to Watch
Keep an eye on these related instruments for confluence:
SP:SPX (S&P 500): Broad market sentiment indicator—if SPX shows strength, US30 typically follows
SEED_ALEXDRAYM_SHORTINTEREST2:NQ (Nasdaq 100): Tech-heavy index correlation—risk-on appetite confirmation
TVC:DXY (US Dollar Index): Inverse correlation—weaker dollar often supports equity indices
TVC:TNX (10-Year Treasury Yield): Rate sensitivity—lower yields can fuel equity rallies
TVC:VIX (Volatility Index): Fear gauge—declining VIX supports bullish setups
Key Correlation Note: When these indices move in harmony with declining dollar strength, it strengthens the bullish case for US30. Watch for synchronized moves!
📝 Technical Summary
Trend: Bullish structure intact
Confirmation: Dual moving average support
Risk/Reward: Favorable with 400-1,600 point profit potential (depending on entry layer)
Time Frame: Swing to day trade duration
Strategy Style: "Thief layering" - accumulate on pullbacks
✨ If you find value in my analysis, a 👍 and 🚀 boost is much appreciated — it helps me share more setups with the community!
⚠️ Disclaimer
This "Thief Style" trading strategy is shared for educational and entertainment purposes only. This is NOT financial advice. Trading involves substantial risk of loss. Always conduct your own analysis, manage your risk appropriately, and never trade with money you cannot afford to lose. Past performance does not guarantee future results. You are solely responsible for your trading decisions.
#US30 #DowJones #SwingTrading #DayTrading #TechnicalAnalysis #MovingAverages #LayeringStrategy #IndexTrading #BullishSetup #TradingStrategy #CFDTrading #PriceAction #SupportAndResistance #TradingIdeas #MarketAnalysis #ThiefStyle

Us30 Trade Set Up Oct 14 2025Price has swept both PDH and PDL and has formed a bearish 4h FVG, so i will be trading with the bearish trend looking for sells after London highs get swept as liquidity and look for a 1m IFVG/CISD to target swing lows

Us30 Trade Set Up Oct 13 2025Overall price is still bearish but today i can see price sweeping SSL, touching 50% of the 1h Gap and targeting the 4h FVG before continuing its bearish trend

US 30 POETENTIAL BULLISH RUNAfter setting a strong low on Friday, Dow Jones Industrial Average is likely to correct close to the rejection thus cueing for long entries. be on the lookout for those buys at around 45300. Buy stops at the current weekly high.

Us30US30 have had a drop last week due to tariff news, if we don't open with the gap then we will push up otherwise further drop can happen.
Disclosure: We are part of Trade Nation's Influencer program and receive a monthly fee for using their TradingView charts in our analysis.

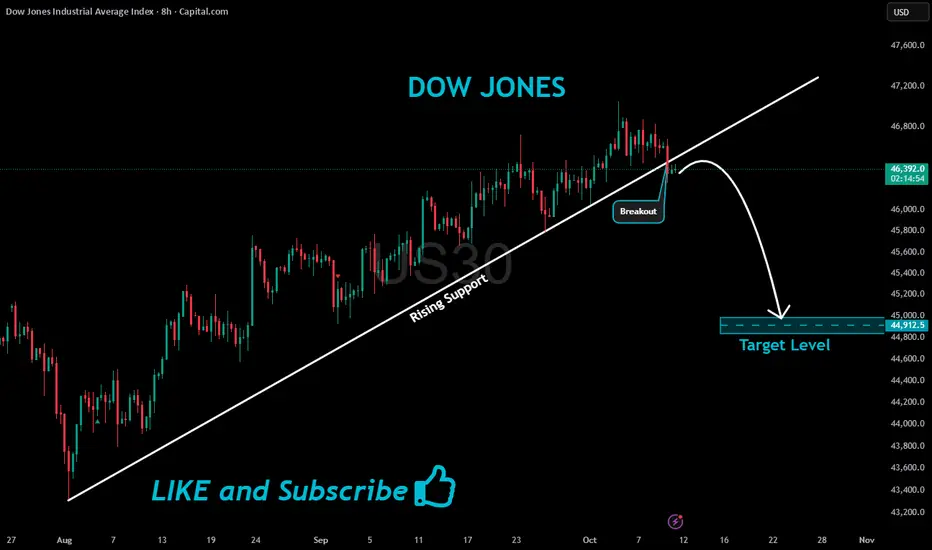
US30 Bearish Breakout!
HI,Traders !
#US30 made a bearish
Breakout of the rising support
Line and we are bearish biased
So we will be expecting a
Further bearish move down !
Comment and subscribe to help us grow !
Us30 Trade Set Up Oct 10 2025Price pushed down hard yesterday confirming bearish structure and creating a 4h FVG and 1h FVG which i want to see price trade into, respect them and form internal 1m IFVG/CISD to target PDL
www.tradingview.com

Us30 Trade Set Up Secured 1500 Pips!Set Up played out perfectly with BSL being swept, CISD on the 1m and 5m to target PDL
cant get any cleaner then that

Us30 Trade Set Up Oct 9 2025overall i am bearish so i will be looking for sells after BSL/London highs get swept or the 1h FVG gets tapped to target PDL
www.tradingview.com
Us30 Trade Set Up Oct 8 2025Price is trading between PDH/PDL so i will either want to see a run up to PDH to sweep it and look for internal bearish structure to sell or a sweep of SSL first to then go higher to PDH
www.tradingview.com

Us30 Trade Set Up Oct 7 2025Price is approaching a 4h FVG, if price respects it i will take sells to SSL but if price trades through it i will wait for PDH to be swept before looking for sells
www.tradingview.com

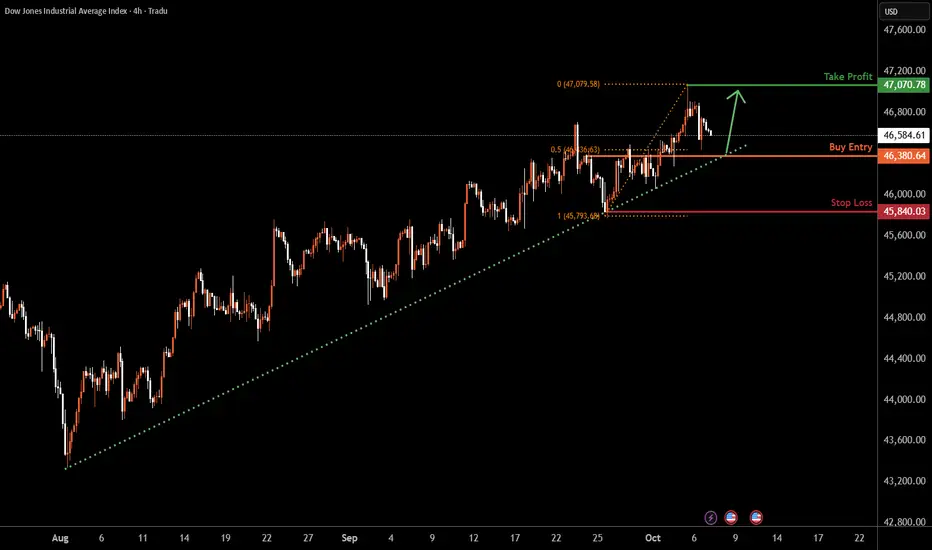
US30 H4 | Continuation Of Bullish MomentumBased on the H4 chart analysis, we could see the price fall to the buy entry at 46,380.64, whichis a pullback support that aligns with the 50% Fibonacci retracement and could bounce from this level to the upside.
Stop loss is at 45,840.03, which is a pullback support.
Tak eporfit is at 47,070.78, which is a swing high resistance.
High Risk Investment Warning
Trading Forex/CFDs on margin carries a high level of risk and may not be suitable for all investors. Leverage can work against you.
Stratos Markets Limited (tradu.com ):
CFDs are complex instruments and come with a high risk of losing money rapidly due to leverage. 65% of retail investor accounts lose money when trading CFDs with this provider. You should consider whether you understand how CFDs work and whether you can afford to take the high risk of losing your money.
Stratos Europe Ltd (tradu.com ):
CFDs are complex instruments and come with a high risk of losing money rapidly due to leverage. 66% of retail investor accounts lose money when trading CFDs with this provider. You should consider whether you understand how CFDs work and whether you can afford to take the high risk of losing your money.
Stratos Global LLC (tradu.com ):
Losses can exceed deposits.
Please be advised that the information presented on TradingView is provided to Tradu (‘Company’, ‘we’) by a third-party provider (‘TFA Global Pte Ltd’). Please be reminded that you are solely responsible for the trading decisions on your account. There is a very high degree of risk involved in trading. Any information and/or content is intended entirely for research, educational and informational purposes only and does not constitute investment or consultation advice or investment strategy. The information is not tailored to the investment needs of any specific person and therefore does not involve a consideration of any of the investment objectives, financial situation or needs of any viewer that may receive it. Kindly also note that past performance is not a reliable indicator of future results. Actual results may differ materially from those anticipated in forward-looking or past performance statements. We assume no liability as to the accuracy or completeness of any of the information and/or content provided herein and the Company cannot be held responsible for any omission, mistake nor for any loss or damage including without limitation to any loss of profit which may arise from reliance on any information supplied by TFA Global Pte Ltd.
The speaker(s) is neither an employee, agent nor representative of Tradu and is therefore acting independently. The opinions given are their own, constitute general market commentary, and do not constitute the opinion or advice of Tradu or any form of personal or investment advice. Tradu neither endorses nor guarantees offerings of third-party speakers, nor is Tradu responsible for the content, veracity or opinions of third-party speakers, presenters or participants.