Dow Jones US30 Analysis: Bullish Trend, Trade Plan📊 The US30 (Dow Jones) remains in a strong bullish trend, showing a clear sequence of higher highs and higher lows on the 4-hour chart 📈. However, when viewed on the daily timeframe, price now appears somewhat overextended ⚠️.
🔎 Dropping down to the lower timeframes and applying the Anchored VWAP (AVWAP) indicator, it’s evident that price is trading well above VWAP, signaling a premium zone. The risk here is that traders may continue buying into strength without acknowledging that price could easily retrace back into VWAP.
💡 Remember — smart money buys at a discount, not at a premium. In bullish trends like this, patience is crucial.
📹 In the video, I outline my trade plan, which focuses on waiting for a healthy pullback and then looking for a bullish setup if the structure aligns in our favor. I’m not interested in chasing price when it’s this extended — instead, I prefer to wait for the retracement and enter at better value, reducing risk and improving trade quality 🎯.
⚠️ Disclaimer: This analysis is for educational purposes only and not financial advice. Always trade responsibly and manage risk carefully.
Us30analysis

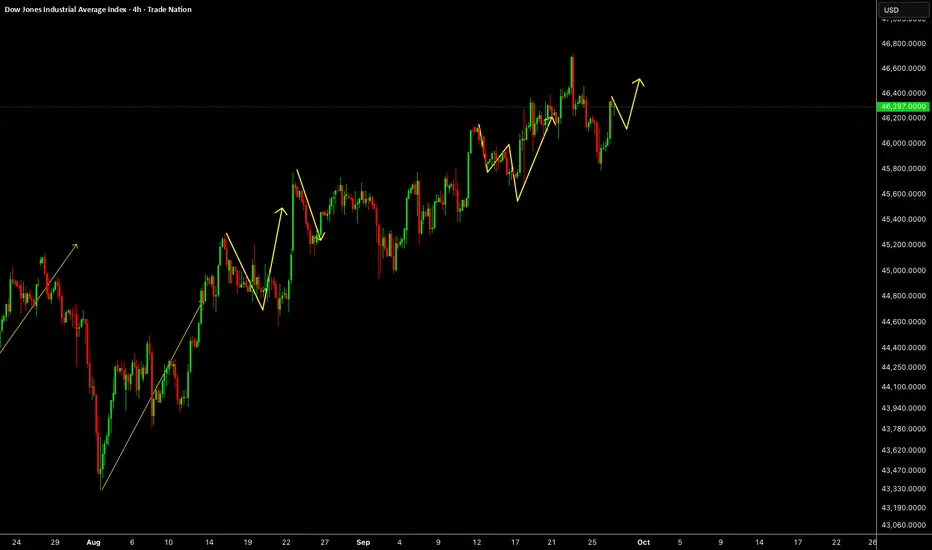
US30US30 needs some more correction before pushing up.
Disclosure: We are part of Trade Nation's Influencer program and receive a monthly fee for using their TradingView charts in our analysis.
Dow Jones Bulls Preparing Another Robbery — Are You In?🚨💰 US30/DJ30 Index CFD Market Heist Plan 🏦🎭
🕵️ Dear Thief OG’s, Ladies & Gentlemen of the robbery squad… the vault is wide open again! This time we’re sneaking into the Dow Jones (US30) for a Bullish Day/Swing Heist. 🔥
🎯 Robbery Blueprint
Asset: US30/DJ30 Index CFD (Day/Swing Trade)
Plan: Bullish 📈
Entry (Thief Style):
The thief never knocks once… we layer the doors! Multiple buy limit orders 🔐:
Layer 1 → 45,600.0
Layer 2 → 45,400.0
Layer 3 → 45,200.0
(You can expand the layers depending on your risk appetite 🕳️)
Stop Loss (SL) 🛑:
📍 Thief SL @ 44,600.0
(Adjust based on your own risk & startergy – remember, survival is key in every robbery 🏃💨)
Target (TP) 🎯:
🚓 Police barricade spotted @47,000.0! Our sweet escape is planned at 46,800.0 before sirens catch us. 💰
🏆 Thief Strategy
Multiple limit order entries (layering method / scaling in).
Enter at any price level if you’re fast, but layering is the OG Thief move.
Manage your SL & risk like a pro robber – no reckless moves, or you’ll end up behind market bars! 🚔
💡 Why This Heist? 💡
The US30/DJ30 is primed for a bullish run 📈, driven by real-time market signals:
Technical Analysis: Strong support levels holding firm, momentum indicators screaming bullish! 📊
Fundamental Outlook: Check global market data, COT reports, and sentiment analysis for confirmation. 🔗👉
Volatility Watch: Stay sharp for news releases that could spike volatility. 📰⚠️
⚠️ Thief’s Risk Management ⚠️
News Alert: Avoid new trades during major news drops to dodge wild price swings. 🚫
Position Management: Use trailing stops to lock in those sweet profits. 🔐
Risk Control: Adjust lot sizes and SL based on your layered entries and risk profile. 📉
🏆 Join the Heist! 🏆
💥 Hit the Boost Button 💥 to power up our Thief Trader crew! 🚀 Let’s make bank with ease using the Thief Trading Style! 💸😎 Stay tuned for the next heist plan, and let’s keep robbing the markets! 🤑🐱👤
Us30 Trade Set Up Oct 3 2025Price is trading above PDH so still bullish. If this 4h FVG gets respected and SSL gets swept i will look for buys to BSL/ATH but price has changed state on the 15m and 1h so i price comes to retest the 15m CISD and respects it i will look for IFVG on the 1m to take to lower SSL
www.tradingview.com

Us30 Trade Set Up Oct 2 2025Price is overall bullish making HH/HL and has created a 4h FVG so i want to see price first sweep SSL/London lows, tap into 4h FVG to then look for 1m IFVG/CISD to target PDH
www.tradingview.com

Us30 Trade Set Up Oct 1 2025price swept PDL and flew up so i will wait to see a sweep of 15m SSL followed by 1m IFVG/CISD to target PDH or a sweep of BSL/Asia highs followed by a pullback into internal FVG to then go higher
www.tradingview.com

Us30 Trade Set Up Sep 30 2025Price is making HH/HL now so structure is bullish. I will want to see a close above the 15m FVG for price to go higher into the 4h FVG and higher to PDH
www.tradingview.com

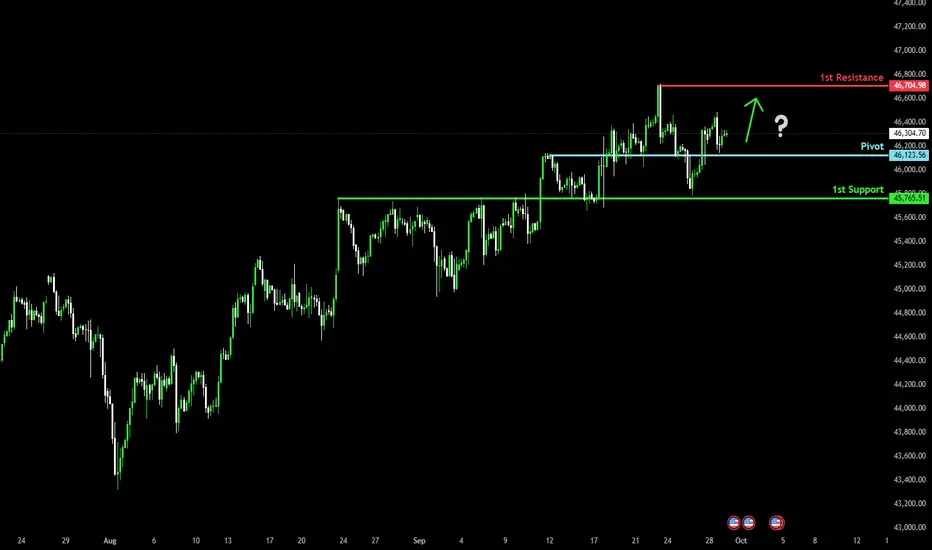
Bullish momentum to extend?Dow Jones (US30) has bounced off the pivot which has been identified as an overlap support and could bounce to the 1st resistance which is a swing high resistance.
Pivot: 46,123.56
1st Support: 45,765.51
1st Resistance: 56,704.98
Disclaimer:
The above opinions given constitute general market commentary, and do not constitute the opinion or advice of IC Markets or any form of personal or investment advice.
Any opinions, news, research, analyses, prices, other information, or links to third-party sites contained on this website are provided on an "as-is" basis, are intended only to be informative, is not an advice nor a recommendation, nor research, or a record of our trading prices, or an offer of, or solicitation for a transaction in any financial instrument and thus should not be treated as such. The information provided does not involve any specific investment objectives, financial situation and needs of any specific person who may receive it. Please be aware, that past performance is not a reliable indicator of future performance and/or results. Past Performance or Forward-looking scenarios based upon the reasonable beliefs of the third-party provider are not a guarantee of future performance. Actual results may differ materially from those anticipated in forward-looking or past performance statements. IC Markets makes no representation or warranty and assumes no liability as to the accuracy or completeness of the information provided, nor any loss arising from any investment based on a recommendation, forecast or any information supplied by any third-party.
Us30 Trade Set Up Sep 29 2025Price is now bullish creating HH/HL and closed above PDH so i will look for internal SSL to be swept then a 1m IFVG/CISD retest to price higher towards BSL
www.tradingview.com

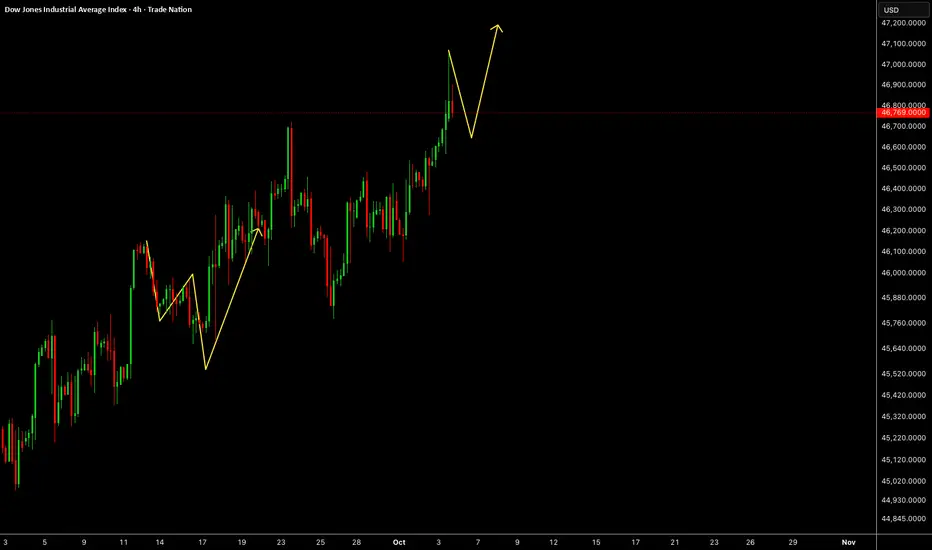
US30US30 needs some correction and one more push up to take ATH.
Disclosure: We are part of Trade Nation's Influencer program and receive a monthly fee for using their TradingView charts in our analysis.
US30 Resistance Cluster Above!
HI,Traders !
#US30 made a bearish
Breakout of the support
Cluster of the rising and
Horizontal support levels
Which is now a resistance
Cluster round 46329.8 then
Went down and made a local
Pullback on Thursday and
Friday but we are bearish
Biased mid-term so we
Will be expecting a further
Bearish move down this week !
Comment and subscribe to help us grow !

Us30 Trade Set Up Sep 26 2025Price pushed up from the daily FVG yesterday and has formed a 4h bearish FVG which acts has imbalance to be filled to if price continues to make internal bullish structure i will look for buys to target 50% of the 4h FVG/PDH
www.tradingview.com

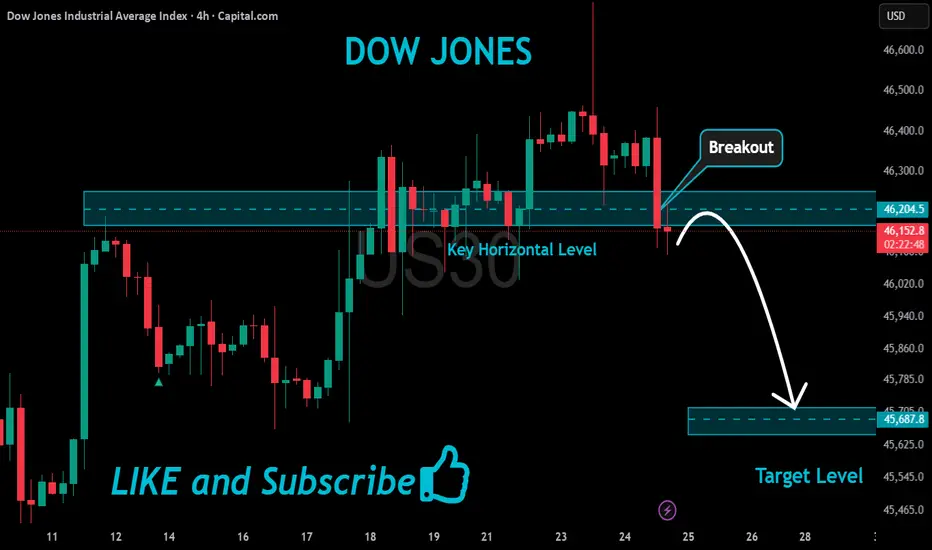
US30 Bearish Breakout!
HI,Traders !
#US30 made a bearish
Breakout of the key horizontal
Level of 46203.3 which is now
A resistance and the breakout
Is confirmed so we are bearish
Biased and we will be expecting
A further move down !
Comment and subscribe to help us grow !
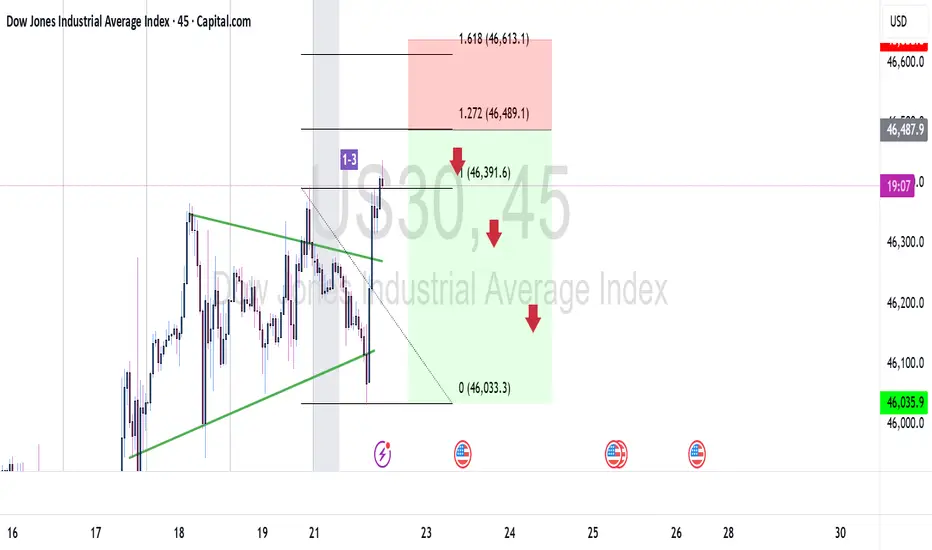
US30 H4 | Bearish drop offBased on the H4 chart analysis, we could see the price rise to the sell entry at 46,338.64, which is a pullback resistance that aligns with the 50% Fibonacci retracement and could drop from this level to the take profit.
Stop loss is at 46,676.09, which is a swing high resistance.
Take profit is at 45,762.38, which has been identified as an overlap support that lines up with the 50% Fibonacci retracement.
High Risk Investment Warning
Trading Forex/CFDs on margin carries a high level of risk and may not be suitable for all investors. Leverage can work against you.
Stratos Markets Limited (tradu.com ):
CFDs are complex instruments and come with a high risk of losing money rapidly due to leverage. 65% of retail investor accounts lose money when trading CFDs with this provider. You should consider whether you understand how CFDs work and whether you can afford to take the high risk of losing your money.
Stratos Europe Ltd (tradu.com ):
CFDs are complex instruments and come with a high risk of losing money rapidly due to leverage. 66% of retail investor accounts lose money when trading CFDs with this provider. You should consider whether you understand how CFDs work and whether you can afford to take the high risk of losing your money.
Stratos Global LLC (tradu.com ):
Losses can exceed deposits.
Please be advised that the information presented on TradingView is provided to Tradu (‘Company’, ‘we’) by a third-party provider (‘TFA Global Pte Ltd’). Please be reminded that you are solely responsible for the trading decisions on your account. There is a very high degree of risk involved in trading. Any information and/or content is intended entirely for research, educational and informational purposes only and does not constitute investment or consultation advice or investment strategy. The information is not tailored to the investment needs of any specific person and therefore does not involve a consideration of any of the investment objectives, financial situation or needs of any viewer that may receive it. Kindly also note that past performance is not a reliable indicator of future results. Actual results may differ materially from those anticipated in forward-looking or past performance statements. We assume no liability as to the accuracy or completeness of any of the information and/or content provided herein and the Company cannot be held responsible for any omission, mistake nor for any loss or damage including without limitation to any loss of profit which may arise from reliance on any information supplied by TFA Global Pte Ltd.
The speaker(s) is neither an employee, agent nor representative of Tradu and is therefore acting independently. The opinions given are their own, constitute general market commentary, and do not constitute the opinion or advice of Tradu or any form of personal or investment advice. Tradu neither endorses nor guarantees offerings of third-party speakers, nor is Tradu responsible for the content, veracity or opinions of third-party speakers, presenters or participants.

Bullish continuation?Dow Jones (US30) is reacting off the pivot which acts as an overlap support and could bounce to the 1st resistance which has been identified as a swing high resistance.
Pivot: 46,123.56
1st Support: 45,765.51
1st Resistance: 46,704.98
Disclaimer:
The above opinions given constitute general market commentary, and do not constitute the opinion or advice of IC Markets or any form of personal or investment advice.
Any opinions, news, research, analyses, prices, other information, or links to third-party sites contained on this website are provided on an "as-is" basis, are intended only to be informative, is not an advice nor a recommendation, nor research, or a record of our trading prices, or an offer of, or solicitation for a transaction in any financial instrument and thus should not be treated as such. The information provided does not involve any specific investment objectives, financial situation and needs of any specific person who may receive it. Please be aware, that past performance is not a reliable indicator of future performance and/or results. Past Performance or Forward-looking scenarios based upon the reasonable beliefs of the third-party provider are not a guarantee of future performance. Actual results may differ materially from those anticipated in forward-looking or past performance statements. IC Markets makes no representation or warranty and assumes no liability as to the accuracy or completeness of the information provided, nor any loss arising from any investment based on a recommendation, forecast or any information supplied by any third-party.

Can You Escape the US30 High Voltage Trap in Time?💎 US30/DJ30 High Voltage Bullish Heist Plan 💎
💰 Asset: US30 / DJ30 Index CFD
🚀 Plan: Bullish — Thief OG Layered Buy Attack 🏴☠️
📍 Entry: Any price level — we’re layering in with the Bull Grid Strategy like a true market bandit.
🎯 Layered Buy Limits:
44,900 💵
44,700 💵
44,400 🔥
(💡 You can add more layers — the more vault doors you crack, the more loot you grab!)
🛑 Stop Loss: Thief SL @ 44,000 🛑 — adjust to your own risk appetite & strategy, ladies & gentlemen of the Thief OG Crew.
💎 Target: 46,300 🎯 — ⚡ high-voltage electric trap ahead! Escape with the stolen money at 46,200 before the market guards catch you.
🏴☠️ The Heist Blueprint 🏴☠️
We’re hitting US30 with multi-layer entries, scooping up the dip zones like professional vault breakers. The bull gang is in control — momentum, sentiment, and greed all lining up for a payday.
Rules of Engagement:
Use multiple buy limit layers — stack ‘em like gold bars.
Stick to longs only — don’t rob against the tide.
Place alerts at each limit level — no sleeping during the heist.
Use trailing SL to secure stolen profits while the robbery’s still in progress.
📊 Why Bullish?
US30 showing strong momentum fueled by market optimism, earnings strength, and liquidity flooding in. Macro vibes = bullish; sentiment = greedy. Bears? Scattered and broke.
⚠️ Risk & News Alert:
Avoid entry during high-volatility news drops — even thieves hate unpredictable explosions.
Manage positions like a pro — protect the stash.
💖 If this heist plan makes you richer or braver, hit that BOOST and join the Thief Trader Army. Every boost powers our next robbery.
🏆 We steal from the market, not from people.
See you at the vault door, Thief OGs. 🏴☠️💰🚀

Us30 Trade Set Up Sep 24 2025price pushed down hard yesterday but still made a HL on the 1h also created a 1h FVG so i will want to see a test of that, if it respects it i will look for internal 1m bearish structure to look for sells but if it trades through it i will look for buys to PDH
www.tradingview.com

Us30 Trade Set Up Sep 23 2025Price swept PDH in London session and formed a SSL at Asia lows so if price sweeps it and closes above i will look for 1m IFVG and CISD to take higher but if price closes under i will look for sells to test 1h FVG

"Trade setup on US30 for a weekly sell"We have a market with a bullish accumulation that has been attracting buyers with an upward sentiment. What I’m looking for is a downward manipulation to shake buyers out of this accumulation, as you can see in this flag. It’s an accumulation that is breaking through highs, and banks usually look to break liquidity zones in order to generate their sales. In addition, the price needs to find stability since it has been rising too much. I see this sell opportunity as possible with this trading pattern I look for: problem, reaction, and solution.
Us30 1500 Pips Securedwww.tradingview.com
price swept SSL/PDL, created 1m IFVG and CISD, retested CISD, targeted BSL to secure 1500 pips!

Us30 Trade Set Up Sep 22 www.tradingview.com
price is making LH/LL so overall it is bearish but it is approaching PDL so if price sweeps it and closes above i will look for a reversal IFVG on the 1m-2m to target the 4h FVG before looking for sells back down

US30US30 needs a small drop and another push up towards 46.5K level.
Disclosure: We are part of Trade Nation's Influencer program and receive a monthly fee for using their TradingView charts in our analysis.

Us30 Trade Set Up Sep 18 2025www.tradingview.com
Price has swept PDH and pushed down hard inverting 1h FVGs and creating a bearish 1h FVH so if price continues to make internal bearish structure i will look for sells down to PDH
