US30 Clear Breakout Done , 300 Pips Ready To Take !Here is my 4H Chart on US30 , We Have A Clear Breakout and the price closed above my old res and new support after more than 4 weeks the price respect the res and touch it and move to downside but for the first time the price closed above it with Daily And Weekly Candle and that prove it`s a real breakout and we have a very good bullish Price Action on 4H /Daily And Weekly T.F Also , the price will try to retest the area and if it give us a good bullish price action on smaller time frames we can enter a buy trade and we can targeting from 200 to 400 pips , if we have a daily closure again below my new res then this idea will not be valid anymore .
Entry Reasons :
1- Clear Daily & Weekly Breakout .
2- Many T.F Confirmations .
3- Perfect Price Action .
4- Clear Bullish P.A .
Us30buy

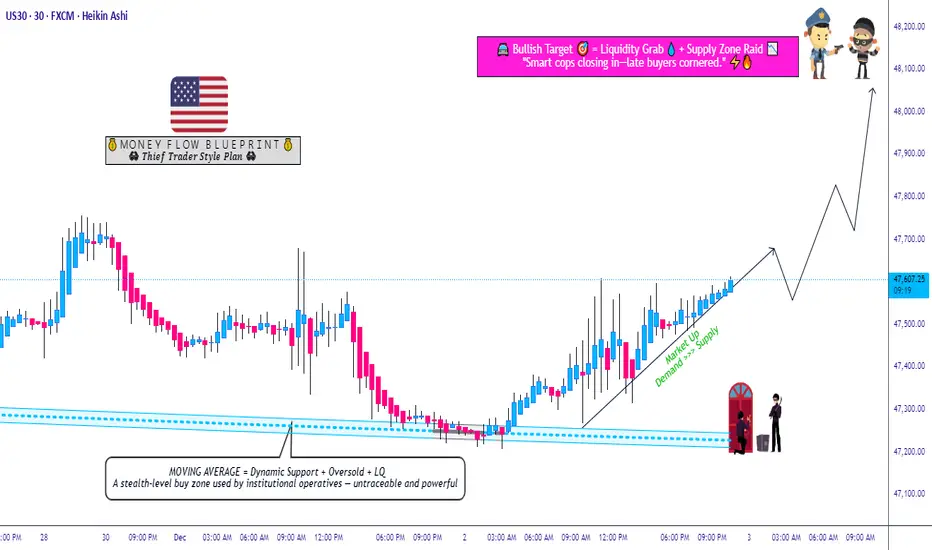
US30 Bullish Plan! Layered Entries + Clean Targets Mapped🔥 DOW JONES (US30) BULLISH PULLBACK - THIEF STRATEGY LAYER ENTRY! 🔥
📈 Asset: CAPITALCOM:US30 (Dow Jones Industrial Average CFD)
🎯 Bias: BULLISH - Strong Uptrend, MA Pullback Play
⏰ Timeframe: Day Trade / Swing
🛡️ Strategy: "THIEF LAYERING" - Multi-Level Limit Order Entry for Optimal Risk/Entry
📋 TRADE PLAN: THIEF'S LAYERED BULLISH PULLBACK
✅ CONDITION:
Bullish structure intact ✅
Price pulling back towards key Moving Average support ✅
This is a "Buy the Dip" setup for continuation.
🎯 ENTRY STRATEGY (THIEF LAYER METHOD):
Use MULTIPLE BUY LIMIT ORDERS to scale into the trade.
Suggested Layers (Adjust based on your capital):
➡️ Layer 1: 47,300
➡️ Layer 2: 47,400
➡️ Layer 3: 47,500
You can increase or decrease layers based on your own analysis.
⛔ STOP LOSS (THIEF OG's NOTE):
Initial SL: 47,200 (below key structure)
⚠️ IMPORTANT: Adjust your SL based on YOUR OWN RISK & STRATEGY. I am not responsible for your SL. Trade at your own risk.
🎯 TAKE PROFIT (ESCAPE THE POLICE BARRICADE!):
Primary Target: 48,100
This zone acts as strong resistance + overbought + potential trap.
Escape with profits before the "police" (sellers) arrive!
⚠️ NOTE: You can take partial profits earlier. This is YOUR choice - manage your own trade!
📊 RELATED PAIRS TO WATCH:
TVC:DXY (US Dollar Index): ⚠️ INVERSE CORRELATION
Strong TVC:DXY = Pressure on CAPITALCOM:US30 (typically).
Watch for DXY weakness to confirm bullish CAPITALCOM:US30 momentum.
SP:SPX (S&P 500) / NASDAQ:NDX (Nasdaq 100): ✅ POSITIVE CORRELATION
If SPX/NDX are strong, likely supports CAPITALCOM:US30 rally.
Weakness here may limit CAPITALCOM:US30 upside.
TVC:VIX (Volatility Index): ⚠️ FEAR GAUGE
Rising TVC:VIX = Risk-off mood, may cap equity gains.
Stable/Low TVC:VIX supports bullish move.
EUR/USD & GBP/USD: ⚠️ DOLLAR SENSITIVITY
USD pairs can signal broad USD strength/weakness, impacting PURPLETRADING:US30.
📌 KEY NOTES FOR THIEF OG's:
This is a LAYERED ENTRY strategy - patience is key.
Adjust ALL levels based on your account size & risk tolerance.
Watch related markets for confirmation or warning signs.
YOU are responsible for your trades - manage them actively!
👍 LIKE & FOLLOW if you find this useful!
🔔 TURN ON NOTIFICATIONS for more THIEF STRATEGY setups!
💬 COMMENT below with your adjustments or questions!
#TradingView #US30 #DowJones #TradingStrategy #DayTrade #Bullish #Pullback #StockMarket #TradingIdeas #CFD #IndexTrading #ThiefStrategy #LayerTrading
us30 buy ideaWe are looking at the US30 chart on the H4 timeframe for a buy setup. The current area where the market is trading (47270.1 – 47118.2), as soon as this zone breaks to the downside, there is a demand flip zone below (46586.5 – 46328.4). When the market comes down to this zone, we will move to the M15 timeframe and look for a buy signal from the refined zone on the M15 timeframe, and then we will take a buy trade.

DOW JONES INDUSTRIAL HIGH PROBABILITY SETUP SOON!!!🚨 DOW30 HIGH PROBABILITY BUY SETUP 🚨
* Here We Can See Clearly The Next Potential Moves For US30 Coming Hours/Days.
* Keep Your Eyes Close On Your Trading Positions.
* Happy PIP Hunting Traders.
FXKILLA.

DOW JONES HIGH PROBABILITY SETUPS SOON!!!🚨 DOW30 HIGH PROBABILITY SELL/BUY SETUP 🚨
* Here We Can See Clearly The Next Potential Moves For US30 Coming Hours/Days.
* Keep Your Eyes Close On Your Trading Positions.
* Happy PIP Hunting Traders.
FXKILLA.

US30 Long Opportunity US30 has been on a bullish tear recent and after the speech by Powell, the market has turned on the bullish momentum to the max. the market is currently on an impulse to the the upside and has created new highs.
Price has broken the $45000 pivot level and continues to trade above the 21, 50 and 200 SMA and in the bullish region of the RSI, currently sitting in the overextended levels at 80.
it is clear the market is in need of a deep retracement to collect liquidity and i will be target the $45000-$5250 zone for a potential zone opportunity. Waiting to see how price reacts to the level and will ride the wave pass the $445652 mark.

US30 Long Position US30 has broken passed the major resistance level at $45000 finally and is currently priced at $45200. The Bullish trend from the past week has created strong bullish confluences with price trading above the 21 and 50 day Moving Averages and in the bullish region of the RSI, expecting further upside potential.
With the break of the $45000 barrier, we can expect price to retrace and test this point sometime in the future and with that see a bounce from this level with the resistance turning support.
Will also be looking at other keys levels such as $44980 and $44730 should price have a deep retracement before the bullish trend resumes.

US30 Bullish Bias!
HI,Traders !
#US30 went down and
Retested a horizontal
Support of 43775.2 from
Where we are seeing a
Bullish rebound so as we
Are bullish biased and we
Will be expecting a further
Bullish move up !
Comment and subscribe to help us grow !

US30 Scalp Buy SetupIf upside liquidation taken first before the entry is achieved then don't take the entry, wait for the entry and set tp & relax.

US30 Long OpportunityUS30 had a break out to the upside from $42560 and we are not seeing a potentially retracement to the break and retest level where we can expect a further jump to the upside. Seeing bullish structure on the 15 min and higher timeframes with confluence at the breakout.
Price is currently above the 50 SMA on all timeframes above the 15min and momentum is bullish per the RSI trading above the 55 level, adding to the bullish confluence
Looking to the ride the bullish wave from $42560 to $42920 where currently resistance level is sitting

US30 potential long setupsMulti-Timeframe Market Analysis — Bullish Continuation Potential
3-Month Timeframe
• October 2023: Price broke all-time highs.
• Bullish order block established at $37,250; price rallied to $45,000.
• Strong retracement followed to the $39,000 region—bullish orders filled.
• Current trend: Structure remains bullish with institutional support evident.
Monthly Timeframe
• Post-ATH liquidity collected at $41,750; retested in January with insufficient momentum.
• Price returned to $45,000 before retracing to $38,000.
• Strong bullish response from $38,000 leading into April and May.
• Price now trades above $41,750. A monthly close above this level signals further upside.
• Watch for a three-pin pattern—if confirmed, high probability of a break above previous monthly highs.
• Next target: $45,000 liquidity zone.
Weekly Timeframe
• Double bottom formation aligned with higher timeframes.
• Bullish accumulation at $41,250 drove price to $42,000, followed by a close above that level.
• Immediate resistance at $44,000, where previous bearish orders were concentrated.
• Last week ended with a bearish candle; this week opened with strong bullish momentum from $41,250.
• This timeframe supports a bullish bias, contingent on follow-through above key levels.
Daily Timeframe
• Bullish structure in alignment with monthly and weekly.
• Strong order flow noted at $41,250, enabling a break and close above $42,000.
• Next daily target: $42,800; key resistance: $42,881.
• Anticipate a possible retracement to $42,000 for further accumulation before continuation higher.
4H Timeframe
• Intraday price action highlights Friday’s retracement to $41,250 during NY session—bullish orders filled.
• Monday opened bullish; momentum slowed at $42,000 with brief retracement.
• Tuesday's NY session: 3-pin bullish pattern at $42,000, followed by a bullish close.
• Current price movement appears to be a retracement for more long orders.
• No actionable setup at the moment; monitoring for a clean 4H close above $42,350.
1H Timeframe
• Price encountered resistance at $42,350, a known liquidity region.
• Break and close above $42,300–$42,350 range confirms short-term bullish pressure.
• Awaiting next 4H candle to assess validity of long setup.
• Maintaining a neutral stance short-term; prepared to act on bullish confirmation.
________________________________________
Conclusion:
Very mindful of FOMC meeting minutes today and I am waiting to see what price action will occur after. Market structure across all major timeframes remains bullish. Pending a monthly close above $41,750 and a potential three-pin formation, the technical outlook favors continued upside. Patience remains key—await confirmation for optimal long entries.

US30 longHere is why:
All the timeframes (3M, M,W and D) are showing very bullish signs after the recent downfall we have seen in price due to political factors. However, there is no clear targets in those timeframes as of now.
However, there is a distinct target on the 4H timeframe.
The target is at 42,980.
The reason is we saw price collecting a lot of orders at 41,500 and the next major liquidity point is at 42,980.
So basically, all price is doing is collecting orders in order to reach that target.
We know this to be true because we have seen bullish indications in the way price has been collecting orders between the consolidation region of 42,660 and 42,500.
Yesterday, price broke above that region, however, orders that were made at the time were not enough for price to reach the target of 42,980.
Price went all the way to 42,300 to collect more orders in order to go and hit the 42,980 liquidity region.
Currently, I am waiting for price to form any sort of bullish confirmation for me to buy.
The best signs for that is for price to retrace to 42,500, where I will look to buy to the next liquidity region at 42,650.

Dow Jones at trendline support: Will it bounce to 44,812$?CAPITALCOM:US30 is undergoing a corrective pullback after forming a double top near the upper boundary of the ascending channel. The rejection from this resistance zone triggered increased selling pressure, driving the price back toward the lower boundary of the channel, where buyers are now looking to step in.
If buyers step in and defend this support, we could see a move toward the midline of the channel, with the next key target at 44,812. Holding above this level would reinforce the bullish trend structure and increase the probability of continuation toward the upper boundary of the channel.
However, a failure to hold trendline support could weaken the bullish outlook, leading to a potential breakdown and further downside pressure. Price action near this critical zone will be key in determining the next directional move.
Traders should monitor candlestick formations and volume for confirmation. As always, managing risk effectively is essential when trading this setup.
If you have any thoughts on this setup or additional insights, drop them in the comments!

US30 LongTarget at 45,273 have still not been met.
Price has kept collecting orders at in order to reach that target.
Two weeks ago we saw price tank heavily in an attempt to collect orders at an liquidity region.
This region seems to be at 43,100 daily liquidity level.
Price hit that daily level and then we saw a sudden surge of buy momentum, indicating that price is going high.
Price has broken structure on the daily and 4 hour timeframes, indicating that price will continue going upwards.
Due to the monthly and weekly candlestick closures, I can tell that price is due to retrace lower before going upwards.
I expect price to retrace lower forming an obvious liquidity region before I buy.

US30 longThis analysis highlights key patterns and price levels observed on the weekly, daily, and four-hour (4H) timeframes, supporting a bullish outlook. The discussion focuses on the significance of untested formations, rejection patterns, and accumulation zones that signal potential market moves.
1. Weekly Analysis
M Formation Neckline Retest: The M formation observed on the weekly timeframe has not been retested at its neckline of 43,500, leaving room for potential upward movement.
Three-Pin Rejection Pattern: Price remains below the high of the three-pin pattern formed earlier, and a break above this level would confirm bullish momentum.
Daily Target: A double bottom has formed, indicating that price could aim for the daily target of 43,680.
2. Four-Hour (4H) Timeframe Insights
Bullish Pattern Formation: The 4H chart reveals a bullish setup, with price approaching a strong resistance zone at 43,700.
Accumulation Phase: The presence of two doji candles suggests ongoing order accumulation, signaling potential market movement.
Entry Strategy: I am monitoring the following levels for possible entries, depending on how the next 4H candlestick closes:
42,450
42,670
The alignment of weekly, daily, and intraday confluences supports a bullish outlook. My strategy involves waiting for confirmation from the next 4H candlestick closure before executing trades at the identified entry levels. Patience and precision are key to leveraging this setup effectively.

US30 LongThis analysis focuses on the interplay of weekly and intraday confluences, which collectively point towards a potential bullish scenario. A detailed breakdown of the price movements and key levels is provided to support the thesis.
1. Weekly Confluences
Unmet Target: The price has yet to reach its anticipated target of 45,300, indicating unfulfilled market objectives.
Order Collection Observation: A significant retracement suggests an attempt to collect orders within a specific price region.
The first notable level was 43,500, corresponding to a prior body closure. Price broke through this level and moved downward.
The second key region, 42,100, showed a rejection pattern characterized by a three-pin formation.
Pattern Analysis: An "M" pattern is apparent, signaling that the price may retest its neckline at 43,500.
2. Four-Hour Timeframe Insights
Rejection and Momentum: The price rejected the 42,100 weekly level with strong bullish momentum, forming a bullish setup with a target of 42,600.
Order Collection Confirmation : Despite the bullish target not being achieved, the retracement implies another round of order collection, this time within the 42,328 daily level.
Conclusion and Thesis:
The evidence points to a bullish outlook. While the price is gathering momentum and confirming its intentions, I will wait for clear intraday confirmations before entering the market. Patience at this stage will ensure alignment with the larger trend and reduce exposure to potential false moves.
US30 long for this weekAll timeframes point towards US30 going long.
Monthly:
November's candlestick engulfed October's candlestick.
Price has been on a severe uptrend and does not look like it will stop.
This month we have seen a minor retracement that indicates price is collecting orders before it continues going up.
Weekly:
We have seen a three pin pattern before price started retracing which indicates that price will continue to go up.
Currently, price is retracing in order to find a major spot for liquidity where it will collect buy orders.
The high liquidity region seems to be 43,500 since that is where a lot of buy orders were filled in the past.
Daily:
Price had a target of 45,600 which was not hit. This indicates that price is retracing to a level that it will collect orders.
On the daily, the region with the most buy orders are 43,300.
4 hour:
This is the best timeframe to tell where real liquidity lies.
As we can see, the most buy orders were filled at 43,400
HENCE, THE HYPOTHESIS FOR THE WEEK, IS TO WAIT FOR PRICE TO GO TO 43,400, WHERE WE WILL LOOK TO BUY

US30 / Dow Jones Buys!!!Analysis Confirmation
1. Fibonacci Levels: I’ve marked the 0.618, 0.786, and 1.618 Fibonacci levels, which align well with potential reversal and target areas. The 0.618 level at approximately 42,327 acts as support, while the 0.786 level around 42,479 provides additional confirmation near the breakout point.
2. Descending Triangle Breakout: Your chart shows a descending triangle with the resistance trendline below the 42,500 area, indicating a potential breakout if the price can close above it. This pattern suggests bearish exhaustion, so a breakout above the trendline could initiate a bullish move.
3. Target Levels: You’ve set the 1.618 and 2.618 Fibonacci extension levels as potential targets, at approximately 42,884 and 43,374 respectively. These strong resistance zones give realistic take-profit levels if the breakout occurs.
4. Moving Averages and Support: The price is supported by the 200-period moving average (black line) and is currently testing the 50-period moving average (blue line). A break and hold above the 50-period moving average could signify bullish strength.
Trade Description
Entry:
- Enter a buy position on a confirmed breakout above the 0.786 Fibonacci retracement level around 42,479. Look for a strong close above this level to confirm momentum.
Stop Loss:
- Set a stop loss below the 0.618 Fibonacci retracement level, around 42,340, to manage risk in case of a pullback or false breakout.
Take Profit:
- First target: 1.618 Fibonacci extension level around 42,884, which could serve as the initial resistance.
- Second target: 2.618 Fibonacci extension level around 43,374, if bullish momentum continues.
Risk Management:
- Keep your risk per trade low, ideally around 1-2% of your account balance, especially if this is part of your account growth strategy.

US30 Great Long ROI TRADE: Must See Good Morning, Trading Family
I wanted to point out a great trading opportunity with some solid ROI potential. US30 held that 43,078 level like a champ, and now it’s making a push toward the 43,468 zone. If we can break through that resistance, the next logical stop is up at 43,605. It’s looking like the bulls have the upper hand right now, and if you catch this move, there’s a sweet reward on the table.
What I really like about this setup is the risk feels pretty manageable. We’re sitting near the lower part of the channel, so if it goes sideways, you’re not too exposed. But if it does what it looks like it’s ready to do, there’s some solid upside waiting. These are the kind of setups I love — clean structure, clear targets, and room for a smooth move.
Right now, it’s all about watching how it reacts around 43,468. If we break that level with volume, the path toward 43,605 becomes a lot clearer. That’s the spot where I'd start scaling out some profits, but if momentum keeps rolling, there could be even more on the horizon.
If this helps you out, make sure to follow, boost, and share with anyone else who could use it. Let’s grow this trading community together and keep finding setups with that sweet risk-to-reward edge. Stay sharp and trade smart, family.
Mindbloome Trader

US30 longHere is why:
- August's monthly closure was very bullish as the candlestick has left a long wick. This shows that price had collected orders from the previous weekly liquidity regions before heading upwards.
- As of right now, price has broken into all time highs, which indicates that price is going higher. The weekly targets would be 42,450.
- Price is very bullish but I will have to wait for it to form a buy setup on lower timeframes before I enter into the trade.

US30 / DJ30 / DJI Market Money Heist Plan on Bullish SideHola ola My Dear,
Robbers / Money Makers & Losers,
This is our master plan to Heist US30 / DJ30 / DJI Market based on Thief Trading style Technical Analysis.. kindly please follow the plan I have mentioned in the chart focus on Long entry. Our target is Red Zone that is High risk Dangerous level, market is overbought / Consolidation / Trend Reversal at the level Bearish Robbers / Traders gain the strength. Be safe and be careful and Be rich.
Attention for Scalpers : If you've got a lot of money you can get out right away otherwise you can join with a swing trade robbers and continue the heist plan, Use Trailing SL to protect our money.
Note: If you've got a lot of money you can get out right away otherwise you can join with a swing trade robbers and continue the heist plan, Use Trailing SL to protect our money.
Entry : Can be taken Anywhere, What I suggest you to Place Buy Limit Orders in 15mins Timeframe Recent / Nearest Swing Low
Stop Loss : Recent Swing Low using 30m timeframe
Warning : Fundamental Analysis comes against our robbery plan. our plan will be ruined smash the Stop Loss. Don't Enter the market at the news update.
Loot and escape on the target 🎯 Swing Traders Plz Book the partial sum of money and wait for next breakout of dynamic level / Order block, Once it is cleared we can continue our heist plan to next new target.
Support our Robbery plan we can easily make money & take money 💰💵 Follow, Like & Share with your friends and Lovers. Make our Robbery Team Very Strong Join Ur hands with US. Loot Everything in this market everyday make money easily with Thief Trading Style.

US30 long- Price has collected orders from the 40,000 region.
- Today's 1 hour timeframe, seems very bullish.
- I am waiting for the most opportune time to enter for longs

US30: A record Higher High is On The Way $43000! Swing TradeBLACKBULL:US30
Fundamentals supports our idea, while looking at the technical side we can confirm that price will drop around 39k to 39.5k this is the zone which remain a key level for the big buyers. Ideally we would wait for price to approach our key level and then take buy entry. However, we might see early price mitigation around $40000 region. Good luck.
