US30 Trade Set Up Jan 27 2026Price has inverted a 4h FVG and is making LH/LL on the 1h so i will want to see some kind of pullback into a FVG followed by a 1m IFVG/CISD to continue towards PDL
Us30idea

US30 Trade Set Up Jan 28 2026Price has swept London lows and is consolidating under a 4h FVG so i price can make internal bullish structure on the 1m-5m with a bullish IFVG/CISD i will take buys to BSL and higher 4h FVG or if price trades to PDL i will look for a buys set up from there

US30 Trade Set Up Jan 26 Price is making internal bullish structure but on the 4h its making bearish structure so i will expect price to test the 1h FVG and if it respects it with internal IFVG/CISD to the downside i will takes sells to Asia lows

US30 Outlook : Momentum Still Favours upsideAt this stage, the focus remains on staying aligned with market direction and letting price confirm the bias, instead of trying to catch early reversals. As long as this momentum remains intact, the upside outlook stays valid.
Disclosure: We are part of Trade Nation's Influencer program and receive a monthly fee for using their TradingView charts in our analysis.

Dow 30 Outlook :: Trend Continuation Or Exhaustion?🎯 US30 (Dow Jones) - BULLISH PULLBACK SETUP | Day/Swing Trade 📈
💎 ASSET OVERVIEW
US30 Index CFD (Dow Jones Industrial Average)
The legendary Wall Street benchmark - 30 blue-chip giants moving markets worldwide 🏛️
🔥 TRADE SETUP - THIEF'S BLUEPRINT
📊 BIAS: Bullish Momentum Confirmed ✅
🎯 STRATEGY: Simple Moving Average (SMA) Pullback Play
⏰ TIMEFRAME: Day Trade / Swing Position
🚀 ENTRY ZONE
ANY PRICE LEVEL ENTRY - Flexibility is power, fam! 💪
Smart thieves don't chase - they position strategically at current market levels
🎖️ TARGET ZONE
TP: 50,600 🎉
Why this level? 🤔
✅ Police force resistance (strong institutional selling zone)
✅ Overbought territory - RSI screaming "TAKE PROFITS!"
✅ Correlation trap zone detected
✅ Historical rejection area
⚠️ THIEF'S WISDOM: Dear Ladies & Gentlemen (Thief OG's) 👑 - I'm NOT recommending you set ONLY my TP. It's YOUR choice, YOUR money, YOUR risk! Scale out, lock profits, be smart! 💰
🛡️ STOP LOSS
SL: 48,800 🚨
Risk Management = Survival 🎲
⚠️ THIEF'S DISCLAIMER: Dear Ladies & Gentlemen (Thief OG's) 👑 - I'm NOT recommending you set ONLY my SL. Adjust based on YOUR risk tolerance and account size. Protect that capital like it's gold! 🔐
🔗 CORRELATED PAIRS TO WATCH 👀
🇺🇸 US Dollar Pairs:
DXY (US Dollar Index) - Inverse correlation: If DXY falls, US30 typically rallies 📉➡️📈
EUR/USD - Risk-on sentiment boosts both
GBP/USD - Cable follows risk appetite
📊 US Indices Family:
NAS100 (Nasdaq) - Tech-heavy cousin, leads risk sentiment 🖥️
SPX500 (S&P 500) - Broader market confirmation 📊
Russell 2000 - Small-cap risk gauge
💹 Other Key Assets:
Gold (XAU/USD) - Safe haven inverse play 🥇
Crude Oil (WTI/Brent) - Energy sector impact ⛽
VIX (Fear Index) - Low VIX = Bullish equities 😌
📰 FUNDAMENTAL & ECONOMIC FACTORS 🌍
🔑 KEY DRIVERS TO MONITOR:
✅ Latest Considerations:
Fed Interest Rate Policy - Rate cut expectations boost indices 💵
US Employment Data - Strong jobs = bullish markets 💼
Corporate Earnings Season - Dow components reporting (Boeing, Apple, Microsoft, etc.) 📊
Inflation Data (CPI/PPI) - Lower inflation = rally fuel 🔥
GDP Growth Figures - Economic expansion supports equities 📈
📅 Upcoming News Events to Watch:
FOMC Minutes Release - Fed policy hints 🏦
NFP (Non-Farm Payrolls) - First Friday monthly jobs bomb 💣
Retail Sales Data - Consumer spending strength 🛍️
PMI Manufacturing/Services - Economic health check 🏭
Presidential Economic Policies - Trade deals, tariffs, fiscal stimulus 🇺🇸
⚠️ Risk-Off Events:
Geopolitical tensions (watch Middle East, China-US relations) 🌐
Banking sector stress signals 🏦
Unexpected Fed hawkish pivot 🦅
🎭 THIEF'S FINAL MESSAGE 💬
Yo fam! 🎩✨
If you made it this far, you're one of the REAL ONES! 🔥
Remember: The market doesn't care about your feelings - it only respects discipline, strategy, and risk management! 🎯
This setup is MY analysis, but YOUR money is YOUR responsibility. Take profits when they're green, cut losses when they're red. No hero holding here! 💯
🙏 THIEF'S BLESSING:
"May your entries be clean, your exits be profitable, and your stop losses never get hit!" 🚀💰
"Trade smart, stay sharp, and let the market pay you!" 💸
👇 SUPPORT THE THIEF SQUAD! 👇
If this idea helped you or gave you clarity:
✅ SMASH that LIKE button 👍💎
✅ DROP a COMMENT below with your thoughts or questions! 💬🔥
✅ HIT FOLLOW to catch the next heist setup! 🎯📲
Your support fuels more FREE alpha! 🚀
⚡ Let's rob the markets LEGALLY together! ⚡
#US30 #DowJones #TradingView #DayTrading #SwingTrading #TechnicalAnalysis #BullishSetup #ThiefTrader #MarketHeist #ProfitTakers #StockMarket #ForexTrading #Indices #WallStreet 📊💰🎯

US30 Trade Set Up Jan 23 2026Price is still in a bullish trend making HH/HL on the 4h but there is a 1h FVG that i expect price to fill which i will then look for internal 1m-5m IFVG/CISD to take buys back up

US30 Trade Set Up Jan 22 2026Price Is making HH/HL on the 1h indicating a bullish trend but price has swept PDH/London highs so if price forms a 1m-5m IFVG/CISD to the downside, i will take sells to Asia lows and the 1h FVG but if price continues to make HH/HL on the 1m-5m above PDH i will take buys to higher BSL levels

US30 Trade Set Up Jan 21 2026Price is still making LL/LH on the 1h and 4h so if price respects the 1h FVG again and sweep London/Asia highs followed by 1m-5m IFVG/CISD i will take sells to SSL levels but if price inverts and closes above the 1h FVG i will look for buys to PDH

US30 Trade Set Up Jan 20 2026Price is making LL/LH so i will expect price to either respect the 15m bearish FVG and drop from there or trade higher into London highs and the 4h FVG to then make internal 1m-5m IFVG/CISD to trade lower

US30 Trade Set Up Jan 19 2025Price is trading below PDL and still making LL/LH but first i want to see either a sweep of London highs to then trade lower or a sweep of London lows first to then trade higher

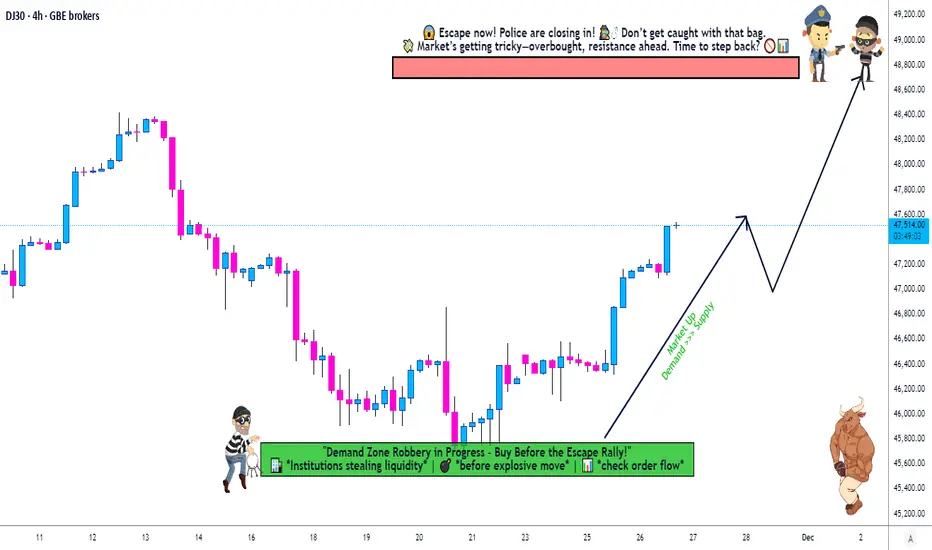
Is US30 Setting Up a Major Bullish Reversal? Layer Plan Inside🚀 US30 BULLISH SWING LAYER STRATEGY | "The Thief" Entries 🚀
BROTHERS & SISTERS OF THE MARKET! 👋 Welcome back, Thief OG's! 🦸♂️🦸♀️ A powerful Bullish setup is forming on the US30 (DOW JONES), and I'm sharing my layered entry plan to strategically position for the next leg up.
📈 Asset: US30 (Dow Jones Industrial Average)
⚡ Bias: Bullish | Style: Swing Trade
🎯 The Strategic Plan (The "Thief" Method)
This isn't a gamble; it's a calculated siege. We use a "Thief" Layering Strategy to scale into the position, reducing average entry cost and managing risk. We don't chase price; we let price come to us!
⚔️ Trade Execution Details
✅ ENTRIES (Buy Limit Layers):
We are setting multiple buy orders at key support levels. This is the core of the "Thief" method:
▶️ Layer 1: 46,400
▶️ Layer 2: 46,600
▶️ Layer 3: 46,800
▶️ Layer 4: 47,000
💡 Pro Tip: You can INCREASE or ADJUST these layers based on your capital and risk appetite.
❌ STOP LOSS (RISK MANAGEMENT):
A consolidated stop loss is placed below a major support zone to protect our capital.
➡️ SL: 46,200 (or lower based on your personal risk tolerance)
⚠️ Disclaimer (PLEASE READ): I am NOT a financial advisor. This SL is a suggestion. You MUST adjust your Stop Loss based on your own risk management strategy. Protect your capital at all costs!
🎯 PROFIT TARGET:
We are targeting a significant resistance zone where the market might see a pullback.
🎯 TP: 48,800
Rationale: This area aligns with a confluence of factors including Moving Average resistance and a potential overbought trap. The goal is to "escape with profits" before a potential reversal.
🤑 Take Note: You are free to take profits earlier! If you're in profit, you can never be wrong for taking money off the table.
🔍 Market Analysis & Key Drivers
Bullish Structure: The overall trend structure on higher timeframes remains intact.
Layered Advantage: This strategy smooths out the entry, preventing a single, potentially poor, entry point.
Risk Defined: Our maximum risk is clearly defined from the start.
🌐 Related Pairs & Correlations to Watch
Diversify your view! The US30 doesn't move in a vacuum. Keep these key assets on your watchlist:
SP:SPX (S&P 500): 🟢 High Positive Correlation. The SPX is the broader market leader. A strong SPX often pulls the DOW higher. This is your #1 confirmation.
NASDAQ:NDX (Nasdaq 100): 🟢 Positive Correlation. Tech strength can fuel overall market sentiment, but watch for divergence.
TVC:DXY (US Dollar Index): 🔴 Generally Inverse Correlation. A strengthening dollar can be a headwind for US equities. If DXY rallies sharply, be cautious.
/ES (S&P 500 Futures): 🟢 High Positive Correlation. Tracks the SPX almost tick-for-tick. Great for real-time sentiment.
✅ Conclusion
This "Thief" layered strategy provides a disciplined, low-stress approach to catching a potential US30 upswing. Remember, the market is about probabilities, not certainties.
👑 Your Capital, Your Rules. Trade Safe!
📌 Hashtags for Maximum Visibility:
#TradingView #US30 #DOW #TradingStrategy #SwingTrading #Stocks #Investing #Finance #Bullish #LayerStrategy #RiskManagement #ThiefStrategy #MarketAnalysis #SPX #DXY
👉 LIKE & FOLLOW if you found this idea helpful! Your support keeps the research coming! 💪
US30 Pauses Near Highs : Momentum CoolingUS30 is currently consolidating after an extended upside run, with price showing signs of short-term hesitation rather than a clear reversal. The recent candles reflect slowing momentum and digestion of prior gains, suggesting the index is in a balancing phase as participants reassess direction. This type of behaviour often appears before volatility expansion, keeping the broader structure in focus while the market prepares for its next decisive move.
Disclosure: We are part of Trade Nation's Influencer program and receive a monthly fee for using their TradingView charts in our analysis.

US30 Trade Set Up Jan 16 2026Price is making LH/LL on the 15m and is making LH/LL on the 1h and 15m, inverted a 1h bullish FVG and is currently respecting a bearish 1h FVG so as long as price continues to make internal bearish structure i will look for sells into the 4h FVG and possibly towards PDL

US30 Trade Set Up Jan 15 2026Price is bearish on the 4h but bullish on the 1h so i will want to see either a sweep of Asia lows first followed by 1m-5m IFVG/CISD to target London highs or price to respect the bearish 15m FVG to continue lower towards PDL

US30 | Liquidity, Structure & MA Confluence Support Bulls🚨 US30 (Dow Jones Industrial Average) CFD | Bullish Breakout Setup 📈
📊 MARKET OVERVIEW
Asset: US30 Index CFD (Dow Jones Industrial Average)
Trade Type: Day/Swing Trade Opportunity
Bias: 🟢 BULLISH - Confirmed by Moving Average Pullback & Price Action
Timeframe: H4/Daily Chart Analysis
🎯 TRADE PLAN BREAKDOWN
📍 ENTRY ZONE
Flexible Entry: ANY current price level accepted ✅
Strategy: Moving Average pullback confirmation with momentum continuation
Ideal Entry: Wait for minor retracement to key support levels for better R:R ratio
🛑 STOP LOSS (SL)
Suggested SL: @ 42,800 🔒
⚠️ DISCLAIMER: This is MY personal risk management level. NOT a recommendation! Adjust SL based on YOUR risk tolerance, account size, and trading plan. Trade at your own risk!
💰 TAKE PROFIT (TP) TARGET
Primary Target: @ 50,000 🎯
Resistance Factors:
🔴 Strong psychological resistance zone
📈 Overbought RSI conditions expected
⚡ Potential bull trap area - watch for reversal signals
🔗 Correlation with related markets may trigger profit-taking
⚠️ DISCLAIMER: This is MY target based on technical analysis. Scale out profits at YOUR discretion! Consider partial profit-taking at key levels (48,500 / 49,000 / 49,500). Protect your capital first!
🔗 CORRELATED ASSETS TO WATCH
📌 Direct Correlations:
SPX500 (S&P 500) - Major US equity index correlation ✅
NAS100 (Nasdaq 100) - Tech-heavy index showing similar momentum
US500 CFD - Broad market sentiment indicator
💵 USD-Related Pairs:
DXY (US Dollar Index) - Inverse correlation; watch for USD weakness = US30 strength 📉💹
EUR/USD - Risk-on sentiment boosts equities when EUR/USD rises
USD/JPY - Yen weakness typically supports US equity rallies
GBP/USD - Cable strength indicates risk appetite
🏆 Key Market Drivers:
VIX (Volatility Index) - Low VIX = bullish for US30 🟢
Gold (XAU/USD) - Inverse safe-haven correlation
10Y US Treasury Yields - Rising yields may pressure equities; monitor closely ⚠️
📰 FUNDAMENTAL & ECONOMIC FACTORS
🔥 Recent Economic Data (Impact on US30):
Federal Reserve Policy 🏦
Current stance: Monitor FOMC statements for rate cut signals
Lower rates = bullish for equities ✅
Any hawkish surprise = bearish risk ⚠️
US Jobs Data (NFP/Unemployment) 📊
Strong labor market = corporate earnings support = US30 bullish
Weak data = recession fears = potential reversal
Inflation Reports (CPI/PPI) 💹
Cooling inflation supports Fed rate cuts = equity rally continuation
Hot inflation = Fed stays tight = headwinds for US30
Corporate Earnings Season 🏢
Watch major Dow components: Apple, Microsoft, Boeing, Goldman Sachs
Strong earnings = momentum fuel 🚀
📅 UPCOMING NEWS EVENTS TO WATCH:
⏰ FOMC Minutes Release - Fed policy direction
⏰ US Retail Sales - Consumer spending strength
⏰ GDP Growth Data - Economic health indicator
⏰ Geopolitical Risks - Trade policies, global tensions affect sentiment
🌍 Global Market Sentiment:
Risk-On Environment: Positive for US30 📈
Safe-Haven Flows: Watch Gold/JPY for early warning signs 🚨
China Economic Data: Impacts global growth outlook
⚡ KEY TECHNICAL POINTS
✅ Bullish Signals:
Price above major moving averages (50/200 EMA)
Higher highs & higher lows structure intact
Volume confirmation on breakout candles
RSI showing bullish momentum (not yet overbought)
⚠️ Risk Factors:
Approaching major psychological resistance @ 50,000
Potential exhaustion at extended levels
Correlation breakdown if USD strengthens aggressively
Geopolitical shocks or unexpected Fed hawkishness
💡 TRADING WISDOM
🎓 Risk Management is KING:
Never risk more than 1-2% of your account per trade
Position size according to YOUR stop loss distance
Markets reward patience and discipline 🧠
🔄 Profit Protection:
Move SL to breakeven once +100 pips in profit
Scale out 50% at intermediate resistance levels
Let runners ride with trailing stops
🚀 FINAL THOUGHTS
This US30 setup combines technical confluence + fundamental tailwinds for a high-probability bullish scenario. However, markets are NEVER guaranteed! 🎲
👉 YOUR MONEY = YOUR RULES
👉 MY ANALYSIS = EDUCATIONAL PERSPECTIVE
👉 TRADE RESPONSIBLY = PROTECT YOUR CAPITAL
📣 ENGAGEMENT REMINDER:
💬 Drop a comment with YOUR analysis!
👍 Smash that LIKE button if this helps!
🔔 FOLLOW for daily market breakdowns!
📊 Share your trades - let's grow together! 🤝
🔥 Good luck, traders! May the pips be with you! 🔥
#US30 #DowJones #TradingView #DayTrading #SwingTrading #ForexTrading #IndexTrading #TechnicalAnalysis #BullishSetup #TradingIdeas #MarketAnalysis #CFDTrading #PriceAction #RiskManagement 📊💹🚀

US30 Trade Set Up Jan 14 2026Price is currently trading at PDL so i will want to see a sweep of London low followed by 1m-5m IFVG/CISD to target London highs and possibly the 4h FVG

US30 Trade Set Up Jan 13 2026Price pushed higher sweeping PDH and London/Asia highs so i will expect price to sweep London lows and/or tap into 4h FVG to then trade higher to ATH again

US30 Trade Set Up Jan 12 2026Price is making LL/LH on the 1h indicating aa bearish trend so i will wait for either the 1h FVG to be filled or London highs to be swept before looking for internal 1m-5m IFVG/CISD to target London lows and lower SSL

US30 Will Grow!
HI,Traders !
#US30 is trading in an
Uptrend and the pair is
Going down to retest
The horizontal support
Around 48784.9 so after
The retest we will be
Expecting a further
Bullish move up !
Comment and subscribe to help us grow !

US30 Trade Set Up Jan 9 2026price is making HH/HL and has now broken above PDH so i will want to see a pullback into a 5m-15m FVG to then look for buys to BSL/ATH

US30 Trade Set Up Jan 8 2026Price has filled a daily FVG and swept PDL if price makes internal 1m-5m bullish structure i will look to take buys higher towards Asia highs

US30 Trade Set Up Jan 7 2026Price remains in a strong bullish trend. I will want to see Asia highs swept then reverse to London lows and 4h FVG or a break higher, tap into internal bullish FVG to continue higher

US30 Trade Set Up Jan 6 2025price has made a new ATH yesterday and has tapped into a 4h bullish FVG also inverted a 1h bearish FVG so i will expect price to target Asia highs and possible PDH
