US30 Bearish Breakout!
HI,Traders !
#US30 made a bearish
Breakout of the key horizontal
Level of 44822.3which also
Seems to have been a neckline
Of the small H&S pattern so
We are locally bearish biased
And we will be expecting a
Further bearish move down !
Comment and subscribe to help us grow !
Us30idea

US30 Forecast: Target Locked, Buy Zones in Sight!Good morning friends ☀️
I've prepared a fresh analysis for US30 (Dow Jones).
My current target is 45,470. Even if the price dips to 45,050 or 44,800, I fully expect it to reach that 45,470 mark.
These levels represent strong buying zones and powerful retest regions—don’t forget that.
Every like from you is my biggest source of motivation to keep posting these insights. 💬📊
Big thanks to everyone supporting with a thumbs-up.

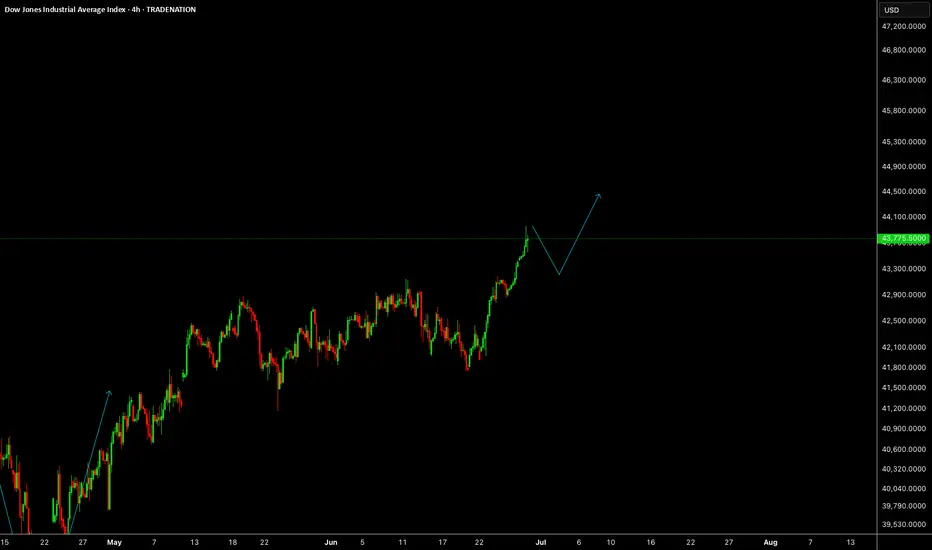
US30US30 needs some more upside short term towards 45.2K level.
Disclosure: We are part of Trade Nation's Influencer program and receive a monthly fee for using their TradingView charts in our analysis.
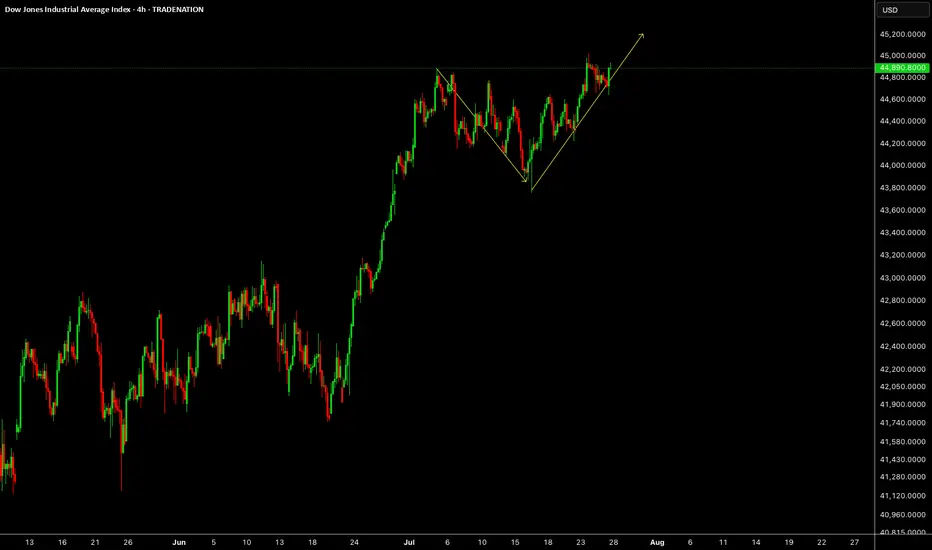
US30 Massive Bullish Breakout!
HI,Traders !
#US30 is trading in a strong
Uptrend and the price just
Made a massive bullish
Breakout of the falling
Resistance line and the
Breakout is confirmed
So after a potential pullback
We will be expecting a
Further bullish continuation !
Comment and subscribe to help us grow !

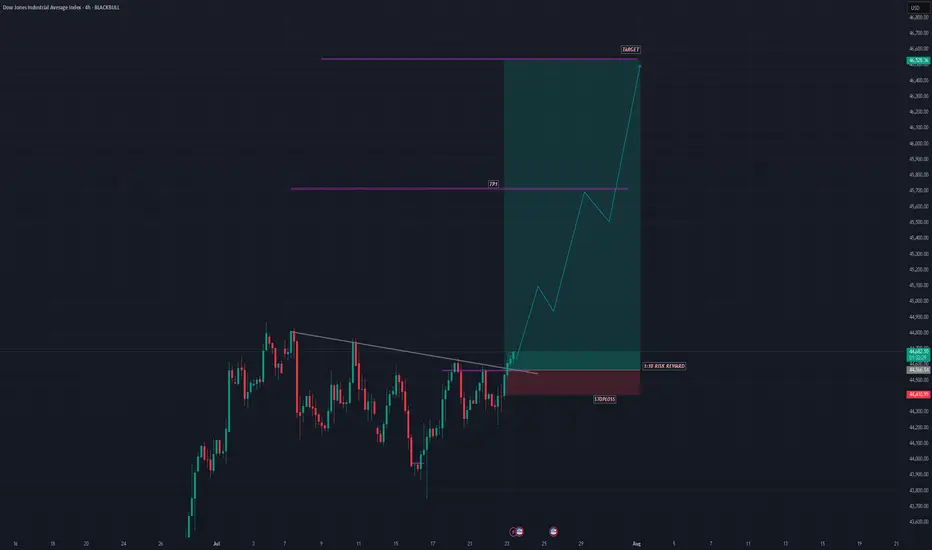
US30 SHOWING A GOOD UPWARD MOVE WITH 1:10 RISK REWARDUS30 SHOWING A GOOD UPWARD MOVE WITH 1:10 RISK REWARD
DUE TO THESE REASON
A. its following a rectangle pattern that stocked the market
which preventing the market to move any one direction now it trying to break the strong resistant lable
B. after the break of this rectangle it will boost the market potential for break
C. also its resisting from a strong neckline the neckline also got weeker ald the price is ready to break in the outer region
all of these reason are indicating the same thing its ready for breakout BREAKOUT trading are follows good risk reward
please dont use more than one percentage of your capital follow risk reward and tradeing rules
that will help you to to become a better trader
thank you
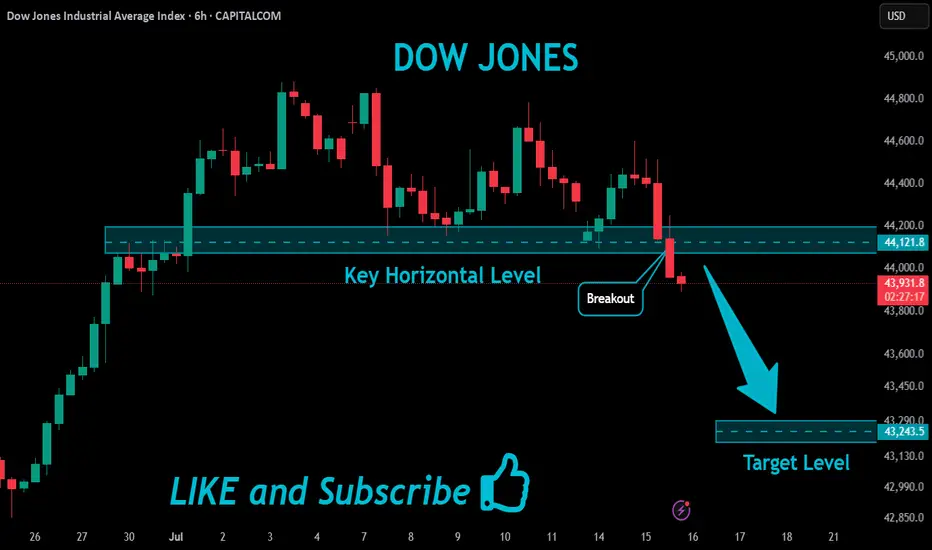
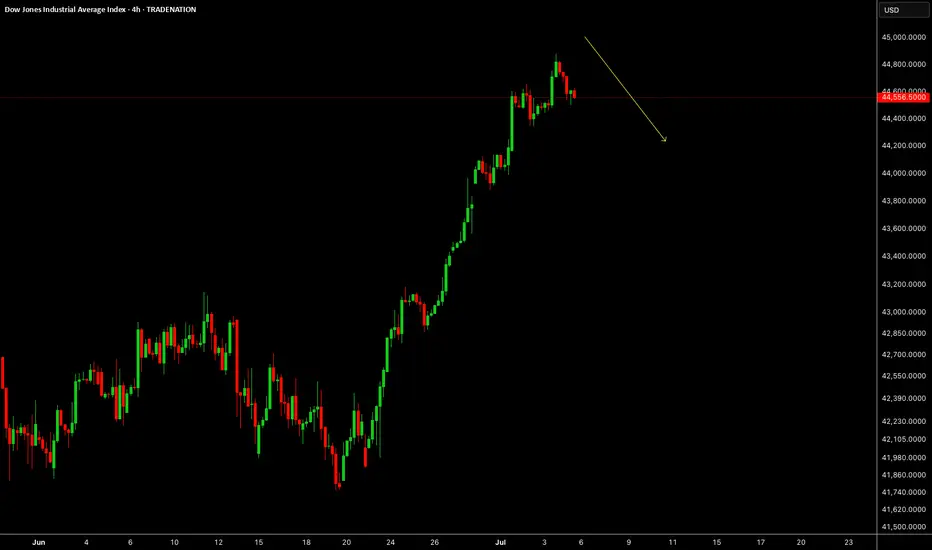
US30 Bearish Breakout!
HI,Traders !
#US30 index is trading in a strong downtrend,
and has broken through the key horizontal
level at 44121.8, reinforcing our bearish
outlook. We expect further declines !
Comment and subscribe to help us grow !
Dow Jones Industrial Average Index - 4 Hour Chart4-hour chart of the Dow Jones Industrial Average (US30) shows a recent price movement as of July 13, 2025. The index is currently at 44,315.0, reflecting a decline of 285.5 points (-0.64%). The chart highlights a sell signal at 44,312.0 and a buy signal at 44,318.0, with a shaded area indicating a potential downward trend from a recent peak. Key price levels include 44,855.7 (high) and 43,902.2 (low), with a support level around 44,315.0.

US30US30 needs some more correction before we go bullish again.
Disclosure: We are part of Trade Nation's Influencer program and receive a monthly fee for using their TradingView charts in our analysis.

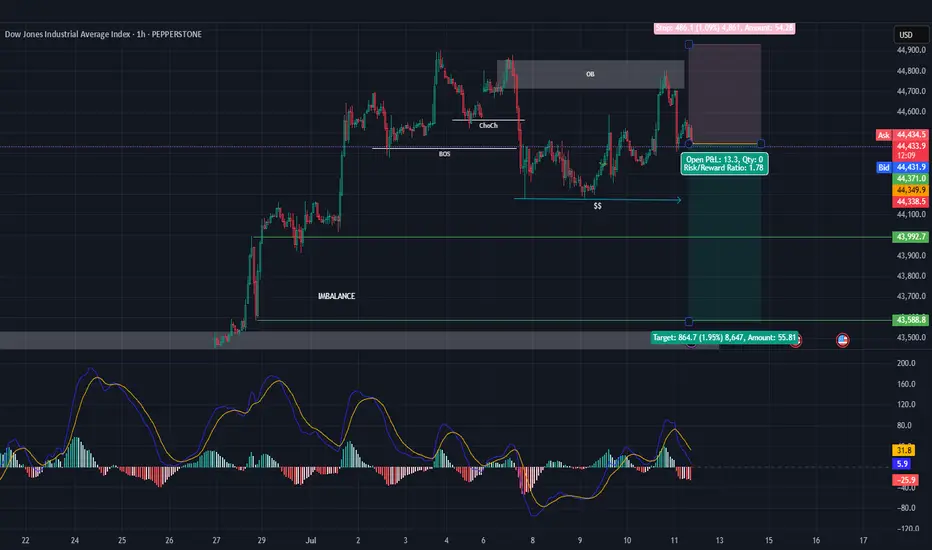
US30 - Short SellThe Dow Jones aka US30
* Overall trend is bullish
* Currently trading the retracement with the following points.
1. Valid OB
2. Liquidity to the sell side
3. Imbalance to the sell side
4. Price failed to break the previous HH activating the Bear positions, the question is How Deep The Retracement Will Be ? So we are closely monitoring the price action to adjust at any changes that the market might face.
US30 Local Short!
HI,Traders !
US30 index is moving in a sideways
movement Over the medium term down
Again and will soon hit
A horizontal support
Of 44482.4 from where
We will be expecting a
Local bullish rebound !
Comment and subscribe to help us grow !

Us30 h4 next move Rejection near BoS
2. Break below support zone
3. Lower high formation
4. Bearish continuation towards 43,250

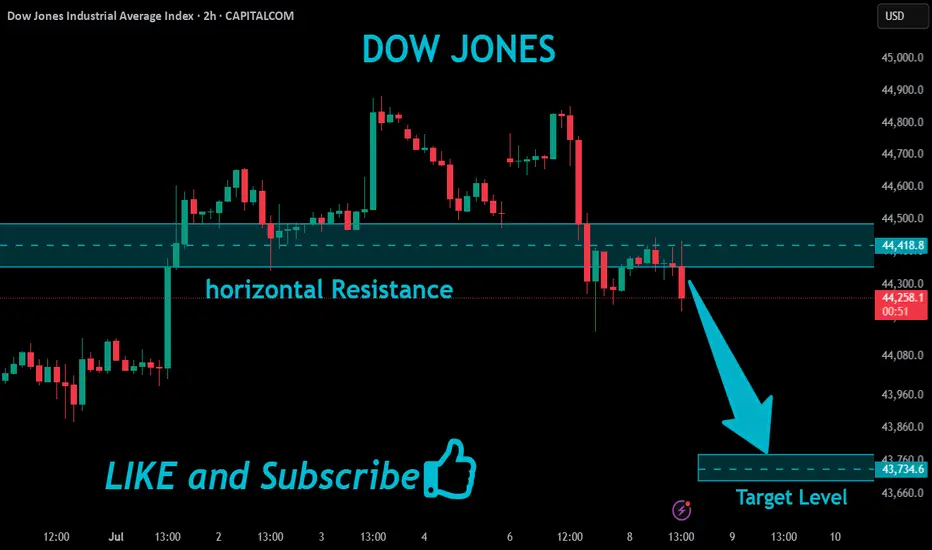
US30 Will Fall!
HI,Traders !
US30 made a retest
Of the key horizontal
Resistance level of 44418.8
From where we are
Already seeing a bearish
Reaction and we will
Be expecting a
Further bearish move down !
Comment and subscribe to help us grow !
US30US30 is due correction, it can start now or just above the ALH.
Disclosure: We are part of Trade Nation's Influencer program and receive a monthly fee for using their TradingView charts in our analysis.
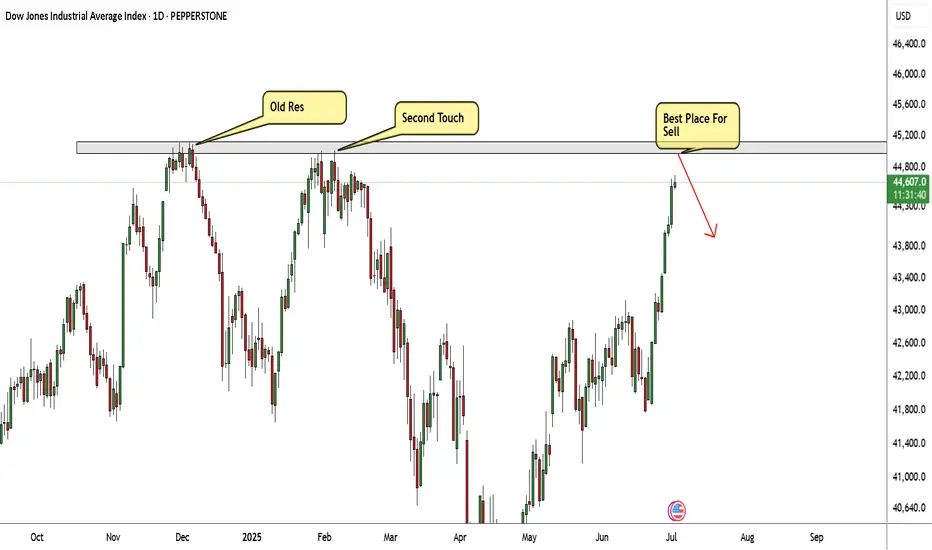
US30 Very Near Strong Res Area , Short Setup To Get 500 Pips !Here is my US30 Daily Chart , the price very near the highest price area , this res area forced the price to go down very hard 2 times so i think this time will be the biggest movement to downside , so i`m waiting the price to touch it and give me a good bearish price action and then we can enter a sell trade and targeting at least 500 pips . if we have a daily closure above then this idea will not be valid .
US30We expected US30 to give us a reaction from above 43.5K, market has given us more than 2K points move, now we will wait for the correction before any more buys.
Disclosure: We are part of Trade Nation's Influencer program and receive a monthly fee for using their TradingView charts in our analysis.
Dow Jones Industrial Average Index - 4h Chart (FOREXCOM)4-hour chart of the Dow Jones Industrial Average Index (US30) shows the price movement from late June to early July 2025. The current value is 43,057.7, reflecting a slight increase of +78.0 (+0.18%). The chart highlights key price levels, including a resistance zone around 43,324.1 and a support zone near 42,875.8, with recent price action showing a breakout above the resistance level.

Why I’m Sitting Out: US30 Reaches Critical Range HighI’m currently keeping a close eye on the US30, along with the other major indices 🧐. What stands out the most right now is how overextended this rally has become across the board 📈.
The key concern here is that price has now pushed into a previous external range high, sweeping liquidity resting just above that level 💧. This area is a textbook zone where big money often steps in to offload positions — it’s the perfect place for institutions to find willing counterparties after prior accumulation 📍💼.
Given the aggressive nature of this move and how far price has stretched, I’m extremely hesitant to get involved at this stage 🚫. I have zero interest in buying into a market that’s trading at a premium and sitting at a potential reversal zone ⚠️.
The prudent move here is to wait for a retrace, followed by a bullish break in structure before considering re-entry 🔁📈. Sometimes, the most powerful edge in trading is knowing when not to trade — and for me, today is one of those days.
⚠️ This is not financial advice — just sharing my current perspective on the market.

US30 Will Grow!
HI,Traders !
#US30 is trading in an
Uptrend and the Indice
Made a bullish breakout
And a pullback so affter
The retest of the broken
Falling resistance which
Is now a support we will
Be expecting a further
Bullish move up !
Comment and subscribe to help us grow !

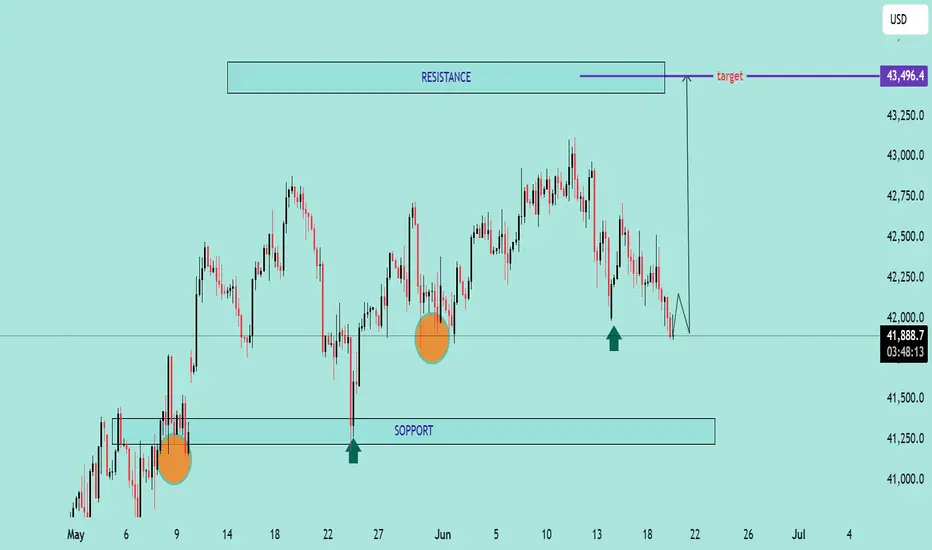
US30 Potential Rebound from Key Support Zone
US30 Potential Rebound from Key Support Zone 🚀📊
📉 Analysis Overview:
The US30 (Dow Jones Index) is currently testing a major support zone near the 41,800–41,900 range, a level that has held firm multiple times in the past (highlighted with green arrows and orange circles). This area has acted as a demand zone, leading to strong bullish reactions previously.
🔍 Key Technical Highlights:
🔸 Support Zone: Clearly respected at ~41,800. Price is once again bouncing here.
🔸 Resistance Zone: Around 43,250–43,500. This area has acted as a ceiling, where price struggled to break through.
🟢 Reversal Indicators: Multiple successful defenses of the support zone suggest accumulation and possible bullish reversal.
📈 Target Projection: If support holds, the price may rally toward the target zone near 43,496.4, as shown by the purple arrow.
📌 Conclusion:
As long as the 41,800 support holds, US30 shows bullish potential toward the 43,500 resistance. A break below this zone would invalidate the bullish scenario and shift focus back to the lower support near 41,250.
🛑 Risk Management Tip: Watch for confirmation candles and volume before entering long positions. Always set a stop-loss below the support zone.
US30 Under Pressure: Possible Short Setup Brewing on the 4HI'm currently eyeing the US30 (Dow Jones Index) for a potential short opportunity based on multi-timeframe structure 📊.
🔍 Weekly Overview:
The weekly chart continues to show sustained pressure, with this week and last week both closing bearish. The sellers are clearly in control at the macro level. 🔻
📆 Daily & 4H Structure:
Drilling down to the daily and 4-hour charts, we can clearly see a break of structure (BOS). The 4H specifically is showing textbook signs of a bearish trend with lower highs and lower lows forming consecutively 🪜🔽.
🎯 Trade Plan:
I'm watching for a pullback into equilibrium, ideally near the 50% level of the recent Fibonacci range. If price revisits that zone, I’ll be looking for short confirmations to ride the momentum back toward the previous lows, as marked on the chart. 🧠💸.

DOW30/US30 - ACTIVE TRADE - PROFITABLE SET UP TRADETeam,
today I have provide LIVE trading today provide you i did a good trade for
NAS100, DOW30 AND DAX30 - in real LIVE trading
OK, I prefer to SET UP my limit order today only. Remember, the market will be very volatile in the next 4 hours.
I expect the RATE should cut 25 points at least. Why
the employment data come out remain the same
inflation last week look under control
Retails is poorly come out today
The FED does not care about the America, they just care about taking advantage of America.
Lets now focus on the SETTING BUY LIMIT ORDER
I order small volume at 41975-42075
However I will double up at LIMIT BUY ORDER
The 1st target are looking at 4227542300
Target 2 - 42575-42675
REMEMBER - IF IT DOES NOT HIT YOUR ENTRY, JUST WALK AWAY.

US30 – Bearish Setup Below Resistance Zone US30 – Bearish Setup Below Resistance Zone 🚨🟥
The US30 index is exhibiting signs of bearish momentum after repeated rejections from the key resistance zone near 43,200. Let's break down the technical picture:
🔍 Technical Analysis
📌 Resistance Zone (🟥 43,200 area)
Price was rejected twice from this resistance (marked by red arrows), showing strong seller presence.
Bearish candlesticks followed each touch, confirming exhaustion near this level.
📌 Support Zone (🟦 40,800 area)
The area around 40,800 has acted as a strong demand zone in the past (highlighted with green arrows and orange circles).
Price might revisit this area if current bearish structure continues.
📌 Intermediate Support (🟪 41,828)
This level serves as short-term support.
If broken, it could accelerate the decline toward the major support.
📌 Market Structure
Lower highs forming after each bounce indicate weakening bullish strength.
A potential bearish breakout pattern is forming (highlighted by the projected path).
📈 Conclusion & Trade Outlook
Bias: Bearish 📉
Trigger: Break below 41,828 support
Target: 40,800 zone
Invalidation: Break and close above 43,200 resistance

DOW/US30 - TIME FOR RECOVER DURING UK MARKET OPENINGTeam, very sad day to see Israel missle flying
We can only hope the world in peace
We are now finding opportunity to entry LONG DOW/US30
Please set your target 1 and 2 ranges
Make sure take 50-70% at first target and bring stop loss to BE
then second target
Please review the chart carefully and pricing target
Good luck.
