US30 Trade Set Up Jan 2 2026Price has made HH on the 1h with London break out of Asia highs so first i will want to see price sweep Asia lows before looking for buys back up
Us30long

DOW/US - PATIENTLY WAITING FOR THE RIGHT PRICETeam, as discussed last week in our community
I was expecting the DOW/US30 to reach low 48155, however it has drop low at 49089
We are going LONG at 48122 STOP LOSS at 48035
Target 1 at 48250-24285
Target 2 at 48350-48415
PLEASE NOTE if the downside drop at 47800 - I will double the volume on LONG..
LETS GO

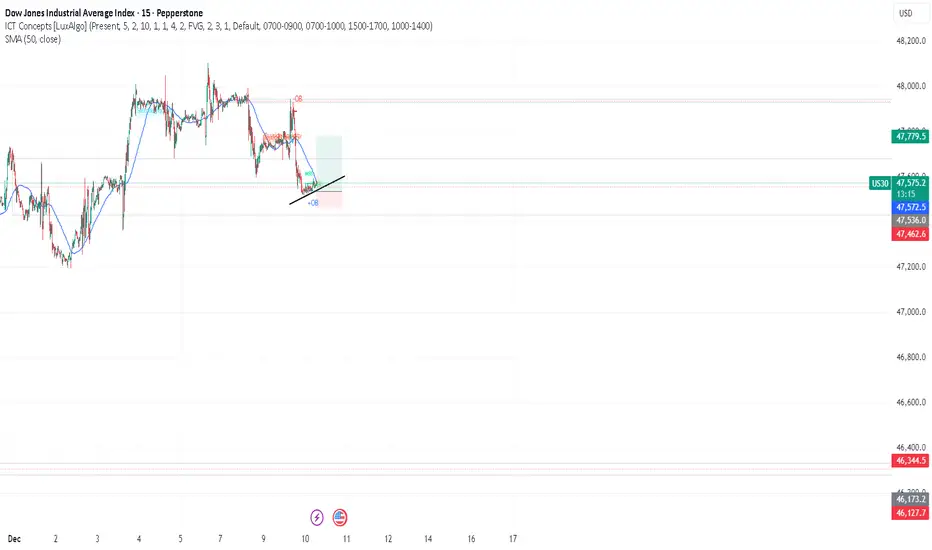
US30 Trade Set Up Dec 29 2025Price has retraced down to test Daily FVG and PDL, so first id like to see if sweep PDL and fill the gap before looking for internal 1m-5m IFVG/CISD to take price higher back towards PDH

US30 Trade Set Up Dec 26 2025Overall im bullish. Price has broken out of the Asia range, swept London highs so now i will wait to see if price can sweep London lows to then form 1m-5m IFVG/CISD to target PDH

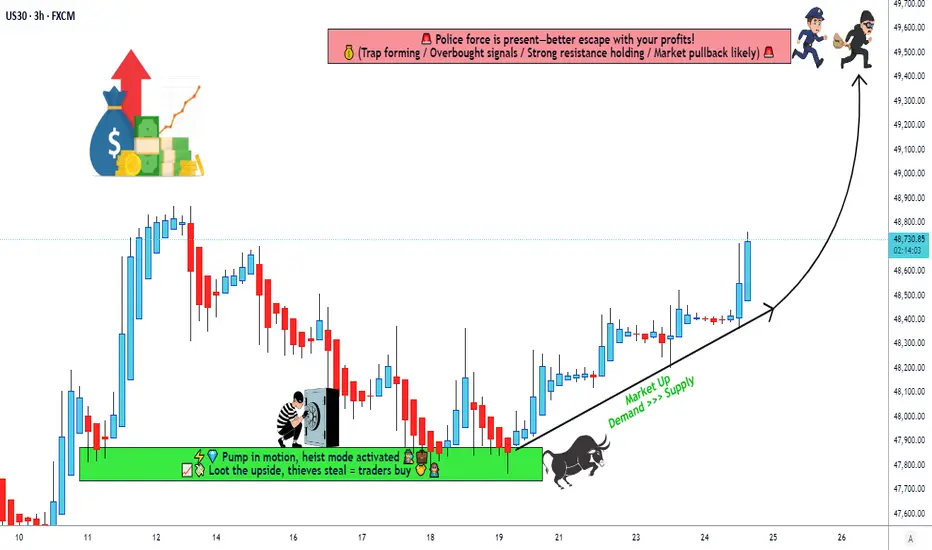
Dow Jones Buyers Control the Market — Trade With Caution!📊 US30 / DJIA "DOW JONES INDUSTRIAL AVERAGE" | CFD Day/Swing Trade
🎯 TRADE SETUP - BULLISH OPPORTUNITY 💰
CURRENT MARKET STATUS 📍
Current Price: ~$48,442 USD
52-Week Range: $36,611.78 - $48,886.86
Recent High (Dec 12): $48,886.86
Recent Trading Range: $48,254 - $48,527
Status: Consolidation Phase After Expansion
🚀 BULLISH TRADE PLAN 📈
📌 Entry Strategy
Flexible Entry Points: Apply pullback entries for better risk/reward
Optimal Zone: $48,000 - $48,300 (after corrective dips)
Entry Confirmation: Look for bullish reversal patterns from support levels
🛑 Stop Loss - MANDATORY RISK MANAGEMENT
SL Level: $48,200 (Recommended Range: $48,000 - $48,200)
⚠️ DISCLAIMER: Adjust SL based on YOUR personal risk tolerance & strategy
Risk Management: Only risk what you can afford to lose
Your Choice: You are responsible for your own SL placement
🎊 Take Profit Targets
Primary Target: $49,500
Resistance Zone: $48,750 - $49,000 (Police Barricade Level)
Technical Setup: Strong resistance + Overbought conditions expected
Exit Strategy: Take profits at zone, don't be greedy
⚠️ DISCLAIMER: TP placement is YOUR decision - manage accordingly
═════════════════════════════════════════════════════════════
📊 TECHNICAL ANALYSIS FACTORS 🔍
✅ Bullish Structure
Price action in bullish channel structure
Respecting ascending trendline
Recent sweep of Asia lows & London highs inverted
Pullback support at key Fibonacci levels (61.8% retracement)
⚠️ Caution Zones
Overbought conditions approaching resistance
Possible trap/correction near $48,750
Profit-taking pressure expected at resistance
Market consolidation showing selective participation
═════════════════════════════════════════════════════════════
💡 CORRELATED PAIRS TO MONITOR 💵
🔴 S&P 500 (SPY / SPX) - High Correlation (0.86+)
Mirror movements with DJI in blue-chip heavy market
Tech momentum affects broader index performance
Watch for divergence signals
Target: $7,200-$7,787 by end 2026
🔵 NASDAQ-100 (QQQ / NDX) - Tech Correlation
DJI has large-cap tech exposure (NVDA, MSFT in components)
QQQ outperformance may signal strength
Volatility: 4.58% vs SPY 3.03% (higher risk/reward)
🟢 Russell 2000 (IWM) - Small-Cap Divergence
Watch for small-cap underperformance
Indicates risk-off sentiment
DJI = blue-chip stability play
🟡 Treasury Yields (10Y TLT) - Inverse Relationship
Lower yields = DJI strength (current environment)
Fed cuts support valuations
Monitor yield curve for macro signals
═════════════════════════════════════════════════════════════
🌍 FUNDAMENTAL & ECONOMIC FACTORS 📌
Federal Reserve Policy (Dec 10, 2025)
Fed Funds Rate: 3.50% - 3.75% (3rd cut in 2025)
Total 2025 Cuts: 1.75% reduction since Sept 2024
2026 Outlook: Only 1-2 cuts expected (markets priced in 2 × 25bps)
Impact: Lower rates = supportive for equities ✅
Labor Market Status 👥
Job gains slowing through 2025
Unemployment rate edged up through September
Announced layoffs exceeded 1.1M through November
Market expects "low-hire, low-fire" environment
Recent data shows cooling labor market
Inflation Picture 📊
Inflation moved UP since earlier 2025
Core PCE: 2.8% (above 2% target)
Tariff-related price hikes filtering through economy
Elevated uncertainty around inflation trajectory
Economic Growth 💹
Moderate expansion of economic activity
Q1 2026 GDP boost expected from tax cuts (0.5-0.8%)
Government data gaps due to 43-day shutdown
Consensus: 2.6% GDP growth 2026
Policy Uncertainty ⚡
Trump Fed Chair nomination pending (Kevin Hassett likely)
Preference for lower rates signals potential policy shift
Fed operational transition (Powell ends May 2026)
Tariff implementation affects corporate earnings
═════════════════════════════════════════════════════════════
📈 WHY THE BULLISH CASE NOW
✅ Supporting Factors
Fed Support: Rate cuts completed, likely pause in 2026
Valuation: Blue-chip large-caps relatively attractive
Seasonality: Historical year-end rally (1-1.88% in final 10-12 days)
Tax Stimulus: Consumer tax returns expected Q1 2026
Earnings Resilience: Consumer data shows credit resilience
AI Buildout: Demand secured for years (benefits large-cap tech in DJI)
⚠️ Risk Factors
Margin Debt: Up 42% in 7 months (historically precedes declines)
Geopolitical: Elevated international tensions
Inflation Resurgence: Tariff-driven pressures remain
Recession Risk: Some Fed members worried without more cuts
Overbought Conditions: DJI near 52-week highs
═════════════════════════════════════════════════════════════
🎓 TRADE MANAGEMENT GUIDELINES
IMPORTANT DISCLAIMERS ⚠️
This is NOT financial or investment advice
Past performance ≠ future results
All trading involves substantial risk of loss
You are solely responsible for your trading decisions
Only risk capital you can afford to lose
Adjust SL & TP based on YOUR personal strategy
This analysis is for educational purposes only
Best Practices
✓ Use proper position sizing
✓ Maintain strict risk management
✓ Track your risk/reward ratio minimum 1:2
✓ Monitor economic calendar for catalysts
✓ Watch Fed speaker comments & data releases
✓ Consider correlation moves in SPY, QQQ, TLT
✓ Exit partial positions at first resistance
✓ Let winners run with trailing stops
═════════════════════════════════════════════════════════════
⏰ ECONOMIC CALENDAR WATCH 📅
Key Upcoming Data
Monthly Jobs Report (impacts unemployment rate)
PCE Inflation Data (validates Fed pause)
Fed Speaker Comments (Powell, new chair nominee)
Treasury Auctions (yields important for DJI)
Q1 2026 GDP Estimates (Trump tax cuts impact)
Trade Data (tariff implications)
═════════════════════════════════════════════════════════════
📊 CHART READING TIPS
Support: $48,000-$48,200 (order block)
Resistance: $48,750-$49,000 (police barricade)
Breakout: Above $49,000 = next phase
Breakdown: Below $48,000 = invalidates bullish case
Timeframes: 1H-4H for day trade, Daily for swing
═════════════════════════════════════════════════════════════
💬 FINAL THOUGHTS
The DJI setup presents a bullish opportunity supported by Fed accommodation and seasonal strength. However, elevated risks including margin debt, inflation concerns, and overbought conditions warrant careful position management.
Thesis: Short-term bullish bias with defined risk-reward to $49,500 target. Watch macro data and Fed communications closely.
Good luck, traders! 🎯✅
Always trade responsibly. This analysis should not be your only basis for trading decisions.
═════════════════════════════════════════════════════════════
US30 Will Keep Growing!
HI,Traders !
#US30 made a bullish
Breakout of the key
Horizontal level of 47978.2
And the breakout is confirmed
So we are bullish biased
And we will be expecting
A further bullish move up !
Comment and subscribe to help us grow !
US30 Trade Set Up Dec 24 2025Price has respected a 1h bullish FVG, is making HL and swept Asia lows and highs so i will wait for a pull back into internal 5m FVG followed by 1m-5m IFVG/CISD to target PDH

US30 Trade Set Up Dec 22 2025Price is in bullish structure, has swept Asia lows and London highs and inverted a 30m bearish FVG so i will want to see a pullback into it to then look for 1m-5m IFVG/CISD to target PDH

US30 Trade Set Up Dec 19 2025Price is making HL on the 1h and has broken out of Asia highs so i will want to see a pull back to sweep London lows and tap into 1h FVG to then form 1-5m IFVG/CISD to go higher to PDH and supply

US30 Trade Set Up Dec 18 2025Price has bounced off strong demand during Asia, London has broken out of Asia and has inverted 1h FVG so i will wait for a pullback followed by internal 1m-5m IFVG/CISD to push higher into PDH and fib levels

US30 Trade Set Up Dec 16 2025Price has respected a daily FVG multiple times and failed to sweep PDL followed by inverting a 1h FVG to then sweep Asia highs and fill a 1h bearish FVG so now i will want to see internal 1m-5m bullish structure to continue its uptrend to PDH

US30 Trade Set Up Dec 12 2025Price remains bullish making ATH so i will want to see price first sweep internal London lows or lower SSL first before looking for 1m-5m IFVG/CISD to continue higher

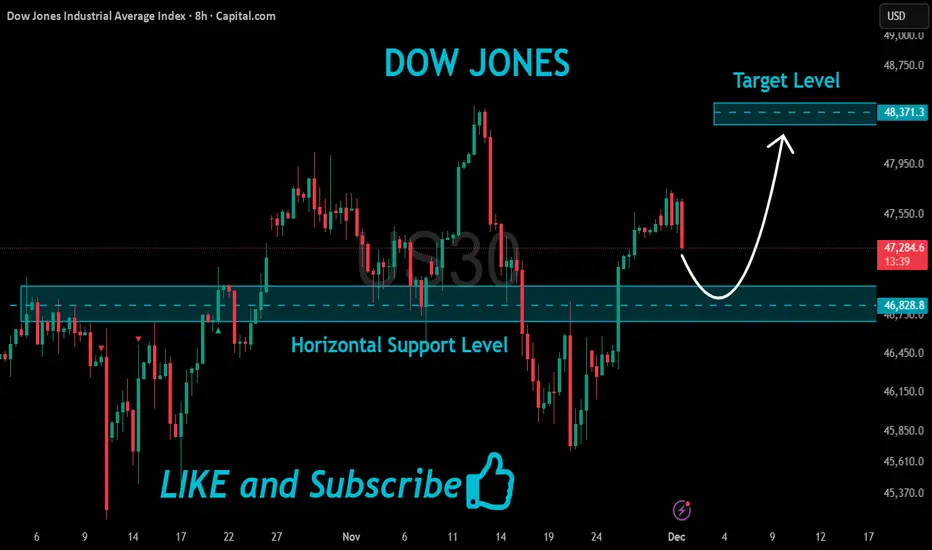
US30 Risky Long!
HI,Traders !
#US30 is about to retest
A horizontal support level
Of 46828.8 while trading
In a local uptrend so
We will be expecting a
Local bullish rebound
And a further move up !
Comment and subscribe to help us grow !
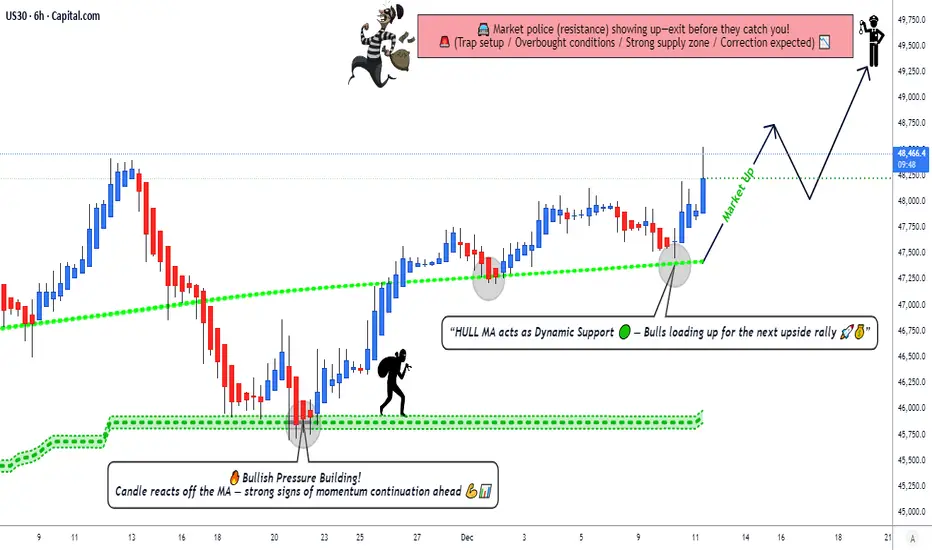
US30 Momentum Rebuild: Breakout Retest Signals Potential Upside📈 DJI30 / US30 – Dow Jones Industrial Average Trade Opportunity Guide
🏛️ Market Context
The index is showing strong accumulation pressure, with buyers stepping back in as volatility narrows. Momentum tools and trend metrics continue to lean toward the upside, creating a setup where disciplined layering becomes highly effective for precision entries.
🔥 Trade Plan – Bullish Strategy in Play
✅ Technical Confirmation
KIJUN MA accumulation indicates steady buy-side pressure building beneath price.
HULL Moving Average breakout completed with a clean pullback + retest, confirming trend continuation strength.
Market structure remains constructive with higher lows forming consistently.
🎯 Entry Plan (Layering Method Included)
Any price level can be used, but this plan uses Thief Layering Strategy for controlled scaling:
💠 Buy Limit Layers:
47,000
47,250
47,500
47,750
48,000
(Traders can add more layers depending on personal risk and capital allocation style.)
🛡️ Stop Loss (SL)
Thief SL → 46,750
Dear Ladies & Gentlemen (Thief OGs): Please adjust according to personal strategy and risk. This SL is an example, not a fixed rule. Trade with your own management principles.
🎯 Target (TP)
Main Target → 49,500
The market is approaching major moving-average resistance + overbought zones + potential trap regions. It’s wise to secure profits as the index reaches upper supply levels.
Again, Ladies & Gentlemen (Thief OGs): TP is flexible. Manage your profit bookings based on your personal approach.
🌍 Related Pairs to Watch & Correlations
1️⃣ SP:SPX / S&P 500
Often moves in high correlation with US30.
Strong bullish momentum here typically supports US30 upside.
Watch for divergence → if SPX stalls while US30 pushes, upside may weaken.
2️⃣ NASDAQ:NDX / NAS100 (Nasdaq 100)
Tracks tech sentiment, which influences overall US risk appetite.
If NAS100 shows weakness while Dow is rising, expect mixed flows → Dow may slow down but still hold structure.
3️⃣ TVC:VIX (Volatility Index)
Inverse correlation to US30.
Falling VIX = stronger risk-on behavior, supporting bullish Dow positions.
Sudden VIX spikes signal caution on existing long positions.
4️⃣ TVC:DXY (US Dollar Index)
Strong Dollar sometimes suppresses equity momentum.
If DXY drops, US30 tends to gain strength as liquidity flows to equities.
5️⃣ CBOT_MINI:YM1! (Dow Futures)
The closest real-time mirror of US30 price action.
Useful for re-entry timing during pullbacks and session gaps.
🧭 Final Notes
Stay disciplined with your own SL/TP logic, manage exposure through layered entries, and monitor correlation assets for confirmation. This is a flexible play designed for DAY & Swing traders who thrive in momentum-driven environments.
US30 Trade Secured 1500 Pipsperfect trade, sweeping London lows then IFVG on the 2m to target 1h FVG

GET READY FOR DOW30 HIGH PROBABILITY BUY SETUP SOON!!!🚨US30 HIGH PROBABILITY BUY SETUP 🚨
* Here We Can See Clearly The Next Potential Moves For DJ30 Coming Hours/Days.
* Keep Your Eyes Close On Your Trading Positions.
* Happy PIP Hunting Traders.
FXKILLA.

DOW/US30 - BEAUTIFUL CHART Team, I am looking at the US30/DOW - whatever you call it
look beautiful on the 5/15 minutes channel
Sorry, i been too lazy to post because lately I've been doing scalping
I am about to prove another challenge where $1000 turns into a million
Last account $1000 turned into 100k, took 6 months
But this challenge, I am not sure.
Anyway lets focus on the trade right now
the price is 47590-99 - long entry
STOP LOSS at 47550
Target 1 at 47650-47666
Target 2 at 47701-47715
Target 3 at 47760-47781
LETS GO
US30 Trade Set Up Dec 8 2025Price is currently in a 1h range so first i want to see either a sweep of SSL/Asia and London lows to then look for 1m-5m IFVG/CISD to target BSL and supply

Can the Dow Jones Continue Its Bullish Momentum This Week?🚀 US30/DJI Dow Jones - Bullish Pullback Opportunity 📈
Professional Market Blueprint | Swing Trade Setup
📊 TRADE OVERVIEW
Asset: US30/DJI - Dow Jones Industrial Average Index
Timeframe: Swing Trade (4H-Daily)
Bias: 🟢 BULLISH - Hull MA Pullback Strategy
Confirmation: Heikin Ashi Reversal Candle Pattern
🎯 ENTRY STRATEGY - "LAYERING METHOD" 🎯
Approach: Multiple limit orders (Professional Risk Distribution)
Layer Entry Points:
Layer 1: 46,600 🔵
Layer 2: 46,800 🔵
Layer 3: 47,000 🔵
Layer 4: 47,200 🔵
💡 Tip: Adjust additional layers based on your risk tolerance and account size
🛑 RISK MANAGEMENT
Stop Loss: 46,400
⚠️ DISCLAIMER: This is a reference level only. You manage your own risk. Adjust SL according to your strategy and risk profile.
Take Profit Target: 48,800
📌 Rationale: Moving Average resistance + Overbought zone + Trap detection
⚠️ DISCLAIMER: This is a reference level only. You manage your own risk. Take profits at your own discretion.
📈 TECHNICAL CONFLUENCE
✅ Hull Moving Average - Bullish alignment & pullback structure
✅ Heikin Ashi Reversal - Confirmation candle pattern at entry zones
✅ Moving Average Resistance - Strong rejection level near TP
✅ Overbought Divergence - Potential trap for trap traders
✅ Risk/Reward Ratio - Favorable 1:3+ setup potential
🔗 RELATED PAIRS TO WATCH - CORRELATION ANALYSIS
📍 AMEX:SPY - S&P 500 ETF (Positive Correlation - 0.92)
US30 follows broad market sentiment. SPY strength = DJI bullish momentum.
📍 NASDAQ:QQQ - Nasdaq-100 ETF (Positive Correlation - 0.85)
Tech sector performance impacts overall market. Monitor for divergence signals.
📍 AMEX:IWM - Russell 2000 (Small Cap) (Positive Correlation - 0.88)
Small-cap rotations precede index moves. Early trend confirmation signal.
📍 AMEX:GLD - Gold Spot Price (Inverse Correlation - -0.45)
Risk-on sentiment (bullish DJI) = weaker gold. Inverse hedge setup.
📍 TVC:VIX - Volatility Index (Inverse Correlation - -0.70)
Rising VIX = market fear = DJI pullback risk. Monitor at entry zones.
📍 TVC:US10Y Yield (Negative Correlation - -0.55)
Rising yields pressure equities. Check yield strength before entries.
📍 TVC:DXY - US Dollar Index (Weak Negative - -0.30)
Stronger dollar = export headwinds. Minor impact, secondary indicator.
⚡ KEY TRADING RULES
🔴 BEFORE ENTRY:
Confirm Hull MA slope is positive
Wait for Heikin Ashi reversal candle close
Check VIX & SPY alignment
Ensure no major economic events
🟢 AT ENTRY:
Use layering strategy (don't chase)
Build position gradually across 4 layers
Scale risk based on account size
Document entry price & time
🟡 DURING TRADE:
Trail stop loss after +1% profit
Monitor related pairs for divergence
Close 50% at +2% for risk-free trade
Let remainder run to target
🔵 EXIT PLAN:
Target: 48,800 (reference level)
Or: Exit on Heikin Ashi reversal signal
Or: Close on MA resistance rejection
Never hold into major news events

US30 Trade Set Up Dec 4 2025Price remains bullish so i am expecting price to sweep SSL and/or tap into 4h FVG to then look for internal 1m-5m IFVG/CISD to continue higher to PDH and higher BSL/supply

US30 Trade Set Up Dec 2 2025Price swept PDL, engulfed bearish 1h and 4h candles and is now testing 1h FVG so i will look for internal 1m-5m bullish structure followed by IFVG/CISD to take buys to PDH

US30 H1 | Bullish Bounce Off Pullback SupportMomentum: Bullish
Price is currently above the ichimoku cloud.
Buy entry: 47,553.30
- Pullback support
- 50% Fib retracement
Stop Loss: 47,362.17
- Swing low support
Take Profit: 47,750.49
- Swing high resistance
High Risk Investment Warning
Stratos Markets Limited (tradu.com/uk ), Stratos Europe Ltd (tradu.com/eu ):
CFDs are complex instruments and come with a high risk of losing money rapidly due to leverage. 70% of retail investor accounts lose money when trading CFDs with this provider. You should consider whether you understand how CFDs work and whether you can afford to take the high risk of losing your money.
Stratos Global LLC (tradu.com/en ): Losses can exceed deposits.
Please be advised that the information presented on TradingView is provided to Tradu (‘Company’, ‘we’) by a third-party provider (‘TFA Global Pte Ltd’). Please be reminded that you are solely responsible for the trading decisions on your account. Any information and/or content is intended entirely for research, educational and informational purposes only and does not constitute investment or consultation advice or investment strategy. The information is not tailored to the investment needs of any specific person and therefore does not involve a consideration of any of the investment objectives, financial situation or needs of any viewer that may receive it. Past performance is not a reliable indicator of future results. Actual results may differ materially from those anticipated in forward-looking or past performance statements. We assume no liability as to the accuracy or completeness of any of the information and/or content provided herein and the Company cannot be held responsible for any omission, mistake nor for any loss or damage including without limitation to any loss of profit which may arise from reliance on any information supplied by TFA Global Pte Ltd.

US30 H4 | Bullish Bounce Off Key SupportMomentum: Bullish
Price is currently above the ichimoku cloud.
Buy entry: 46,850
- Strong pullback support
- 38.2% Fib retracement
- 61.8% Fib projection
- Fair Value Gap
Stop Loss: 46,316.29
- Swing low support
Take Profit: 47,519.70
- Swing high resistance
High Risk Investment Warning
Stratos Markets Limited (tradu.com/uk ), Stratos Europe Ltd (tradu.com/eu ):
CFDs are complex instruments and come with a high risk of losing money rapidly due to leverage. 70% of retail investor accounts lose money when trading CFDs with this provider. You should consider whether you understand how CFDs work and whether you can afford to take the high risk of losing your money.
Stratos Global LLC (tradu.com/en ): Losses can exceed deposits.
Please be advised that the information presented on TradingView is provided to Tradu (‘Company’, ‘we’) by a third-party provider (‘TFA Global Pte Ltd’). Please be reminded that you are solely responsible for the trading decisions on your account. Any information and/or content is intended entirely for research, educational and informational purposes only and does not constitute investment or consultation advice or investment strategy. The information is not tailored to the investment needs of any specific person and therefore does not involve a consideration of any of the investment objectives, financial situation or needs of any viewer that may receive it. Past performance is not a reliable indicator of future results. Actual results may differ materially from those anticipated in forward-looking or past performance statements. We assume no liability as to the accuracy or completeness of any of the information and/or content provided herein and the Company cannot be held responsible for any omission, mistake nor for any loss or damage including without limitation to any loss of profit which may arise from reliance on any information supplied by TFA Global Pte Ltd.
