SHORT ON US30Us30 has created a head and shoulder pattern at a major supply area/zone.
FOMC is coming out in a few minutes and this could be a major catalyst to US30 falling.
Strictly going off technical's with the chart. Looking to make 1k-2k points.
Us30sell

US30 Trade Set Up Dec 9 2025Price remains bearish making LH/LL on the 1h so i will wait for a reaction from London lows being swept before looking for internal 1m-5m internal bearish structure to continue lower to demand and SSL

US30 Trade Set Up Dec 3 2025Price failed to make a HH on the 1h, swept PDH and has reversed so i will look for internal 5m-15m bearish structure to target PDL

US30 Trade Set Up Nov 18 2025Price is showing strong bearish movement, creating LL/LH on the 1h and 15m and has BOS on the 15m so first id want to see price sweep internal BSL and tap into 15m or 1h FVG before looking for a continuation back down to lower SSL and 4h FVG

US30 Trade Set Up Nov 14 2025I am expecting price to continue it bearish trend to sweep lower SSL but first i want to see a slight pullback into 1h FVG before continuing its trend

US30 Trade Secured 1500 PipsPrice inverted a 1h FVG in London session then broke structure to the downside on the 15m, came up to sweep BSL to then target PDL

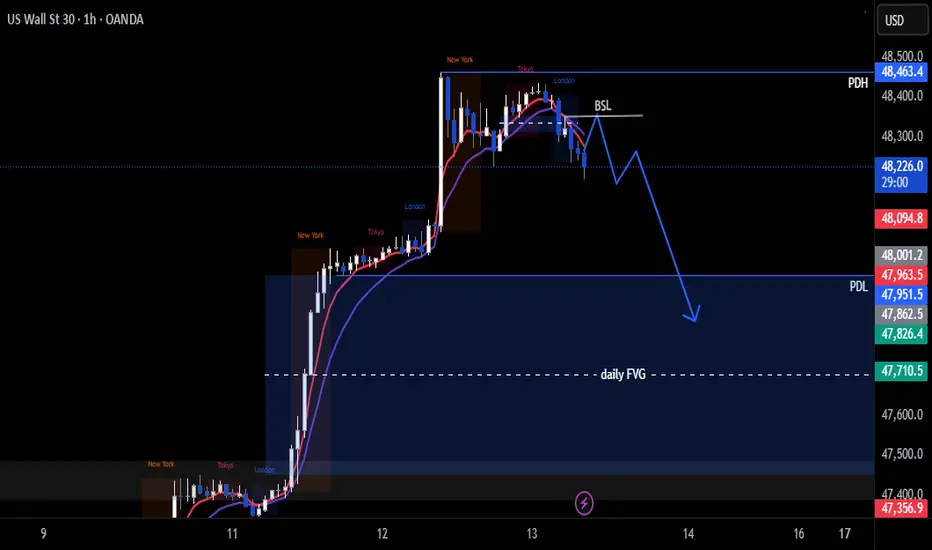
US30 Trade Set Up Nov 13 2025Price reached ATH yesterday during New York session but has closed under it during Asia and London and left a big daily gap that i am expecting price to target so i will wait for a internal BSL sweep followed by IFVG/CISD to target daily FVG
US30 Trade Set Up Nov 7 2025Indices remain under bearish pressure so i will only be looking for sells but first i want to see internal BSL or London high BSl swept first followed by 1m-5m IFVG/CISD to take sells down to 4h FVG and lower SSL levels

US30 Risky Short!
HI,Traders !
#US30 is growing now
But a horizontal resistance
Level of 47513.8 from where
We will be expecting a local
Pullback and a local move down !
Comment and subscribe to help us grow !

DOW JONES 30 HIGH PROBABILITY SETUP SOON!!!🚨 DJ30 HIGH PROBABILITY SELL SETUP 🚨
* Here We Can See Clearly The Next Potential Moves For US30 Coming Hours/Days.
* Keep Your Eyes Close On Your Trading Positions.
* Happy PIP Hunting Traders.
FXKILLA.

US30 Short From Resistance!
HI,Traders !
#US30 went up sharply
But the price will soon hit
A wide horizontal resistance
Of 46641.8 from where we will
Be expecting a pullback and
A local move down !
Comment and subscribe to help us grow !

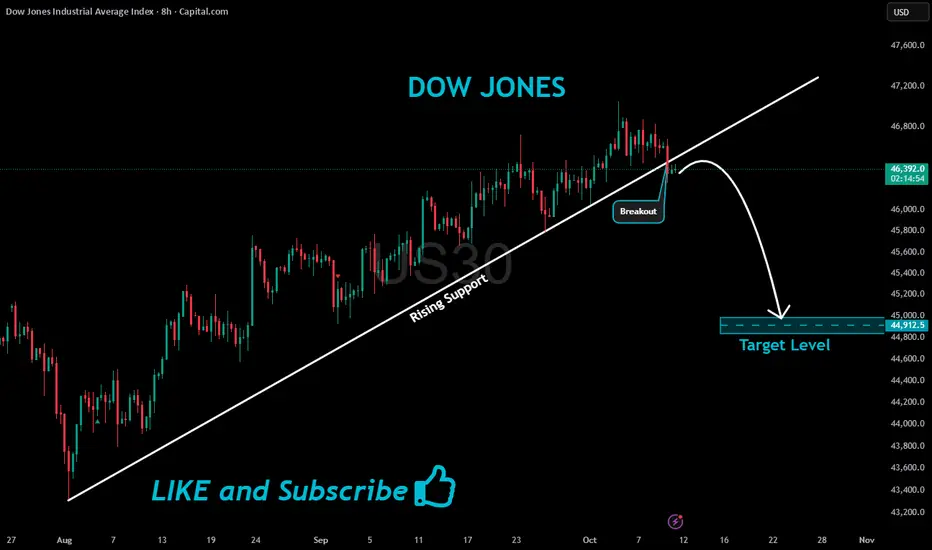
US30 Bearish Breakout!
HI,Traders !
#US30 made a bearish
Breakout of the rising support
Line and we are bearish biased
So we will be expecting a
Further bearish move down !
Comment and subscribe to help us grow !
Us30 Trade Set Up Secured 1500 Pips!Set Up played out perfectly with BSL being swept, CISD on the 1m and 5m to target PDL
cant get any cleaner then that

US30 Resistance Cluster Above!
HI,Traders !
#US30 made a bearish
Breakout of the support
Cluster of the rising and
Horizontal support levels
Which is now a resistance
Cluster round 46329.8 then
Went down and made a local
Pullback on Thursday and
Friday but we are bearish
Biased mid-term so we
Will be expecting a further
Bearish move down this week !
Comment and subscribe to help us grow !

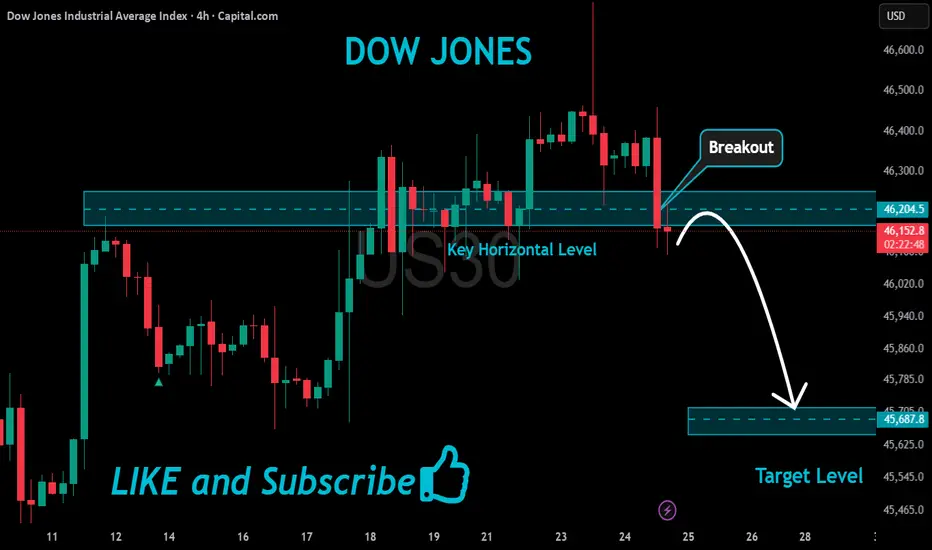
US30 Bearish Breakout!
HI,Traders !
#US30 made a bearish
Breakout of the key horizontal
Level of 46203.3 which is now
A resistance and the breakout
Is confirmed so we are bearish
Biased and we will be expecting
A further move down !
Comment and subscribe to help us grow !
US30 Resistance Ahead!
HI,Traders !
#US30 keeps growing
In an uptrend but the
Index will soon hit the
Horizontal resistance
Of 45700.0 from where
We will be expecting a
Local bearish correction !
Comment and subscribe to help us grow !

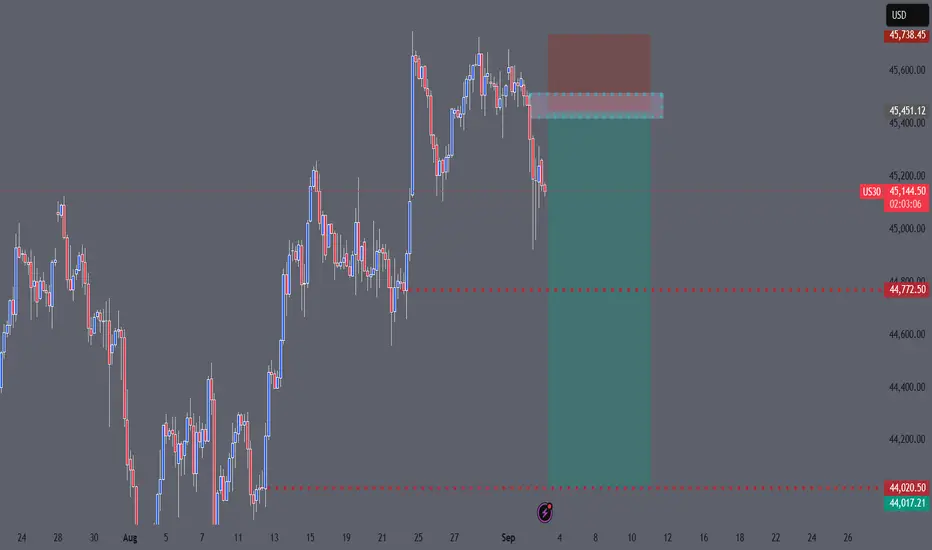
US30 WILL BLEEDWe are entering a short (sell) trade on US30 because the market failed to create new highs and reversed from a strong resistance/supply zone with good breakout, Structure and momentum now favor the downside. Targets are set at 44,770 and 44,020, with a stop above 45,740 to manage risk.
Us30 Trade Set Up Sep 2 2025FX:US30
www.tradingview.com
Price has dumped due to tariff talks and has swept PDL and a daily SSL so i am expecting price to pull back to test 30m FVG before continuing down
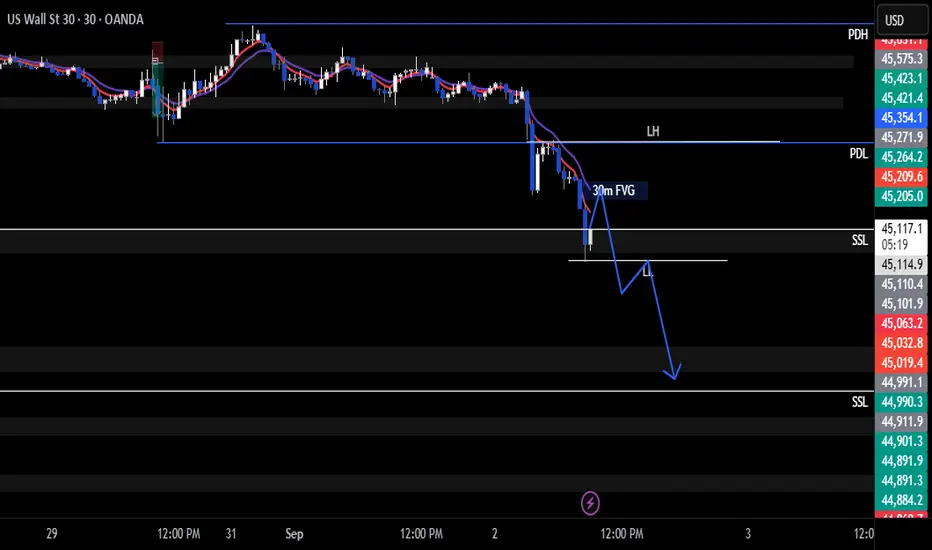
Us30 1500 Pips SecuredFX:US30
www.tradingview.com
BSL swept on the 15m followed by 2m IFVG to target PDL

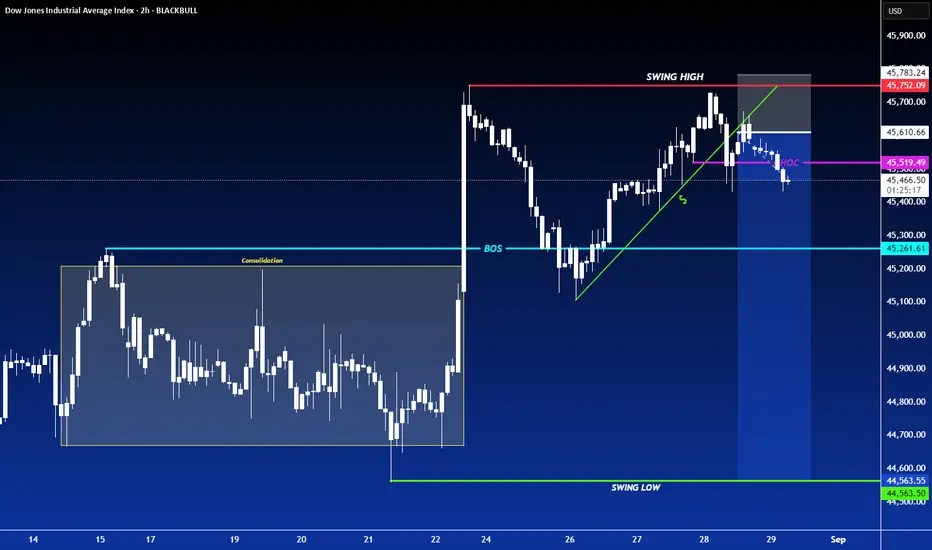
SHORT ON US30US30 has given us a CHOC to the downside after a long time run up.
I will be selling US30 to the consolidation zone looking to catch 1000 points over the next few days.
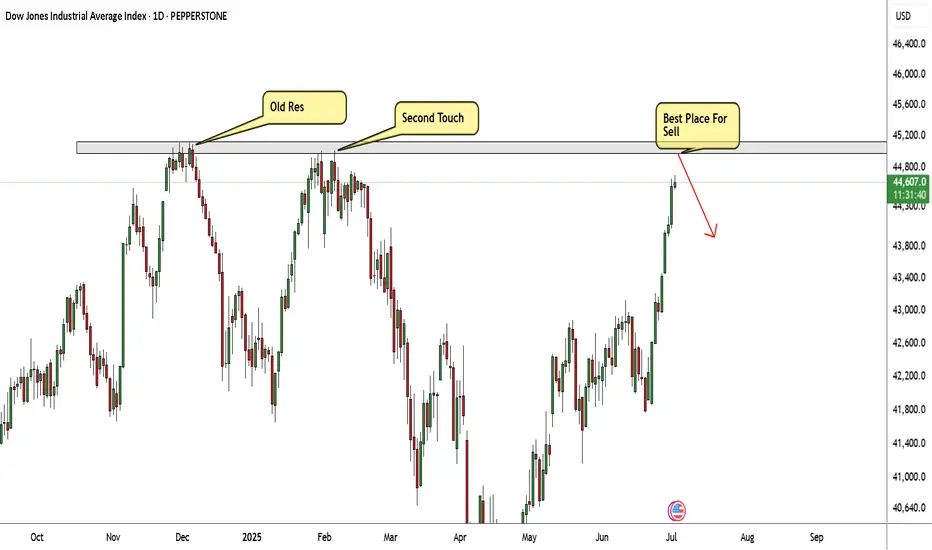
US30 Very Near Strong Res Area , Short Setup To Get 500 Pips !Here is my US30 Daily Chart , the price very near the highest price area , this res area forced the price to go down very hard 2 times so i think this time will be the biggest movement to downside , so i`m waiting the price to touch it and give me a good bearish price action and then we can enter a sell trade and targeting at least 500 pips . if we have a daily closure above then this idea will not be valid .
US30 – Bearish Setup Below Resistance Zone US30 – Bearish Setup Below Resistance Zone 🚨🟥
The US30 index is exhibiting signs of bearish momentum after repeated rejections from the key resistance zone near 43,200. Let's break down the technical picture:
🔍 Technical Analysis
📌 Resistance Zone (🟥 43,200 area)
Price was rejected twice from this resistance (marked by red arrows), showing strong seller presence.
Bearish candlesticks followed each touch, confirming exhaustion near this level.
📌 Support Zone (🟦 40,800 area)
The area around 40,800 has acted as a strong demand zone in the past (highlighted with green arrows and orange circles).
Price might revisit this area if current bearish structure continues.
📌 Intermediate Support (🟪 41,828)
This level serves as short-term support.
If broken, it could accelerate the decline toward the major support.
📌 Market Structure
Lower highs forming after each bounce indicate weakening bullish strength.
A potential bearish breakout pattern is forming (highlighted by the projected path).
📈 Conclusion & Trade Outlook
Bias: Bearish 📉
Trigger: Break below 41,828 support
Target: 40,800 zone
Invalidation: Break and close above 43,200 resistance

US30 Technical Analysis – 8th June 2025c US30 Technical Analysis – 8th June 2025
🔍 Chart Overview:
The chart shows a classic range-bound structure with clearly defined support and resistance zones.
📍 Key Zones:
🔼 Resistance Zone: ~$42,900 – $43,000
Marked by multiple rejections (🔴 red arrows).
Price has failed to close above this area convincingly.
Sellers are actively defending this level.
⚠️ Bearish pressure likely to increase if price stays below this level.
🔽 Support Zone: ~$41,750 – $41,850
Marked by strong bullish reactions (🟢 green arrows).
Buyers have stepped in consistently in this demand zone.
A breakdown below this level could trigger further downside momentum.
📈 Current Price Action:
The price is hovering around $42,781.3, just below the resistance zone.
The latest candlestick shows rejection from the top, forming a bearish wick, indicating potential reversal pressure.
The large downward arrow (⬇️) on the chart suggests a bearish bias is expected by the analyst.
📉 Outlook & Strategy:
🔻 Bearish Scenario (High Probability):
If price fails to break and sustain above $43,000, expect a move back down towards the support zone at ~$41,800.
A breakdown below support could lead to deeper downside, targeting $41,500 or lower.
🛑 Invalidation:
A clean breakout and daily close above $43,000 would invalidate the bearish setup and suggest potential continuation higher.
🎯 Trading Tips:
🔹 Short Bias: Look for short entries near resistance with tight stops above $43,000.
🔹 Target: $42,200 → $41,800
🔹 Risk Management: Always maintain a good risk-to-reward ratio and use proper stop-loss.
📌 Conclusion:
⚠️ The chart favors a bearish reversal from resistance unless bulls can push decisively above $43,000. Traders should watch for rejection patterns or breakdown confirmations to align with the bearish move
