Us30 Trade Set Up Sep 5 2025FX:US30
www.tradingview.com
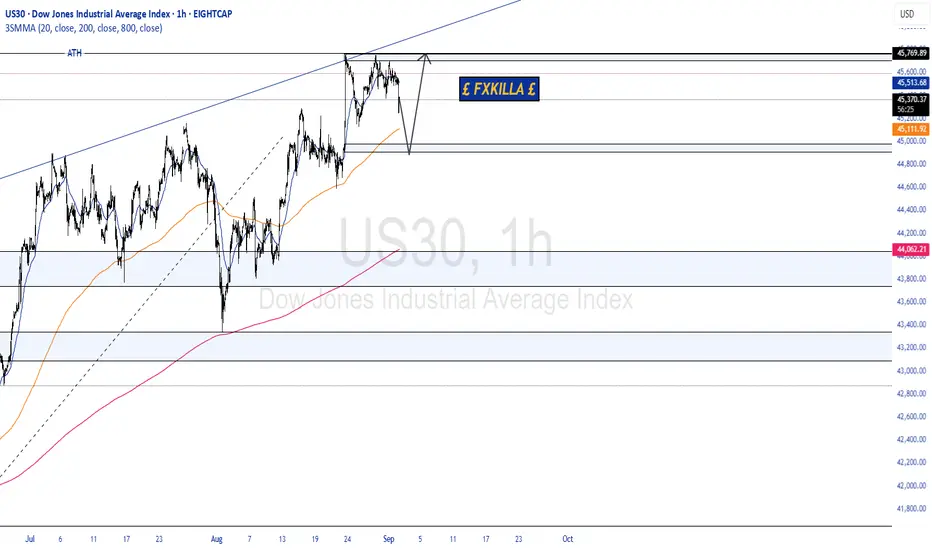
price is making HH/HL and is testing ATH soon so i will be waiting for a pullback into 15m FVG then a continuation higher
Us30setup

US30 Bullish Setup: From Pullback to Measured Moves📊 The US30 (Dow Jones) is trending bullish on the 4-hour chart ⏰. We’ve just seen a pullback into equilibrium ⚖️, and I’ve taken a long position 📈. In the video 🎥, I break down how I set my targets 🎯 using the Fibonacci retracement 🔢 — first identifying the equilibrium pullback, then projecting measured moves above for profit targets 🚀. (Not financial advice ⚠️)

Us30 Trade Set Up Sep 4 2025FX:US30
www.tradingview.com
Price has made a HH but hasnt broken out of it so i want to see price test SSL and either close above with a 1m-2m IFVG to go higher or close under to go down towards PDL

Us30 Trade Set Up Sep 3 2025FX:US30
www.tradingview.com
price has made LH but a HL and has respected a 1h FVG multiple times so i am expecting price to continue lower towards PDL

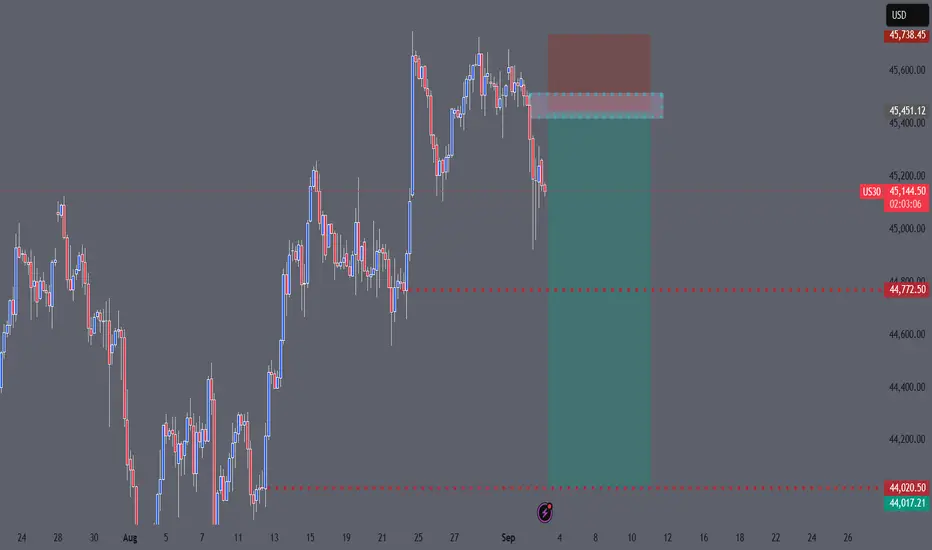
US30 WILL BLEEDWe are entering a short (sell) trade on US30 because the market failed to create new highs and reversed from a strong resistance/supply zone with good breakout, Structure and momentum now favor the downside. Targets are set at 44,770 and 44,020, with a stop above 45,740 to manage risk.
Us30 Trade Set Up Sep 2 2025FX:US30
www.tradingview.com
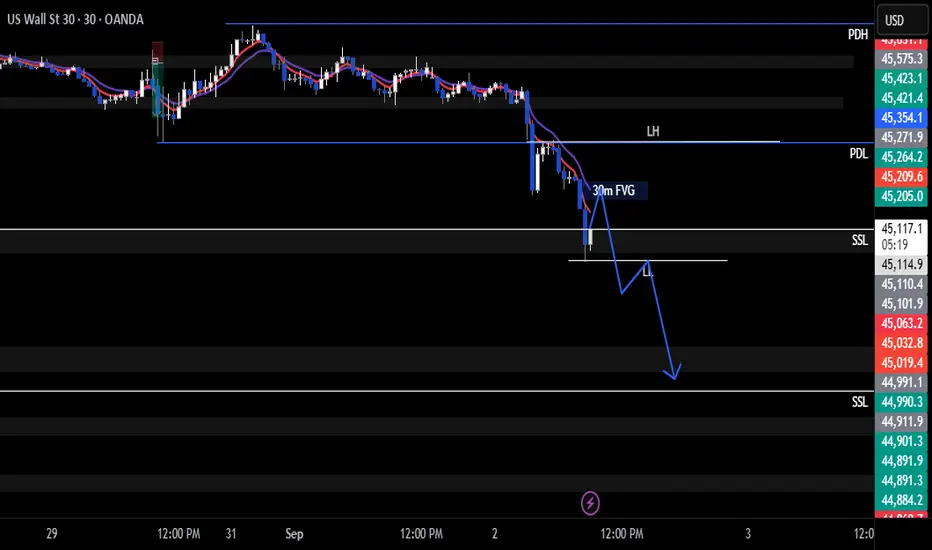
Price has dumped due to tariff talks and has swept PDL and a daily SSL so i am expecting price to pull back to test 30m FVG before continuing down
DOW JONES HIGH PROBABILITY SETUPS SOON!!🚨 US30 HIGH PROBABILITY SELL/BUY SETUPS 🚨
*Here We Can See Clearly The Next Potential Moves For US30 Coming Hours/Days.
* Keep Your Eyes Close On Your Trading Positions.
* Happy PIP Hunting Traders.
£ FXKILLA £
Us30 Trade Set Up Sep 1 2025FX:US30
www.tradingview.com
Price is in a bigger time frame consolidation but on the 1h it has made LH/LL and swept PDH already so overall i will be looking for sells either under this key level or a test of 1h FVG before targeting PDL as sellside liquidity

Us30 1500 Pips SecuredFX:US30
www.tradingview.com
BSL swept on the 15m followed by 2m IFVG to target PDL

Us30 Trade Set Up Aug 29 2025FX:US30
www.tradingview.com
Us30 has made LH/LL on the 1h so i will generally be looking for sells once price sweep BSL and forms 1m IFVG. But if price closes above it could target LH as buy side liquidity before coming down

Us30 Trade Set Up Aug 28 2025FX:US30
www.tradingview.com
Price has made HH/HL on the 1h so if price can remain above HL and the 1h FVG i can see it testing BSL before coming down but if price can close under HL and invert 1h FVG i will look for sells down to SSL and PDL

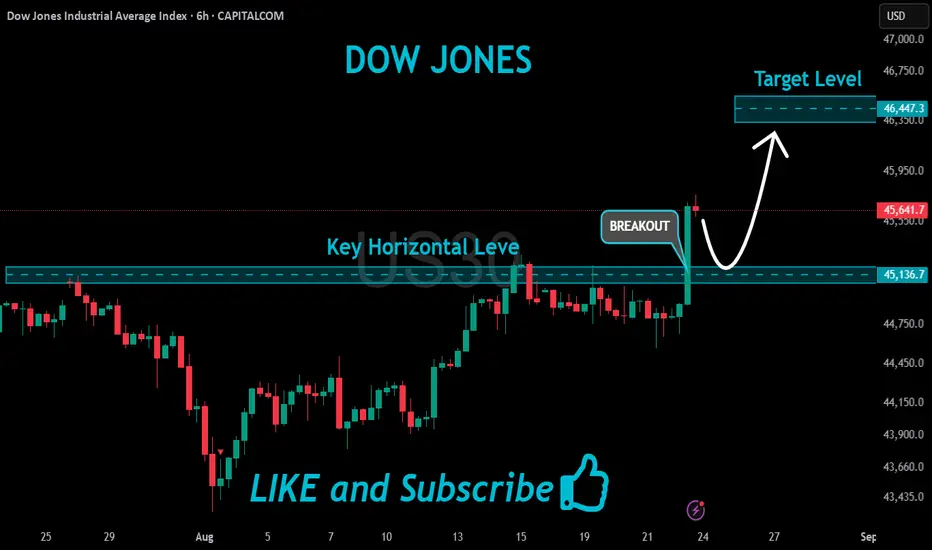
US30 Will Keep Growing!
HI,Traders !
#US30 is trading in an
Uptrend and the bullish
Breakout reinforces our
Bullish bias so after the
Potential pullback and retest
Of the new support of 45136.7
A further bullish continuation
Is to be expected !
Comment and subscribe to help us grow !
Us30 1500 pips set upFX:US30
www.tradingview.com
was a slow day but out set up played out securing a total of 1500 pips
the target was buy side liquidity

US30 Trade Set Up Aug 25 2025FX:US30
www.tradingview.com
Us30 Trade Set Up: price has created a huge gap between HH/HL so i want to see more price action play out but we got sell side liquidity on the 15m that can be tested. If price sweeps and closes above i will look for buys but if price closes below we could see the start of a bigger pull back down before continuing higher

US3o Trade Set Up Aug 22 2025www.tradingview.com
FX:US30
Us30 Trade Set Up: price is making HH/HL on the 1h and is close to testing PDH, so i will wait to see if price closes above HH and PDH to continue higher towards BSL or if price sweeps PDH as liquidity, closes under and forms internal IFVG+CISD to go lower towards HL/PDL

US30 Outlook: Waiting for Range Break Confirmation Dow JonesI’m looking at the US30 📊 right now, and price is currently range-bound 🔄, reflecting ongoing pressure in the market. While I’m watching closely for an opportunity, it’s important to recognize when to step aside and wait for the market to set up 🕰️. If we see a break below the current range low followed by a retest ⬇️, that could present a selling opportunity. Conversely, if price breaks higher and retests the previous high ⬆️, that could offer a buy setup. For now, I’m remaining on the sidelines 🪑 until one of these scenarios unfolds with the momentum I’m looking for 🚀. (Not financial advice.)

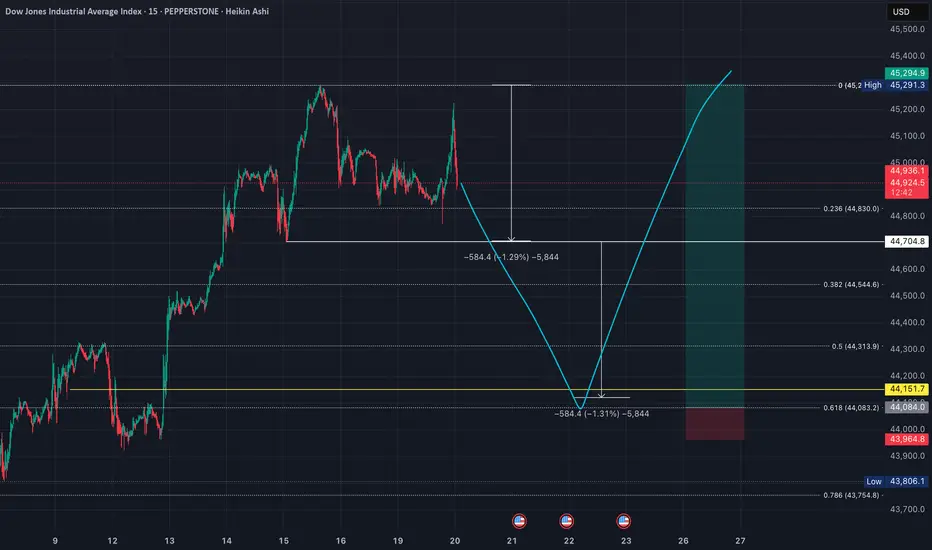
US30 (DOW): Equal Leg Projection Meets Fibonacci - Long SetupSharing my outlook on the Dow, which aligns with my NASDAQ analysis but with a specific mathematical approach. 📊
**🎯 The Setup:**
I'm targeting a long position based on an equal leg projection. Taking the range from the recent low to the all-time high, I expect a decline equal to that same distance. This projection perfectly coincides with the 0.618 Fibonacci level - a powerful confluence. 🎯
**📍 Entry Strategy:**
The beauty of this setup is the mathematical precision: the equal leg down from the high lands exactly at the 0.618 Fib level. This confluence gives me high confidence in this support zone for a potential long entry. ✅
**⚠️ Risk Management:**
Stop loss would be placed below the projected low, targeting new all-time highs. Clean entry, clear invalidation level. 🛑
**🧠 Why This Works:**
Equal leg projections are powerful tools in market analysis. When combined with key Fibonacci levels, they create high-probability reversal zones. The market often respects these mathematical relationships. 📐
**🔄 Bigger Picture Alignment:**
This setup aligns with my broader market view - expecting one final push higher before any significant correction. The Dow's equal leg projection gives us a precise entry point for this bullish thesis. 📈
**💡 Key Insight:**
When geometric projections align with Fibonacci levels, it creates what I call "mathematical harmony" in the markets. These setups often provide the best risk-adjusted opportunities. 🎵
📈 **This trade setup offers a risk-to-reward ratio of 10:1.** Without including fees, the breakeven win rate for this trade would be approximately 9.09%. Knowing these figures in advance helps me avoid emotional trading. 🧠
💡 **Pro Tip**: If you often find yourself trading based on emotions, I recommend doing this type of pre-planning and quantifying your setups before execution — it can be a simple yet highly effective improvement. ✅
---
**Trading is simple.** You don't need multiple indicators or dozens of lines on your chart. A clean and simple chart often works best — it keeps your decisions consistent and reduces uncertainty. Sure, it might not look flashy, and my analysis may seem a bit "plain" compared to others… but that's how I like it. If you find this analysis useful, feel free to follow me for more updates.
---
*Disclaimer: This post is for general informational and educational purposes only. It does not constitute financial advice, investment recommendation, or a service targeting specific investors, and should not be considered illegal or restricted information in any jurisdiction.*
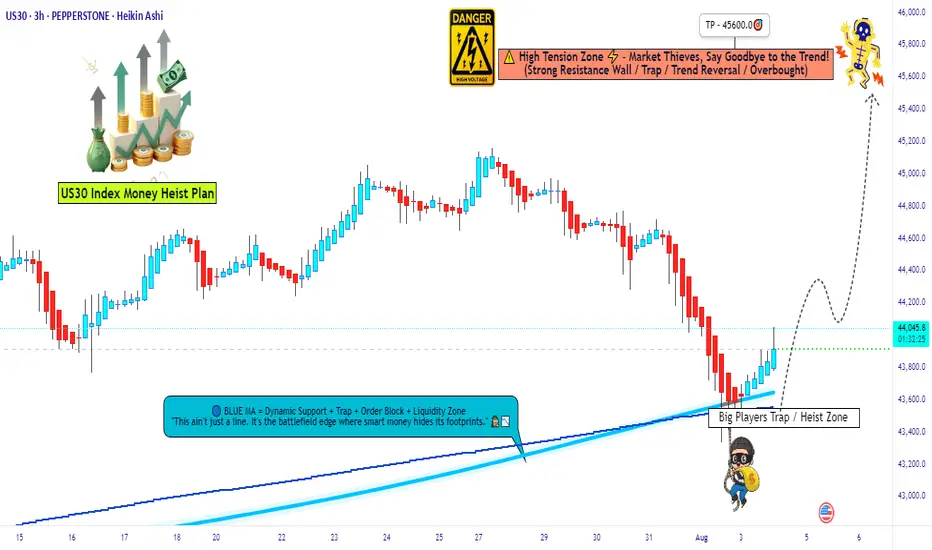
Heist Alert: Dow 30 Bullish Surge Incoming – Lock In Targets🦹♂️💎 “US30 Gold Vault Heist” – Thief’s Bullish Break-In Plan! 🚨📈
(Brought to you by Thief Trader – Layered Entry. Zero Mercy. Big Bags.)
🌍 Welcome to the Heist Floor, Global Market Bandits!
🎯 US30 is the next vault on the hitlist – and we’re going in loud but calculated.
💣 The Setup: Bullish Raid in Progress!
The Thief has eyes on Wall Street's armored vault — US30 Index — gearing up for a multi-layered bullish assault.
💼 Using limit orders like C4 on the door hinges, we’re stacking precise entries for maximum loot extraction. This isn’t gambling — this is organized market crime.
🔓 Entry Protocol – Any Price Level Is Breachable
🪜 Layered Limit Orders: Entry at any market level, multiple orders spread like a thief’s toolkit.
No sniper candle required — we work the shadows and stack with precision.
(Use the 15m-1H TF to tighten your strike zone.)
🛑 Stop Loss – The Getaway Hatch
📍 SL parked at 43300.0 – if the mission fails, we vanish clean.
No chasing losses — the next heist awaits.
📈 Take Profit – The Loot Vault
🎯 Target: 45600
That’s the gold room, the top floor, the getaway car location.
Use trailing SLs to secure the bag mid-run if resistance agents start showing up.
🧠 Behind the Heist – What’s Fueling This Move?
Global risk-on tone? ✅
Dow futures resilience? ✅
Thief’s sentiment meter flashing GREEN? ✅
Index rebalancing & sector flow favoring bulls? ✅
We don’t just trade the chart. We rob the macro narrative.
🚫 News Caution – No Sudden Sirens
Avoid entering during red folder data drops or FOMC speeches.
Stay ghosted. Let the volatility settle, then strike. 🕵️♂️
💥 Smash the BOOST Button 💖 If You’re With the Crew!
Let’s run this like a proper cartel of information — share it, save it, tag your trader circle.
Every like supports the next robbery plan.
No signals. No fluff. Just pure market exploitation.
📌 Disclaimer: Educational analysis only. No financial advice. Manage your risk like a true thief — never expose the whole bag.
💼📊 Thief Trader Out — More heist maps coming soon.
🔐 Rob Smart. Stack Heavy. Run Fast. 🦹♂️💸📈
US30 Robbery Blueprint: Breakout, Pullback, Escape Setup💎 Dow Jones Robbery Blueprint: The US30 Vault Crack Plan 💎
(Maximized for reach — within TradingView title limit)
🌟Hi! Hola! Ola! Bonjour! Hallo! Marhaba!🌟
Dear Market Robbers & Money Movers 🕵️♂️💰🚨
This ain't your average analysis — it’s a Thief Trader-style 🔥tactical mission🔥 aimed at the mighty "US30/DJI" (Dow Jones Industrial Average). We're talkin' about a precision heist with a full blueprint: entry zones, trap setups, and escape exits. Read carefully — this ain’t for the faint-hearted traders! 🧠🦾
🧠 Entry Zones (The Break-In) 📈
🛠 ENTRY 1: Crack the wall near 44700.00 – that’s the resistance gate. Wait for confirmation.
🎯 ENTRY 2: Sneak in at the Market Makers’ Trap around 43500.00 – a dirty zone where retailers get baited. Perfect time to strike long!
🧱 DCA/Layering strategy recommended. Stack those buy orders like a thief layering explosives on a safe. 💣💸
🛑 Risk Levels (Escape Routes/Stop Loss)
🔊 "Listen up, vault raiders! Never drop your SL until breakout is confirmed. If you jump early, you might land in a bear trap! 🪤"
🔐 Stop Zones (Based on Strategy):
📌 Swing Buy SL (2H TF): Place at 44100.00 for the stealth buy.
🏦 Institutional SL (Swing Zone): Drop it around 43000.00
🔐 Max Risk SL (3H TF): If you're deep, your last stand is at 39200.00
☝️ SL depends on your position sizing, number of entries, and risk appetite. Trade like a thief, not a gambler.
🎯 Heist Target (Profit Exit)
🏁 Escape Point: 46200.00 — or exit before heat rises! Don’t be greedy. Rob and vanish. 💨💰
🔥 Market Mood: Why the Heist Is On
"US30/DJI" is bullish AF — thanks to:
📊 Macro-Economic Wind at Our Back
📈 Institutional momentum
📰 Strong sentiment and intermarket flows
Check your chart radar: Fundamentals + technicals aligning = green light for robbery! 🟢
⚠️ Tactical Reminder: News Can Jam the Plan
📵 Avoid new entries during major economic releases
🛡 Use trailing SLs to protect running trades
Stay alert, stay alive. 💡
❤️ Support the Robbery Crew
Hit that 💥BOOST💥 — your love fuels our next mission.
Join us and ride daily heist plans with Thief Trading Style 🏴☠️🚀💰

Dow Jones US30 Trend Analysis and Trade Plan Breakdown📈 US30 (Dow Jones) is currently in a strong bullish trend 🔥. This is clearly visible on the 4H chart, where we’re seeing a consistent pattern of higher highs and higher lows 🔼🔼.
👀 I’m watching for a potential long opportunity, especially since the higher timeframes remain firmly bullish 🟢.
🎥 In the video, we break it down:
A quick overview of the 4-hour structure
Then dive into a potential trade setup on the 30-minute chart ⏱️🔍
🧠 This is for educational purposes only and not financial advice ⚠️📚

Dow Jones Industrial Average Index - 4 Hour Chart4-hour chart of the Dow Jones Industrial Average (US30) shows a recent price movement as of July 13, 2025. The index is currently at 44,315.0, reflecting a decline of 285.5 points (-0.64%). The chart highlights a sell signal at 44,312.0 and a buy signal at 44,318.0, with a shaded area indicating a potential downward trend from a recent peak. Key price levels include 44,855.7 (high) and 43,902.2 (low), with a support level around 44,315.0.

US30 Local Short!
HI,Traders !
US30 index is moving in a sideways
movement Over the medium term down
Again and will soon hit
A horizontal support
Of 44482.4 from where
We will be expecting a
Local bullish rebound !
Comment and subscribe to help us grow !

Us30 h4 next move Rejection near BoS
2. Break below support zone
3. Lower high formation
4. Bearish continuation towards 43,250
