US30 Technical Outlook | Bullish Bias Active📈 US30 – Dow Jones Industrial Average (CFD)
Bullish MA Pullback Setup | Day & Swing Trade Plan
Asset: US30 – Dow Jones Industrial Average (DJIA) CFD
Bias: 🟢 Bullish
Strategy Type: Moving Average Pullback Continuation
Trading Style: Structured Layered Entries
🔍 Market Structure & Technical Outlook
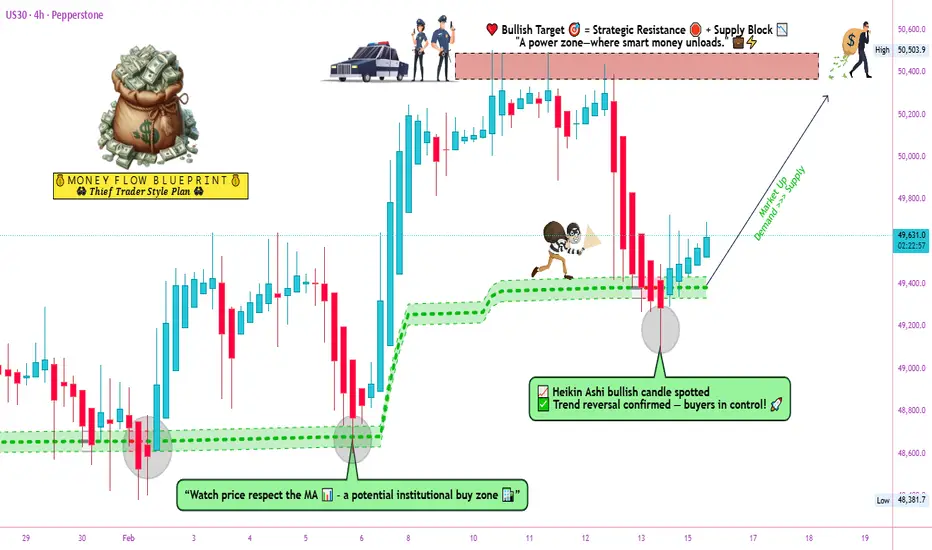
The US30 (DJIA CFD) is showing a healthy pullback into dynamic support (MA zone), maintaining overall bullish structure on higher timeframes.
We are trading trend continuation, not breakout chasing.
✅ Confirmation Factors:
Price holding above key higher-timeframe support
SMA acting as dynamic pullback support
Bullish market structure (HH & HL sequence intact)
Momentum cooling before potential expansion
🎯 Entry Plan – Layered Limit Structure
Rather than market chasing, structured limit positioning improves risk efficiency.
Layered Entry Zones:
49,200
49,400
49,600
This approach allows better average positioning within the pullback zone while respecting volatility.
🛑 Risk Management
Stop Loss: 49,000
If structure breaks below this zone, bullish thesis becomes invalid.
🚀 Target Plan
Primary Target: 50,400
Why this level?
Psychological round number
Prior reaction zone
Potential overbought expansion area
Supply/resistance confluence
⚠️ Partial profit booking before the final target is always professional practice.
🔗 Correlated Markets to Watch
Monitoring correlations increases probability alignment.
💵 TVC:DXY (US Dollar Index)
Strong dollar can pressure equities.
Weak dollar typically supports risk-on flows.
📊 S&P 500 ( SP:SPX / US500)
Strong positive correlation.
If S&P breaks higher, US30 likely follows.
📈 NASDAQ ( NASDAQ:NDX / US100)
Tech-driven momentum often leads overall US indices.
🛢 Crude Oil ( BLACKBULL:WTI )
Rising oil → inflation pressure → rate expectations → equity sensitivity.
🏦 US10Y Treasury Yield
Higher yields can cap equity upside.
Falling yields support bullish expansion.
📰 Fundamental & Economic Drivers
Key factors to monitor before and during this trade:
🇺🇸 US Inflation (CPI / PCE)
🇺🇸 Non-Farm Payrolls (NFP)
🇺🇸 Federal Reserve rate decisions & speeches
US Bond Yield movement
Corporate earnings from major Dow components
If inflation cools and yields soften → bullish continuation strengthens.
If yields spike aggressively → expect volatility.
🧠 Professional Trade Notes
Do not blindly follow TP or SL levels.
Always manage according to your own risk profile.
Consider scaling out at intraday resistance zones.
Avoid entering during high-impact news spikes unless planned.
💬 Trading Mindset
📌 “Discipline builds accounts. Impulse destroys them.”
📌 “We trade probabilities, not predictions.”
📌 “Structure first. Emotion last.”
📌 “Take money from the market — don’t donate to it.”
Stay sharp. Stay structured.
Execute with patience.
If this setup aligns with your plan, tap ❤️ and share your view below.
Let’s build disciplined traders, not gamblers.
Us30signal
US30 Trade Set Up Feb 16 2026Price is making bullish structure on the 1h but still overall bearish on the daily and 4h making LH/LL so i will wait for price to sweep PDH, tap into daily gap and want to see the 1h FVG inverted with internal bearish structure on the 5m to trade lower

US30 Will Grow !
HI,Traders !
#US30 is trading in a
Strong uptrend but is
Making a bearish correction
However, a strong long-term
Rising support is ahead
From where we will be
Expecting a local
Bullish rebound !
Comment and subscribe to help us grow !

US30 Trade Set Up Feb 13 2026Price is overall bearish on the 4h but making HL on the 1h and 15m so i if prices inverts the 1h FVG i will expect price to trade higher to fill the 4h FVG otherwise if price respects the 1h FVG, makes bearish structure on the 5m with a 1m-5m IFVG/CISD i will take sells to London lows

US30 Trade Set Up Feb 12 2026Price is making HL/HH on the 1h and 15m, and has swept London highs. I will wait to see if we break and close above London highs to target PDH or close under and make internal bearish structure and 1m-5m IFVG/CISD to target PDL

US30: The Correction is Coming? (Dump) US30 just swept the 50,250 liquidity and is showing a clear rejection. After such an aggressive rally, a retracement is overdue to rebalance the market.
The Setup:
Target: The 8H Order Block (OB) at 48,650.
Reason: Price left a massive imbalance/gap that acts like a magnet. 🧲
Invalidation: A daily close above 50,300.
The Play:
Looking for a smooth ride down to the gray zone. If we hit the OB, I'll be looking for a potential long reversal, but for now, the bears are in control.

US30 Trade Set Up Feb 11 2026Price is making HH/HL on the 4h and 1h keeping the uptrend but if price sweeps PDH and makes internal bearish structure and forms IFVG/CISD on the 1m-5m i will take sells down to London lows and PDL

US30 Trade Set Up Feb 10 2026Price is making LH/LH on the 1h and has failed to create a new ATH so i will expect price to either sweep London highs to trade lower or form a 1h bearish FVG to trade lower from there to target PDL

US30 Trade Set Up Feb 9 2026Price has made a new ATH and is trading in a 4h FVG so if it respects it and sweep London lows i will look for internal 1m-5m IFVG/CISD to target London highs

US30 Bullish Breakout!
HI,Traders !
#US30 is trading in a strong
Uptrend and the price made a
Bullish breakout of the key
Horizontal level of 49586.5
So we are bullish biased
And we will be expecting a
Further bullish move up !
Comment and subscribe to help us grow !

US30 Trade Set Up Feb 6 2026Price is still in a overall bearish downtrend on the 1h and 4h so i will be looking for sells after sweeping London highs followed by 1m-5m IFVG/CISD to target the 1h FVG and if if inverts the 1h i will target london lows

US30 Short From Resistance!HI,Traders !
#US30 is once again
About to retest a horizontal
Resistance level of 49562.3
Which is a strong supply
Area from where a local
Bearish pullback is to
Be expected !
Comment and subscribe to help us grow !

US30 Trade Set Up Feb 5 2026Price is making LH on the 1h, and LL on the 15m and has inverted a 1h FVG so i will expect price to trade into the 15m FVG before looking for internal 1m-5m bearish structure to trade to PDL

US30 Trade Set Up Feb 4 2026Price is overall still bullish making HH/HL on the 1h and 4h but price respected the 1h supply so i will expect price to sweep Asia and London lows and/or tap into the 1h FVG before continuing bullish

#US30 Sell Trade Scenario.Here’s an up-to-date US30 Sell trade outlook (technical + fundamental) to help you assess whether positioning for a Downside makes sense right now.
Thank You......

US30 Trade Set Up Feb 3 2026Price failed to sweep PDH and left a big 4h FVG below along with a 30 min IFVG so i will expect price to trade to fill 50% of the 4h FVG

US30 Trade Set Up Feb 2 2026Price has change state on the 4h after sweep PDL and has made HL on the 4h and daily so i am overall im bullish if we respect the 15m fvg and form bullish IFVG/CISD on the 1m-5m to target PDH but if price trades through the 15m FVG i can see price retesting the 4h CISD

US30 Trade Set Up Jan 30 2026Price is under bearish pressure and is trading in a range so i will like to see London highs swept to then make 1m-5m IFVG/CISD to trade lower towards London lows and the 1h demand below

#US30 Sell Trade Scenario.Here’s an up-to-date US30/USD Sell trade outlook (technical + fundamental) to help you assess whether positioning for a Downside makes sense right now.
Thank You......

US30 Trade Set Up Jan 29 2026Price has pushed up swept PDH and respected a bearish 4h FVG. Price is within 1h range but making HL so if we get a sweep of London lows and respect the 1h FVG i will look for 1m-5m IFVG/CISD to trade higher to London high BSL but if price trades through the 1h FVG and makes bearish structure i will look for sells to PDL

US30 Trade Set Up Jan 28 2026Price has swept London lows and is consolidating under a 4h FVG so i price can make internal bullish structure on the 1m-5m with a bullish IFVG/CISD i will take buys to BSL and higher 4h FVG or if price trades to PDL i will look for a buys set up from there

US30 Trade Set Up Jan 27 2026Price has inverted a 4h FVG and is making LH/LL on the 1h so i will want to see some kind of pullback into a FVG followed by a 1m IFVG/CISD to continue towards PDL

US30 Trade Set Up Jan 26 Price is making internal bullish structure but on the 4h its making bearish structure so i will expect price to test the 1h FVG and if it respects it with internal IFVG/CISD to the downside i will takes sells to Asia lows
