US30 Trade Set Up Jan 16 2026Price is making LH/LL on the 15m and is making LH/LL on the 1h and 15m, inverted a 1h bullish FVG and is currently respecting a bearish 1h FVG so as long as price continues to make internal bearish structure i will look for sells into the 4h FVG and possibly towards PDL
Us30update

US30 Trade Set Up Jan 13 2026Price pushed higher sweeping PDH and London/Asia highs so i will expect price to sweep London lows and/or tap into 4h FVG to then trade higher to ATH again

US30 Trade Set Up Jan 12 2026Price is making LL/LH on the 1h indicating aa bearish trend so i will wait for either the 1h FVG to be filled or London highs to be swept before looking for internal 1m-5m IFVG/CISD to target London lows and lower SSL

US30 Trade Set Up Jan 9 2026price is making HH/HL and has now broken above PDH so i will want to see a pullback into a 5m-15m FVG to then look for buys to BSL/ATH

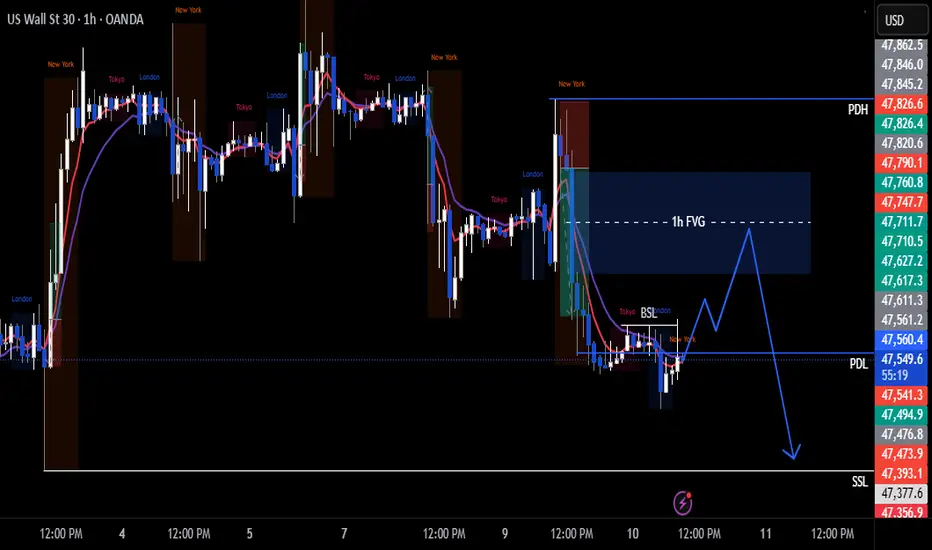
US30 Trade Set Up Jan 6 2025price has made a new ATH yesterday and has tapped into a 4h bullish FVG also inverted a 1h bearish FVG so i will expect price to target Asia highs and possible PDH

US30 Trade Set Up Jan 5 2026Price has swept PDH, came down to sweep Asia lows and tap into 4h FVG now i will expect price to sweep London highs followed by a pullback down

US30 Trade Set Up Jan 2 2026Price has made HH on the 1h with London break out of Asia highs so first i will want to see price sweep Asia lows before looking for buys back up

US30 Trade Up Dec 31 2025Price is overall bearish on the 4h and has swept Asia and London highs so i will wait for internal 1m-5m IFVG/CISD to take sells lower to London lows

US30 Trade Set Up Dec 30 2025Price is trading in a 15m range from a strong push down yesterday, so i will want to either see London/Asia highs be swept first to then take sells to PDL or see London lows or PDL swept first to then look for buys to London highs and 4h FVG

US30 Trade Set Up Dec 29 2025Price has retraced down to test Daily FVG and PDL, so first id like to see if sweep PDL and fill the gap before looking for internal 1m-5m IFVG/CISD to take price higher back towards PDH

US30 Trade Set Up Dec 26 2025Overall im bullish. Price has broken out of the Asia range, swept London highs so now i will wait to see if price can sweep London lows to then form 1m-5m IFVG/CISD to target PDH

US30 Trade Set Up Dec 24 2025Price has respected a 1h bullish FVG, is making HL and swept Asia lows and highs so i will wait for a pull back into internal 5m FVG followed by 1m-5m IFVG/CISD to target PDH

US30 Trade Set Up Dec 22 2025Price is in bullish structure, has swept Asia lows and London highs and inverted a 30m bearish FVG so i will want to see a pullback into it to then look for 1m-5m IFVG/CISD to target PDH

US30 Trade Set Up Dec 19 2025Price is making HL on the 1h and has broken out of Asia highs so i will want to see a pull back to sweep London lows and tap into 1h FVG to then form 1-5m IFVG/CISD to go higher to PDH and supply

US30 Trade Set Up Dec 18 2025Price has bounced off strong demand during Asia, London has broken out of Asia and has inverted 1h FVG so i will wait for a pullback followed by internal 1m-5m IFVG/CISD to push higher into PDH and fib levels

US30 Trade Set Up Dec 17 2025Price is making LL/LH on the 1h and has swept Asia highs and filled 4h FVG so i will wait for internal 1m-5m IFVG/CISD to target PDL

US30 Trade Set Up Dec 16 2025Price has respected a daily FVG multiple times and failed to sweep PDL followed by inverting a 1h FVG to then sweep Asia highs and fill a 1h bearish FVG so now i will want to see internal 1m-5m bullish structure to continue its uptrend to PDH

US30 Trade Set Up Dec 15 2025Price made a new ATH last week and has left a daily gap below which i will expect price to fill this week before continuing higher. So for now price is trading within a bearish 4h FVG, approaching 1h supply and has swept both Asia and London highs so i will wait and see if price makes internal 1m-5m CISD/IFVG to reverse down to Asia lows and PDL

US30 Trade Set Up Dec 12 2025Price remains bullish making ATH so i will want to see price first sweep internal London lows or lower SSL first before looking for 1m-5m IFVG/CISD to continue higher

US30 Trade Set Up Dec 11 2025Price is making HH/HL so now in a bullish trend but it currently at a supply and approaching PDH so if it sweeps it i will look for internal IFVG/CISD to target Asia lows before continuing a bullish trend but if price closes above PDH price can go higher to BSL and higher supply

US30 Trade Secured 1500 Pipsperfect trade, sweeping London lows then IFVG on the 2m to target 1h FVG

US30 Trade Set Up Dec 20 2025Price is overall bearish making LH/LL but has left a wide 1h FVG i will expect price to fill before continuing its bearish trend to lower SSL
US30 Trade Set Up Dec 9 2025Price remains bearish making LH/LL on the 1h so i will wait for a reaction from London lows being swept before looking for internal 1m-5m internal bearish structure to continue lower to demand and SSL
