US500 Structure Turns Positive as Demand Builds📈 Bullish US500 / SPX500 Swing Trade Opportunity | Thief Layer Strategy 🛡️💰
🔥 Asset: US500 / SPX500 Index
📅 Trade Style: Swing Trade
📊 Market Bias: Bullish Momentum
💡 Trade Plan – Thief Layer Entry Strategy
We’re playing a multi-layered bullish entry using Thief’s layering method 👇
🔹 Limit Layers:
• Buy Limit @ 6820
• Buy Limit @ 6840
• Buy Limit @ 6860
• Buy Limit @ 6880
(Add more layers based on personal risk tolerance & preference)
Layer Method: Using multiple limit orders helps accumulate positions on weakness and improve average entry for swing upside.
🛑 Stop Loss – Thief OG Rule
🔒 SL: 6800 (Thief SL)
➡️ Adjust SL based on your own risk level and strategy. Manage risk yourself — only use my SL as reference, not guidance.
⚠️ I am not recommending you ONLY use my SL/TP — trade at your own risk & adjust as needed.
🏁 Target Zone
🎯 Primary Target: 6980
📌 This zone aligns with strong resistance, potential overbought reaction & trap level — cautious profit-taking area.
🔗 Related Markets to WATCH
Here are correlated markets that often move with SPX500:
✔️ US Dollar Index (DXY) – correlation influences risk sentiment and equities. A stronger USD often supports equity strength, though relationship varies over time.
✔️ NASDAQ / US Tech Index – tech is a big driver for US500 performance due to sector weight.
✔️ Crude Oil (WTI / Brent) – recent patterns showed equities trending in tandem with oil, reflecting risk appetite.
✔️ EUR/USD & GBP/USD — sentiment indicators that often swing with risk on/off market mood.
🧠 Fundamentals & Macro Drivers
📌 Economic Outlook: U.S. growth expected without recession in 2026, aiding risk assets.
📌 Fed Policy: Recent rate cuts and expectation of additional easing support equity valuations.
📌 Earnings Growth: Most major sectors projected with higher expected growth for 2026.
📌 AI + Tech Tailwinds: Continued AI investment remains a key bullish driver for US equities.
📅 Watch Upcoming News Events:
• U.S. Nonfarm Payrolls
• Fed Rate Decisions / FOMC Minutes
• CPI & Inflation data
• PMI & Retail Sales
📌 Why This Setup
✅ Multi-layer entries improve execution quality
✅ Bullish macro backdrop + earnings support
✅ Clear risk zone + target
✅ Correlation watchlist for context
💬 Trade smart, manage risk, and always confirm with your own analysis.
If this idea helped, *like 👍, comment 💬, and follow 📌 for more Thief strategy setups!
Us500long

Bullish continuationS&P500 (US500) could fall towards the pivot, which is a pullback support, and could bounce to the 1st resistance, which is a multi-swing high resistance.
Pivot: 6,505.98
1st Support: 6,141.15
1st Resistance: 6,900.95
Disclaimer:
The opinions given above constitute general market commentary and do not constitute the opinion or advice of IC Markets or any form of personal or investment advice.
Any opinions, news, research, analyses, prices, other information, or links to third-party sites contained on this website are provided on an "as-is" basis, are intended to be informative only, and are not advice, a recommendation, research, a record of our trading prices, an offer of, or solicitation for, a transaction in any financial instrument and thus should not be treated as such. The information provided does not involve any specific investment objectives, financial situation, or needs of any specific person who may receive it. Please be aware that past performance is not a reliable indicator of future performance and/or results. Past performance or forward-looking scenarios based upon the reasonable beliefs of the third-party provider are not a guarantee of future performance. Actual results may differ materially from those anticipated in forward-looking or past performance statements. IC Markets makes no representation or warranty and assumes no liability as to the accuracy or completeness of the information provided, nor any loss arising from any investment based on a recommendation, forecast, or any information supplied by any third party

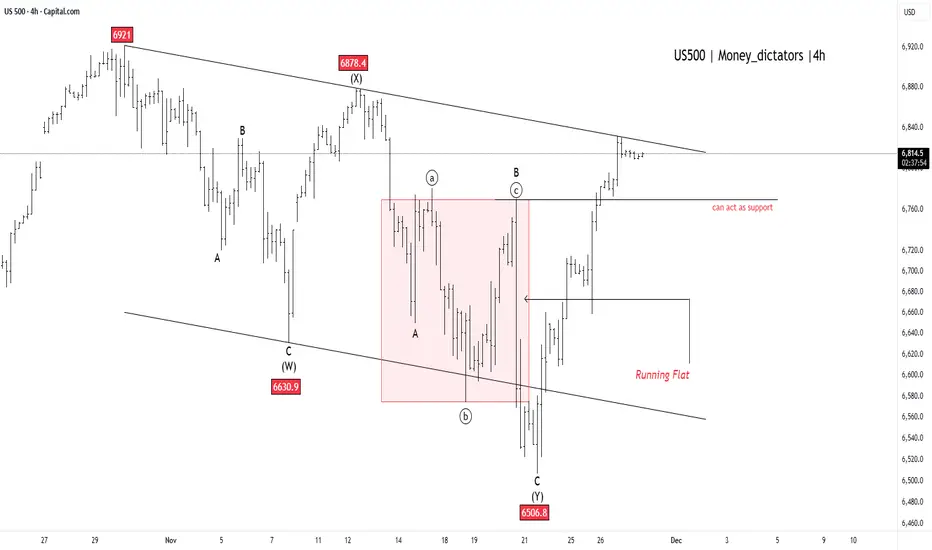
US500 - Breakout to New All-Time Highs!US500 suggests the market has put a definitive end to its recent downward movement, signaling that a major bullish trend is set to continue. This complex correction, which the chart labels as complete at the 6506.8 low, looks resolved. The index has since staged a powerful rebound and is currently pressing right up against the major upper trendline resistance, which defined the limits of the entire corrective phase.
A clear and sustained move above this key trendline will provide final confirmation that the correction is over and that a significant new upward wave has begun. The previous area of congestion around 6760 is now expected to act as strong support for the index, preventing any minor pullbacks from turning into a deeper decline. With the current price around 6,812.61 and the all-time high at 6,920.34 , the index is technically well-positioned to challenge and surpass this record high soon.
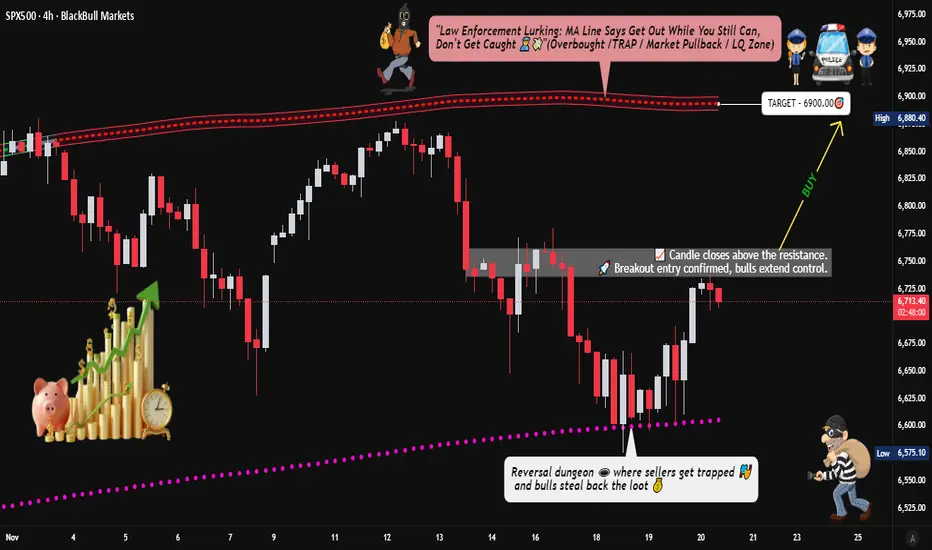
US500 Bullish Structure: Pullback → Breakout Continuation📈 SPX500/US500 Bullish Breakout Setup | Swing Trade Opportunity 🎯
🔥 Market Overview
Asset: S&P 500 Cash CFD (SPX500/US500)
Trade Type: Swing Trade (Medium-term)
Bias: BULLISH ✅
Current Price: ~$6,614 (Nov 20, 2025)
📊 Trade Setup & Technical Analysis
🎯 Strategy Confirmation
✅ Weighted Moving Average Pullback pattern confirmed
✅ Price consolidating near key resistance zone
✅ Bullish structure intact above major support levels
🚀 Entry Strategy
Breakout Entry: Enter AFTER confirmed breakout above $6,750 resistance
Wait for price to close above $6,750 with strong volume
Avoid premature entries; confirmation is key
Multiple position sizing recommended after breakout validation
🛑 Stop Loss Considerations
Suggested SL: $6,630 area
⚠️ IMPORTANT: This is a reference level only. Adjust your stop loss based on:
Your personal risk tolerance
Account size and position sizing
Trading strategy requirements
Trade at your own risk – customize stops to fit YOUR plan
🎯 Target Zones
Primary Target: $6,900-$6,950 zone
📌 Key Resistance Factors at Target:
Moving Average confluence acting as resistance barrier
Potential overbought conditions expected
Historical supply zone overlap
Risk of bull traps in this region
⚠️ Profit-Taking Strategy:
Consider scaling out near $6,900
Lock partial profits before $6,950
Trail stops for remaining position
This is YOUR trade – take profits when YOUR strategy signals
💰 Related Assets to Monitor
📉 Correlated US Indices
NASDAQ 100 (NAS100/US100) 📱
Tech-heavy index; leads SPX during risk-on moves
Correlation: ~85-90% positive
Key Level: Watch $21,000 breakout zone
DOW JONES 30 (US30) 🏭
Blue-chip indicator; confirms broad market strength
Correlation: ~80-85% positive
Key Level: $44,500 resistance critical
RUSSELL 2000 (US2000) 🏢
Small-cap indicator; risk sentiment gauge
Correlation: ~70-75% positive
Key Level: $2,400 breakout = bullish confirmation
💵 Dollar Correlation
US DOLLAR INDEX (DXY/USDX) 💵
Correlation: ~60-70% INVERSE (negative)
Dollar weakness = SPX strength typically
Key Level: Watch $106.50 support; break = SPX boost
🌍 Global Risk Assets
VOLATILITY INDEX (VIX) ⚡
Correlation: ~80% INVERSE (fear gauge)
VIX below $15 = bullish SPX environment
VIX spike above $20 = caution signal
GOLD (XAUUSD) 🥇
Correlation: Variable ~30-40% (flight to safety indicator)
Gold weakness + SPX strength = risk-on confirmed
📋 Risk Disclosure
⚠️ CRITICAL REMINDERS:
I am NOT providing financial advice
These levels are reference points only
YOU must determine your own entry, stop loss, and take profit levels
Trade with money you can afford to lose
Market conditions change rapidly – adapt accordingly
Past performance does not guarantee future results
🎓 Professional Risk Management:
Never risk more than 1-2% of capital per trade
Use proper position sizing calculators
Set alerts for key levels, don't watch charts 24/7
Have a written trading plan before entering
🔔 Action Plan Checklist
✅ Monitor price action near $6,750
✅ Confirm breakout with volume and candle close
✅ Set alerts for correlated assets (DXY, VIX, NAS100)
✅ Calculate position size based on YOUR risk tolerance
✅ Define exit strategy BEFORE entry
✅ Review market news and economic calendar
💬 Final Thoughts
This setup offers a risk-defined swing trade opportunity on the S&P 500 with clear technical levels. The weighted moving average pullback pattern provides structural support for the bullish thesis, while the $6,750 breakout level offers a defined entry trigger.
Remember: Markets are unpredictable. This analysis is educational and reflects technical observations only. YOUR trading decisions are YOUR responsibility.
🙏 Trade Safe, Trade Smart
If this analysis helps you, drop a like 👍 and follow for more setups! Let's build wealth together responsibly.
#SPX500 #SP500 #US500 #SwingTrade #Breakout #TechnicalAnalysis #StockMarket #Trading #ForexTrading #IndexTrading #BullishSetup #TradingView #MarketAnalysis
S&P 500 Bullish Layers Setup — Demand Zone Reload Opportunity!🟩 Asset:
US500 / S&P 500 — Index Market Trade Opportunity Guide (Swing / Day Trade)
💡 Trade Plan Overview
A bullish continuation plan is confirmed as the index builds strong demand-zone pressure, supported by broad fundamental economic drivers including resilient U.S corporate earnings, easing treasury yields, and steady sector rotation behavior.
This setup favors structured long positioning using disciplined multi-layer entries.
🎯 Trade Execution Plan (Thief Strategy — Layering Entry Method)
🟦 Entry Strategy (Layer Entries)
You can enter at any price, but here is the structured Thief layering approach:
Buy Limit Layer 1: 6,750
Buy Limit Layer 2: 6,800
Buy Limit Layer 3: 6,850
(You may add more layers if you prefer deeper dips — fully customizable to your personal risk appetite.)
🛡️ Stop Loss (SL)
Thief SL: 6,650
👥 Dear Ladies & Gentlemen (Thief OG’s), feel free to adjust SL based on your approach and risk preference. This SL is not mandatory — trade at your own risk tolerance.
🎯 Target Zone (TP)
Main Target: 7,050
The moving average cluster above current price acts as a strong resistance. Market structure signals a potential overbought trap, so locking profits as we approach 7,050 is wise.
👥 Dear Ladies & Gentlemen (Thief OG’s), this TP is not compulsory — take profits whenever your system confirms opportunities.
📊 Key Market Notes
Demand zones are holding strongly
Momentum shifts show bullish continuation
Price action respects MA levels
Fundamentals + rotation fuels upside
Trap zones above — manage exits properly
🔗 Correlation Watchlist (Related Markets You Must Track)
Monitoring correlated markets strengthens decision-making. Here are highly relevant pairs/assets:
💲 1. US Dollar Index (DXY)
Why important:
S&P 500 typically moves inverse to the USD.
When DXY weakens, US500 often gains momentum.
Strong USD → pressure on equities, especially tech.
Watch for:
USD pullback = bullish support for US500
USD breakout = equities face resistance
💲 2. US10Y / US Treasury Yields
Correlation:
Yields rising = stock market weakness
Yields falling = S&P 500 bullish fuel
Watch for:
Yields softening → risk-on flows
Freight in yield spikes → temporary pullbacks
💲 3. VIX (Volatility Index)
Correlation:
Low VIX = stable bullish conditions
Rising VIX = possible correction / trap
Watch for:
VIX drop under key zones → bullish confirmation
Spike above resistance → protect profits
💲 4. NASDAQ 100 (US100)
Correlation:
Strong tech = strong S&P 500
Tech weakness often leads broader index lower
Watch for:
Mega-cap earnings cycles
AI sector momentum
Bond yield reaction on tech stocks
💲 5. Crude Oil (USOIL / WTI)
Correlation:
High oil prices → inflation pressure → Fed concerns
Lower oil → relief → bullish S&P 500
Watch for:
Oil spike = possible S&P 500 pullback
Oil cool down = index strengthens
💲 6. Gold (XAU/USD)
Correlation:
Indirect & risk sentiment-based
Risk-off flows go into gold → equities may pause
Watch for:
Gold breakout = risk-off environment
Gold drop = risk-on supports S&P 500
📘 Final Thoughts
This setup follows the well-tested Thief layering strategy, combining technical demand zones with macroeconomic alignment. Stick to your personal risk comfort, manage layers wisely, and let price action guide exits.

US500US500 – Opportunity at Support
The price is consolidating between 6,880 and 6,920. The support region shows a buying reaction, which could generate a new impulse towards the resistance at 6960.

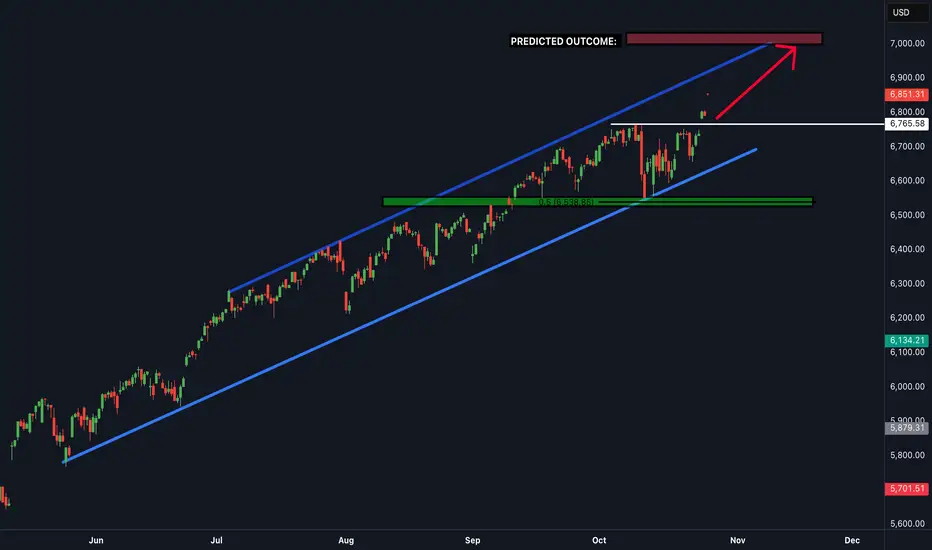
SPX500 On the way to the upside! BUY NOWSPX500 is in a clear upwards channel and has broken the last bit of resistance (white line shown) - this is a clear confirmation that the next target will be the next resistance zone to the upside shown above (this is a great buy trade opportunity)
SPX 500 Swing/Day Trade Plan | Bullish Layers & Risk Guard✨ SPX 500 Index | Market Wealth Strategy Map (Swing/Day Trade) ✨
🚨 Plan: Bullish bias with Thief Strategy (layered limit entries).
🕹️ Style: Multiple buy-limit orders placed at different levels (“layering method” for smarter entries).
🎯 Entry Plan (Layered Thief Style)
🔑 Buy Limit Layers: 6660, 6680, 6700, 6720
➕ You can add more layers if market conditions allow.
🧠 Idea: Scaling in like a true Thief 🕶️ — stealing the best spots!
🛑 Stop Loss (SL)
Thief SL: @ 6640
⚠️ Note: Dear Ladies & Gentlemen (Thief OG’s), I’m not recommending you to use only my SL.
It’s your money → your choice → your risk management.
🎯 Target (TP)
Primary Target: @ 6900
🌀 Why? Shockwave resistance ⚡ + overbought zones 📈 + liquidity traps 🪤.
⛑️ Again, it’s your choice to set your own TP — escape with profits when you feel comfortable!
📊 Related Pairs & Correlations to Watch
CAPITALCOM:US500 / SP:SPX / CME_MINI:ES1! → Direct correlation to SPX 500.
NASDAQ:NDX / NASDAQ 100 → Often leads tech momentum, affects SPX swings.
TVC:DXY (US Dollar Index) → Strong dollar = pressure on indices. Weak dollar = fuel for bulls.
CAPITALCOM:US30 (Dow Jones) → Sometimes diverges from SPX, offering confluence signals.
TVC:VIX → Volatility Index — spikes = watch out for fakeouts / liquidity grabs.
💡 Key Takeaways
✅ Thief layering entry style = Scaling smarter, not harder.
✅ SL/TP = Flexible to your own trading psychology & risk appetite.
✅ Always respect risk management & don’t copy-paste blindly.
✅ Remember: markets love traps — be the thief, not the victim.
✨ “If you find value in my analysis, a 👍 and 🚀 boost is much appreciated — it helps me share more setups with the community!”
⚠️ Disclaimer: This is a Thief-style strategy shared just for fun & market learning purposes.
Not financial advice — trade at your own risk!
#SPX500 #US500 #SP500 #SPX #ThiefStrategy #DayTrading #SwingTrading #IndexTrading #MarketAnalysis #StockMarket
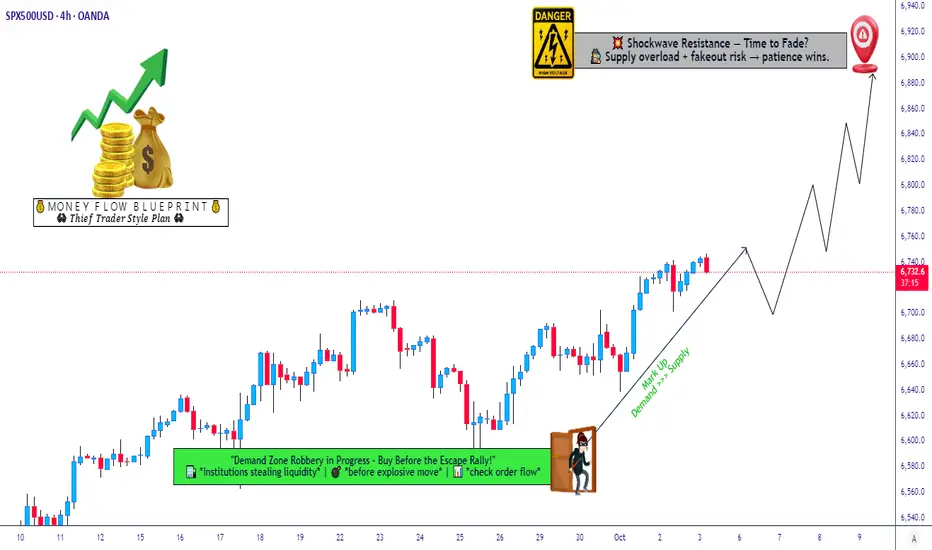
SPX500 Blueprint Confirms a Bullish Flow Reversal!🏃♂️💨 SPX500 Heist: The Bullish Getaway Plan! (Swing Trade Blueprint)
The market's pulling back, but the big money is still accumulating! We've spotted a bullish setup on the SPX500, and we're planning a strategic "thief-style" entry to catch the next leg up. This isn't a reckless smash-and-grab; it's a calculated heist. 🗿
📊 The Master Plan: Technical Blueprint
Direction: 🟢 BULLISH
Trend Confirmation: Strong bullish structure confirmed by the Triangular Moving Average (TMA).
Entry Signal: We're looking for a retest and bounce from the Simple Moving Average (SMA), suggesting the pullback is a healthy accumulation phase before the next move higher.
🎯 The Heist Strategy: Execution & Logistics
🚪 Entry Protocol: "Layered Limit Orders"
We're not chasing the price. We're setting traps! Using a layered limit order strategy to average into the trade at key levels.
Suggested Buy Zones (Layer Your Orders):
Layer 1: 6780
Layer 2: 6760
Layer 3: 6740
Layer 4: 6700
Feel free to adjust the number of layers and levels based on your own risk appetite.
🚨 Escape Route: Stop Loss
Every good thief has an exit plan if the heist goes south.
Stop Loss (The Getaway Car): A break below 6680 suggests the plan is invalid. This is our "abort mission" signal.
⚠️ Note to the Thief OG's: This is my planned SL. You are the master of your own capital. Manage your risk accordingly!
💰 Profit Target: Cashing the Loot
We're aiming for a major resistance zone where the "police" (sellers) are likely waiting.
Take Profit Target: 6900
Why here? This area acts as a strong technical resistance, potentially an overbought trap. Our goal is to escape with the profits before any reversal!
⚠️ Note to the Thief OG's: This is my target. You can take money off the table whenever you see fit. Partial profits are always a smart move!
🔍 Related Markets to Watch
AMEX:SPY (SPDR S&P 500 ETF): The direct ETF tracker. Moves in near-perfect correlation.
CME_MINI:ES1! (S&P 500 E-mini Futures): The futures market often leads the price action in the index.
/ES (Micro E-mini S&P 500 Futures): A smaller contract size with the same directional bias.
NASDAQ:NDX (Nasdaq 100 Index): Often moves in tandem with the SPX; a strong NDX can pull SPX higher.
TVC:DXY (US Dollar Index): A strong inverse correlation. A weaker Dollar is generally bullish for US equities.
✨ Key Takeaways
Strategy: Bullish Swing Trade on a pullback.
Method: Layered limit order entries for optimal average price.
Catalyst: TMA & SMA support holding as accumulation zones.
Goal: Capture the move towards 6900 resistance.
✨ “If you find value in my analysis, a 👍 and 🚀 boost is much appreciated — it helps me share more setups with the community!”
Hashtags: #SPX500 #TradingSetup #SwingTrading #US500 #TradingPlan #Bullish #MarketAnalysis #TechnicalAnalysis #TradingView #ThiefStrategy

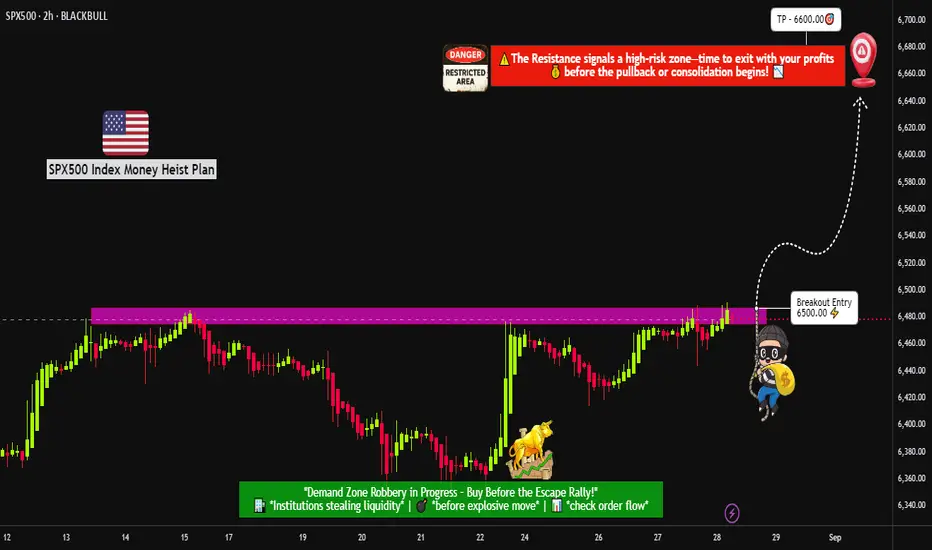
"US500 BREAKOUT – TIME TO LOAD LIMIT ORDERS FOR THE PUMP?"🔥🦹♂️ "SPX500 BANK HEIST – LAYERED BULL RAID IN PROGRESS!" 💰📈
(Thief Trader’s Multi-Limit Order Bullish Ambush – No Weak Hands Allowed)
📍 ASSET: US500 / SPX500 (S&P 500 INDEX)
🎯 HEIST PLAN: BULLISH BREAKOUT 6500.00
💣 ENTRY: ANY PRICE LEVEL (Thieves use Layered Limit Orders – adapt like a pro!)
🔫 SAMPLE LAYERS: (Scale in like a boss!)
BUY LIMIT LAYER 1: 6475.00
BUY LIMIT LAYER 2: 6460.00
BUY LIMIT LAYER 3: 6440.00
(Add more layers if needed – flexibility is key!)
🛑 STOP LOSS: 6400.00 (Thief’s Emergency Exit – adjust based on your risk!)
🎯 TARGET: 6600.00 (First profit zone – trail or take gains!)
🦹♂️ THIEF TRADER’S MASTER PLAN:
"We don’t ask for permission – we take profits."
🔹 ENTRY TACTICS:
Use multiple limit orders (LAYERED STRATEGY) – like planting timed explosives at key levels.
No panic entries – thieves strike with precision, not emotion.
DCA if needed – but keep bullets for the real move.
🔹 STOP LOSS RULES:
6400 = Danger Zone – if price breaks, abort mission & regroup.
SL too tight? You’ll get stopped out by market noise. SL too wide? You’ll bleed. Find balance.
🔹 TAKE PROFIT STRATEGY:
First TP @ 6600 – secure partial profits.
Let runners ride with trailing stop – or full exit if momentum fades.
🚨 THIEF’S GOLDEN RULES:
✅ Only LONG – no revenge shorts, no greed traps.
✅ Trade in SILENCE – avoid high-impact news (CPI, NFP, Fed).
✅ Risk management = Survival – don’t blow your account on one play.
✅ BOOST & SHARE – if this plan helps, spread the word!
📢 FINAL WARNING:
"This is not financial advice – it’s a thief’s blueprint.
Plan your escape before entry. Market heists require discipline."
💬 COMMENT "ROBBING SPX" if you’re in!
🔥 LIKE & BOOST if you ride with the Thief Trader crew!
🦹♂️ THIEF TRADER OUT.
💸 STEAL SMART. GET RICH. REPEAT.
US500: Bulls Pause as Pullback Risks GrowUS500 has been riding an impressive uptrend, with buyers pushing the index to fresh highs above 6,440, but the recent stalling near resistance suggests that momentum may be losing steam. With growth concerns, central bank caution, and a round of key economic data on deck, the risk of a corrective pullback is building. This setup highlights the importance of watching whether support levels hold or if sellers gain the upper hand.
Current Bias
Bearish (Short Term) – While the broader trend remains bullish, near-term technicals and macro uncertainty point toward a corrective pullback.
Key Fundamental Drivers
US Earnings Season: Mixed corporate earnings, with strength in tech offset by weakness in cyclicals.
Fed Policy: Markets are still weighing timing of potential rate cuts, but sticky inflation data and cautious Fed commentary keep rates elevated.
Bond Yields: US yields remain relatively high, pressuring equities when safe-haven flows emerge.
Macro Context
Interest Rates: The Fed is in a “wait-and-see” mode, balancing sticky services inflation against slowing growth. Rate cuts are still priced for later this year, but not aggressively.
Economic Growth: US economy shows signs of slowing, with softer retail sales and housing data, though labor markets remain resilient.
Commodities/Flows: Energy costs are stabilizing, but higher oil prices in recent weeks could add inflationary pressure.
Geopolitics: Trade tensions, tariffs, and Middle East instability add layers of risk, supporting defensive positioning.
Primary Risk to the Trend
A surprise dovish shift from the Fed or stronger-than-expected US earnings could quickly reignite bullish momentum and push US500 higher, invalidating the pullback scenario.
Most Critical Upcoming News/Event
FOMC Minutes & Powell Speeches – Markets will look for clarity on rate cut timing.
US CPI & PPI Data – Any upside surprises could weigh heavily on equities.
Leader/Lagger Dynamics
The US500 is a leader, often dictating global equity sentiment. Movements in US500 ripple into NASDAQ, DAX, FTSE, and risk-sensitive FX pairs such as AUD/JPY. Its role as a global risk benchmark makes it highly influential.
Key Levels
Support Levels: 6,370, 6,231, 5,920
Resistance Levels: 6,447 (recent high), 6,500 psychological barrier
Stop Loss (SL): 6,480 (above recent highs)
Take Profit (TP):
TP1: 6,370
TP2: 6,231
TP3: 5,920
Summary: Bias and Watchpoints
US500 bias is shifting to neutral-to-bearish, with the index showing signs of fatigue at highs around 6,440–6,450. A pullback toward 6,370 → 6,231 is possible, with 5,920 as an extended target if risk sentiment deteriorates. A protective stop at 6,480 is key in case bulls regain momentum. Traders should keep a close eye on Fed communication and US inflation data, as these remain the most powerful catalysts for near-term direction. With the US500 acting as a leader for global equities, its moves will likely shape broader market sentiment across stocks, indices, and even risk-sensitive currencies.

US500 Short Setup: Bearish Momentum Toward 6205Currently holding a short position on the US500 from the 6358 level, based on Smart Money Concepts. Price has tapped into a premium zone within a higher time frame supply area, showing clear signs of distribution. Liquidity has been swept above recent highs, and a shift in market structure confirms bearish intent. I’m targeting the 6205 level, expecting a rapid downside move in the very short term as smart money drives price toward discounted levels.

US500: Rebound Setup After Sharp Pullback – Key Support HoldingUS500 has experienced a strong corrective move after an extended bullish run but is now showing signs of stabilizing near a key support area. This zone aligns with both technical retracement levels and the market's reaction to fundamental shifts—particularly the dovish repricing of the Fed following weak US jobs data.
Technical Analysis (4H Chart)
Pattern: After a strong uptrend, price faced a steep correction, forming a potential short-term reversal setup.
Current Level: 6,235, holding above the 6,217 support zone.
Key Support Levels:
6,217 (immediate support; key defense zone for bulls).
6,171 (38.2% retracement, secondary support if deeper pullback occurs).
Resistance Levels:
6,272 (23.6% retracement and initial resistance).
6,360 (upper resistance zone and retest of recent breakdown).
6,429/6,436 (recent high and target if bullish momentum resumes).
Projection: A rebound from current levels could push US500 back toward 6,360–6,430 if support holds.
Fundamental Analysis
Bias: Neutral-to-bullish as macro drivers favor a recovery from pullback.
Key Fundamentals:
Fed Policy: Weak US jobs (+73K) and downward revisions have solidified rate cut expectations (~75% probability in September), boosting equity sentiment.
Inflation: Market awaits US CPI; softer data would further support equities.
Tariffs: While Trump’s tariffs create a medium-term risk for earnings, immediate Fed easing bets outweigh these concerns.
Risk Sentiment: Global risk remains supported by lower yields and optimism about Fed easing.
Risks:
Hot US CPI could reverse cut expectations, pressuring equities.
Geopolitical risks or tariff escalation could trigger renewed selling.
Key Events:
US CPI and PPI.
Fed speeches and rate expectations.
Earnings reports from key US companies.
Leader/Lagger Dynamics
US500 is a leader, driving global risk sentiment and influencing risk-sensitive assets like AUD/USD, NZD/USD, and JPY crosses.
Summary: Bias and Watchpoints
US500 is neutral-to-bullish, stabilizing at key support (6,217) after a sharp correction. Fed cut expectations and risk-on sentiment support the upside scenario, targeting 6,360–6,430 if US CPI aligns with softer inflation. However, a hot CPI print could invalidate this rebound and trigger another leg lower.

Us500:What is going to happen?hello friends👋
This time we are here with the analysis of us500, an important and vital index in the market that is being talked about a lot these days.
Well, let's go to the analysis, you will see that with the drop we had, a lower floor was made and the price was quickly supported and pumped by buyers.
Now it is clear that an ascending pattern has been formed, which is a very strong support in the specified area and a good buying point that you can enter into a transaction with capital and risk management.
Note that if the floor is broken and the stop loss is placed, our bullish pattern becomes invalid and we have to wait for lower floors.
🔥Follow us for more signals🔥
*Trade safely with us*

up or down...Hello friends🙌
🔊As you can see, the US500 index has been identified with several resistance encounters and the good support that the price has been able to break the resistance and turn it into support. Now, according to today's news, it seems that the price is targeting higher targets that we have identified for you.
In case of correction, it has strong support ahead of it, which we have identified with a white line, but don't forget that buyers have entered...📈
🔥Join us for more signals🔥
Trade safely with us.

"US500/SPX500" Index Market Money Heist Plan (Day / Scalping)🌟Hi! Hola! Ola! Bonjour! Hallo! Marhaba!🌟
Dear Money Makers & Robbers, 🤑 💰💸✈️
Based on 🔥Thief Trading style technical and fundamental analysis🔥, here is our master plan to heist the "US500 / SPX500" Index CFD Market. Please adhere to the strategy I've outlined in the chart, which emphasizes long entry. Our aim is to escape near the high-risk ATR Zone. Risky level, overbought market, consolidation, trend reversal, trap at the level where traders and bearish robbers are stronger. 🏆💸"Take profit and treat yourself, traders. You deserve it!💪🏆🎉
Entry 📈 : "The heist is on! Wait for the MA breakout (5500) then make your move - Bullish profits await!"
however I advise to Place Buy stop orders above the Moving average (or) Place buy limit orders within a 15 or 30 minute timeframe most recent or swing, low or high level for Pullback entries.
📌I strongly advise you to set an "alert (Alarm)" on your chart so you can see when the breakout entry occurs.
Stop Loss 🛑: "🔊 Yo, listen up! 🗣️ If you're lookin' to get in on a buy stop order, don't even think about settin' that stop loss till after the breakout 🚀. You feel me? Now, if you're smart, you'll place that stop loss where I told you to 📍, but if you're a rebel, you can put it wherever you like 🤪 - just don't say I didn't warn you ⚠️. You're playin' with fire 🔥, and it's your risk, not mine 👊."
📍 Thief SL placed at the recent/swing low level Using the 1H timeframe (5200) Day trade basis.
📍 SL is based on your risk of the trade, lot size and how many multiple orders you have to take.
🏴☠️Target 🎯: 5750 (or) Escape Before the Target
🧲Scalpers, take note 👀 : only scalp on the Long side. If you have a lot of money, you can go straight away; if not, you can join swing traders and carry out the robbery plan. Use trailing SL to safeguard your money 💰.
💰💵💴💸"US500/SPX500" Index CFD Market Heist Plan (Day / Scalping Trade) is currently experiencing a bullishness🐂.., driven by several key factors.👆👆👆
📰🗞️Get & Read the Fundamental, Macro economics, COT Report, Geopolitical and News Analysis, Sentimental Outlook, Intermarket Analysis, Index-Specific Analysis,Positioning and future trend targets with Overall Score...... go ahead to check 👉👉👉🔗🔗
⚠️Trading Alert : News Releases and Position Management 📰 🗞️ 🚫🚏
As a reminder, news releases can have a significant impact on market prices and volatility. To minimize potential losses and protect your running positions,
we recommend the following:
Avoid taking new trades during news releases
Use trailing stop-loss orders to protect your running positions and lock in profits
💖Supporting our robbery plan 💥Hit the Boost Button💥 will enable us to effortlessly make and steal money 💰💵. Boost the strength of our robbery team. Every day in this market make money with ease by using the Thief Trading Style.🏆💪🤝❤️🎉🚀
I'll see you soon with another heist plan, so stay tuned 🤑🐱👤🤗🤩

US500 Reversal Zone? My Thought Process Explained 🎯 📉 Earlier today I posted an analysis on the US500, highlighting how price has traded into a weekly bearish order block 🧱 — a key distribution zone where I believe smart money could look to unwind positions. The market is currently overextended and sitting at a premium, which raises the risk of a potential aggressive retrace 🔄, especially heading into the weekend. ⚠️
💭 Here's a video where I break down that exact setup and walk you through my full thought process, including why I’m exercising extreme caution at these levels and what I’m looking for in terms of confirmation.
📚 As always, this is for educational purposes only — not financial advice. 🚫💼

SP500 what to expect next?As a seasoned trader with over a decade of experience navigating the markets, I’ve been closely monitoring the S&P 500’s current price action. The index is presently confined within a well-defined range, with resistance at 5,528 and support at 5,146, based on recent price behavior. We’ve observed a notable deviation below the lower boundary of this range, which often signals a potential reversal or absorption of liquidity before a move higher.
My analysis suggests the next likely target is the upper boundary of the range at 5,528, coinciding with a weekly Fair Value Gap (FVG) that has yet to be filled. Should the price approach this zone, I anticipate a strong market reaction, potentially driven by aggressive order flow as participants defend or challenge this key level. If the weekly FVG is invalidated—meaning price sweeps through this area without significant rejection—the S&P 500 could be poised to break out and target new all-time highs from its current position.

US500 LIVEHello friends
Given the price rise and correction we had, we can open a position with capital and risk management.
*Trade safely with us*

Has SPX formed a bottom?SPX500USD - 24h expiry
Price action looks to be forming a bottom.
A Doji style candle has been posted from the base.
Setbacks should be limited to yesterday's low.
We look to buy dips.
Risk/Reward would be poor to call a buy from current levels.
We look to Buy at 4900.5 (stop at 4767.5)
Our profit targets will be 5295.5 and 5365.5
Resistance: 5219.6 / 5350.0 / 5500.0
Support: 5100.0 / 5000.0 / 4812.2
Risk Disclaimer
The trade ideas beyond this page are for informational purposes only and do not constitute investment advice or a solicitation to trade. This information is provided by Signal Centre, a third-party unaffiliated with OANDA, and is intended for general circulation only. OANDA does not guarantee the accuracy of this information and assumes no responsibilities for the information provided by the third party. The information does not take into account the specific investment objectives, financial situation, or particular needs of any particular person. You should take into account your specific investment objectives, financial situation, and particular needs before making a commitment to trade, including seeking advice from an independent financial adviser regarding the suitability of the investment, under a separate engagement, as you deem fit.
You accept that you assume all risks in independently viewing the contents and selecting a chosen strategy.
Where the research is distributed in Singapore to a person who is not an Accredited Investor, Expert Investor or an Institutional Investor, Oanda Asia Pacific Pte Ltd (“OAP“) accepts legal responsibility for the contents of the report to such persons only to the extent required by law. Singapore customers should contact OAP at 6579 8289 for matters arising from, or in connection with, the information/research distributed.

US500 CHANNELHello friends
Given that the price is in an ascending channel, now that we have a strong wave to the channel ceiling, we have corrected the price by 50%, after which we can expect the price to succeed in hitting a higher ceiling again.
*Trade safely with us*

US500(UPDATE)Hello friends
Given the downward trend we had, the price has reached a good support area and if the area is maintained, you can enter a buy trade and move to the specified targets with it.
*Trade safely with us*

US500:UPDATEHello friends
We witnessed a price drop due to the price reaching an important resistance.
Now, buyers have entered an important support area and by maintaining the support area, we can see the specified price targets.
*Trade safely with us*
