US500 Will Go Down!
HI,Traders !
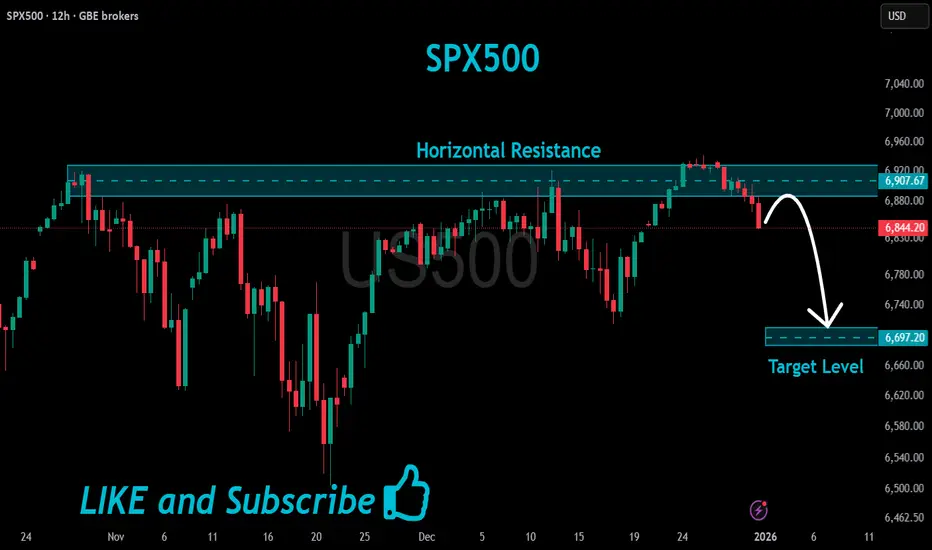
#US500 has made a retest
Of the horizontal resistance
Of 6907.67 and we are already
Seeing a bearish reaction so
We are bearish biased and
Therefore a local bearish
Pullback is to be expected !
Comment and subscribe to help us grow !
Us500trade
US500 Price Map. Will Buyers Defend Key Layers Toward 7000?📊 US500/SPX500 Bullish Swing Trade Strategy | Professional Analysis 🚀
Current Price: $6,870.40 | Status: Bullish Momentum Building 🔥
🎯 TRADE OVERVIEW
Asset: US500 / SPX500 Index
Timeframe: DAY/SWING TRADE (Perfect for Active Traders)
Market Condition: BULLISH 📈
Risk Level: Calculated & Managed ✅
💡 WHY THIS SETUP WORKS
The SPX500 is trading near 52-week highs ($6,920.34), with technical indicators showing Strong Buy signals on daily timeframes. Market sentiment remains constructive with potential for mean reversion plays and breakout opportunities. The index has strong institutional support and is consolidating before the next leg up.
🎲 ENTRY STRATEGY: LAYERED APPROACH (THIEF STRATEGY)
Best Practice Approach: Use MULTIPLE LIMIT ORDERS at different price levels for optimal risk management.
Entry Layers - Place These Simultaneously:
Layer 1 - 6,800 (Low Risk Entry)
This is your first position entry at the strong support zone. This layer captures traders looking for early bounces and reduces your average entry cost significantly. Perfect for conservative traders who want maximum confirmation before committing capital.
Layer 2 - 6,825 (Medium Risk Entry)
This second layer adds confirmation as price moves higher. This is where momentum traders jump in. By staggering entries here, you're catching the middle ground between aggressive and conservative positions, giving you excellent risk-reward setup.
Layer 3 - 6,850 (Aggressive Breakout Entry)
This final layer targets breakout traders who wait for price confirmation. Use this only if you have capital left and see strong volume confirmation. This is your most aggressive entry but has the strongest conviction signal.
✅ Pro Tip: You can add MORE layers based on your risk tolerance & account size. Start small, build positions gradually. Never go all-in on one layer!
Why Layering Works 🎯
Layering is the professional way to build positions because it reduces average entry cost, protects against sudden whipsaws, captures multiple entry opportunities, and significantly increases your overall success probability. Instead of being wrong on one entry, you have three chances to be right!
🛑 STOP LOSS (SL): THIEF OG PROTECTION
SL Level: 6,750
Risk Zone: Below support level
This stop loss level protects you from breaking below a critical support zone. If price closes below 6,750, the bullish thesis is broken and you should exit to preserve capital.
📌 IMPORTANT DISCLAIMER:
⚠️ You are NOT required to use our suggested SL
⚠️ Adjust based on YOUR strategy & risk management rules
⚠️ YOUR MONEY = YOUR RULES | Trade with capital you can afford to lose
SL Management Tips:
Place your stop loss below key support levels that make sense with your trading strategy. Once you're in profit (usually +2% on SPX), consider moving your stop to breakeven so you're trading with house money. After solid confirmation and +3-5% profit, use trailing stops to let winners run. Most importantly, never risk more than 2-3% of your total account on a single trade.
🎁 PROFIT TARGET (TP): RESISTANCE CONFLUENCE
Primary Target: 7,000
Reasoning: Strong Resistance + Overbought Zone + Technical Trap Pattern
The 7,000 level represents a major psychological resistance and technical confluence where multiple indicators suggest profit-taking is likely. This is where smart money typically exits positions. The confluence of strong resistance levels, overbought RSI readings, and technical trap pattern all converge at this critical level, making it the ideal exit point for capturing the full move while protecting profits.
📌 CRITICAL NOTICE:
⚠️ Use YOUR OWN profit targets based on risk/reward ratio
⚠️ This is a SUGGESTED level only
⚠️ Protect Your Profits: Lock in gains before pullbacks
Exit Strategy:
Watch for volume divergence signals where price moves higher but volume decreases - this is a classic warning sign. Monitor RSI levels above 70, which indicate overbought conditions and potential reversals. Track support and resistance breaks throughout the move. Most importantly, don't be greedy. If you've hit your profit target, take it and move on. The best traders know when to say "I'm done for the day."
📍 RELATED PAIRS TO MONITOR (CORRELATION ANALYSIS)
Strong Positive Correlation 🔗
NASDAQ-100 (NQ100/COMP) - Correlation: +0.92
This is your tech-heavy index and moves almost in lockstep with US500. Why watch this? Because tech drives the market. If NASDAQ is weak while SPX is strong, watch out for sector rotation. The NASDAQ-100 currently sits at 25,692. If SPX breaks 7,000, expect NASDAQ targets of 26,500+ based on historical correlation patterns. This pair move confirms the strength of the rally.
DJIA (US30/Dow Jones) - Correlation: +0.89
The Dow Jones is your large-cap indicator. These are the blue-chip stocks. At 47,955, the Dow tends to lag SPX on rallies but confirms the trend strength. If Dow is not participating in SPX strength, it signals rotation OUT of mega-caps into mid-caps. Watch for this divergence as a warning signal.
Russell 2000 (RUT) - Correlation: +0.78
Small-cap participation is crucial. A weak Russell 2000 during SPX strength means only mega-caps are rallying. This is a RED FLAG for sustainability. If Russell is strong with SPX, the rally is broad-based and likely to continue. If Russell is weak, we're in a narrow rally that can reverse quickly.
Inverse Correlation (Risk Hedge) 🛡️
VIX (Volatility Index) - Correlation: -0.85
Currently at 15.41, this low volatility reading screams "risk-on" environment. Traders are comfortable, fear is low. But remember, VIX can spike suddenly. If VIX jumps above 20, consider taking profits and reducing exposure. A VIX spike signals institutional selling and risk-off sentiment.
US DOLLAR (DXY) - Correlation: -0.72
Trading at 98.97, a weak dollar SUPPORTS equities because US companies make more money when the dollar is weak (exports become cheaper). If the dollar strengthens suddenly, expect SPX pressure. Monitor Fed policy announcements that impact currency valuations - they directly impact your equity trades!
Sector Rotations to Track 💼
Tech Giants Matter:
NVIDIA (NVDA) at $182.41 is down -0.53% but still critical. This is THE stock to watch. If NVDA collapses, the entire rally is in question. NVIDIA is your AI barometer.
Meta Platforms (META) at $673.42 is up +1.80% and showing strength. This mega-cap strength confirms institutional confidence in the rally. When META leads, the market is feeling risk-on.
Microsoft (MSFT) at $483.16 is stable at +0.48%. This is your stability indicator. If MSFT can't go higher with SPX, it's a divergence warning.
Apple (AAPL) should be monitored for consumer health signals. Any weakness in AAPL suggests consumer spending concerns ahead.
🔍 TECHNICAL CONFIRMATION CHECKLIST
✅ Daily Chart: STRONG BUY - Moving Averages perfectly aligned in uptrend
✅ Weekly Chart: STRONG BUY - Macro uptrend completely intact, higher lows confirmed
✅ RSI: Not Yet Overbought - Means room to run before pullback expected
✅ MACD: Bullish Crossover Confirmed - Momentum indicator flashing green light
✅ Volume Profile: Good Distribution - Buying happening at higher price levels, not just sharp spikes
✅ Sentiment: Institutional Buying - Big money is flowing into SPX, not retail FOMO
This checklist confirms the setup is solid for the bullish premise. All signals are aligned, which means the probability is in your favor.
⚡ TRADER RULES & DISCLAIMERS
🎯 Golden Rules for This Trade:
Rule 1 - Only Risk What You Can Afford to Lose 💰
Don't use your rent money. Don't risk your emergency fund. Only trade capital that won't hurt your life if you lose it. This removes emotion from decision-making.
Rule 2 - Respect Your Stop Loss
No exceptions. Ever. A stop loss is not a suggestion - it's your insurance policy. Hit it and move on without hesitation. The traders who don't respect stops are the traders who blow up their accounts.
Rule 3 - Scale In and Out
Don't FOMO all-in on one entry. Build positions gradually with the three layers. Exit gradually with the three targets. This removes emotion and improves results dramatically.
Rule 4 - Lock Profits Before Pullbacks
Let winners run but protect gains. Your first 30% profit at 6,900 is EARNED. Take it. You only regret profits you didn't take.
Rule 5 - Track Correlations
Watch related pairs for divergence. If SPX goes up but NASDAQ goes down, something is wrong. Exit first, ask questions later.
Rule 6 - Use Alerts - Don't Stare at Screens 24/7
Set price alerts on TradingView. Let technology do the work. You have a life outside trading. Check alerts a few times per day.
Important Notices ⚠️
📋 This is TECHNICAL ANALYSIS ONLY - Not financial advice
🔒 NOT a recommendation to buy or sell
💡 Use this framework with YOUR OWN analysis - Don't blindly follow
🎓 Paper trade first if you're testing this strategy - Practice before risking real money
📊 Past performance ≠ Future results - Markets change constantly
💪 TRADER PSYCHOLOGY EDGE
Set your entries BEFORE market opens. Don't make emotional decisions when the market is moving fast. Your exit plan matters more than your entry plan. Where you exit determines your profit, not where you enter. Profits are made on discipline, not on aggression. The patient traders dominate the impatient ones.
One good trade beats ten desperate ones. Never try to "make back" losses with revenge trading. The best traders know when to step away from the market and recharge their minds.
🚀 ENGAGEMENT BOOSTERS FOR LIKES & VIEWS
If This Resonates:
👍 Like if you trade US500 index regularly
💬 Comment your entry price and targets
⭐ Bookmark this for your personal watchlist
🔔 Follow for daily swing trade setups and analysis
Share Your Thoughts:
"What's YOUR target on SPX? Comment below! 👇 Are you taking this trade or waiting for confirmation?"
"Have you tried the layered entry method? Tell me your experience in the comments!"

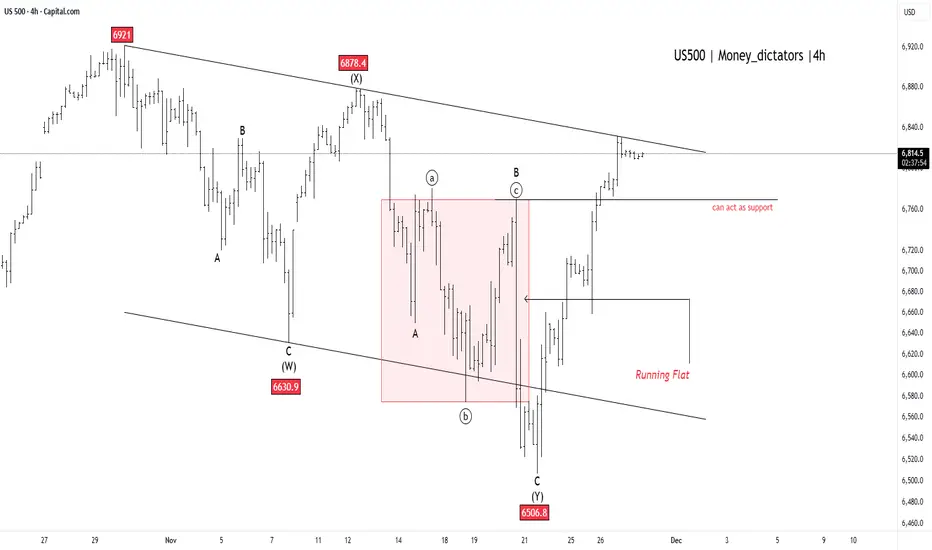
US500 - Breakout to New All-Time Highs!US500 suggests the market has put a definitive end to its recent downward movement, signaling that a major bullish trend is set to continue. This complex correction, which the chart labels as complete at the 6506.8 low, looks resolved. The index has since staged a powerful rebound and is currently pressing right up against the major upper trendline resistance, which defined the limits of the entire corrective phase.
A clear and sustained move above this key trendline will provide final confirmation that the correction is over and that a significant new upward wave has begun. The previous area of congestion around 6760 is now expected to act as strong support for the index, preventing any minor pullbacks from turning into a deeper decline. With the current price around 6,812.61 and the all-time high at 6,920.34 , the index is technically well-positioned to challenge and surpass this record high soon.
US500 Bullish Structure: Pullback → Breakout Continuation📈 SPX500/US500 Bullish Breakout Setup | Swing Trade Opportunity 🎯
🔥 Market Overview
Asset: S&P 500 Cash CFD (SPX500/US500)
Trade Type: Swing Trade (Medium-term)
Bias: BULLISH ✅
Current Price: ~$6,614 (Nov 20, 2025)
📊 Trade Setup & Technical Analysis
🎯 Strategy Confirmation
✅ Weighted Moving Average Pullback pattern confirmed
✅ Price consolidating near key resistance zone
✅ Bullish structure intact above major support levels
🚀 Entry Strategy
Breakout Entry: Enter AFTER confirmed breakout above $6,750 resistance
Wait for price to close above $6,750 with strong volume
Avoid premature entries; confirmation is key
Multiple position sizing recommended after breakout validation
🛑 Stop Loss Considerations
Suggested SL: $6,630 area
⚠️ IMPORTANT: This is a reference level only. Adjust your stop loss based on:
Your personal risk tolerance
Account size and position sizing
Trading strategy requirements
Trade at your own risk – customize stops to fit YOUR plan
🎯 Target Zones
Primary Target: $6,900-$6,950 zone
📌 Key Resistance Factors at Target:
Moving Average confluence acting as resistance barrier
Potential overbought conditions expected
Historical supply zone overlap
Risk of bull traps in this region
⚠️ Profit-Taking Strategy:
Consider scaling out near $6,900
Lock partial profits before $6,950
Trail stops for remaining position
This is YOUR trade – take profits when YOUR strategy signals
💰 Related Assets to Monitor
📉 Correlated US Indices
NASDAQ 100 (NAS100/US100) 📱
Tech-heavy index; leads SPX during risk-on moves
Correlation: ~85-90% positive
Key Level: Watch $21,000 breakout zone
DOW JONES 30 (US30) 🏭
Blue-chip indicator; confirms broad market strength
Correlation: ~80-85% positive
Key Level: $44,500 resistance critical
RUSSELL 2000 (US2000) 🏢
Small-cap indicator; risk sentiment gauge
Correlation: ~70-75% positive
Key Level: $2,400 breakout = bullish confirmation
💵 Dollar Correlation
US DOLLAR INDEX (DXY/USDX) 💵
Correlation: ~60-70% INVERSE (negative)
Dollar weakness = SPX strength typically
Key Level: Watch $106.50 support; break = SPX boost
🌍 Global Risk Assets
VOLATILITY INDEX (VIX) ⚡
Correlation: ~80% INVERSE (fear gauge)
VIX below $15 = bullish SPX environment
VIX spike above $20 = caution signal
GOLD (XAUUSD) 🥇
Correlation: Variable ~30-40% (flight to safety indicator)
Gold weakness + SPX strength = risk-on confirmed
📋 Risk Disclosure
⚠️ CRITICAL REMINDERS:
I am NOT providing financial advice
These levels are reference points only
YOU must determine your own entry, stop loss, and take profit levels
Trade with money you can afford to lose
Market conditions change rapidly – adapt accordingly
Past performance does not guarantee future results
🎓 Professional Risk Management:
Never risk more than 1-2% of capital per trade
Use proper position sizing calculators
Set alerts for key levels, don't watch charts 24/7
Have a written trading plan before entering
🔔 Action Plan Checklist
✅ Monitor price action near $6,750
✅ Confirm breakout with volume and candle close
✅ Set alerts for correlated assets (DXY, VIX, NAS100)
✅ Calculate position size based on YOUR risk tolerance
✅ Define exit strategy BEFORE entry
✅ Review market news and economic calendar
💬 Final Thoughts
This setup offers a risk-defined swing trade opportunity on the S&P 500 with clear technical levels. The weighted moving average pullback pattern provides structural support for the bullish thesis, while the $6,750 breakout level offers a defined entry trigger.
Remember: Markets are unpredictable. This analysis is educational and reflects technical observations only. YOUR trading decisions are YOUR responsibility.
🙏 Trade Safe, Trade Smart
If this analysis helps you, drop a like 👍 and follow for more setups! Let's build wealth together responsibly.
#SPX500 #SP500 #US500 #SwingTrade #Breakout #TechnicalAnalysis #StockMarket #Trading #ForexTrading #IndexTrading #BullishSetup #TradingView #MarketAnalysis
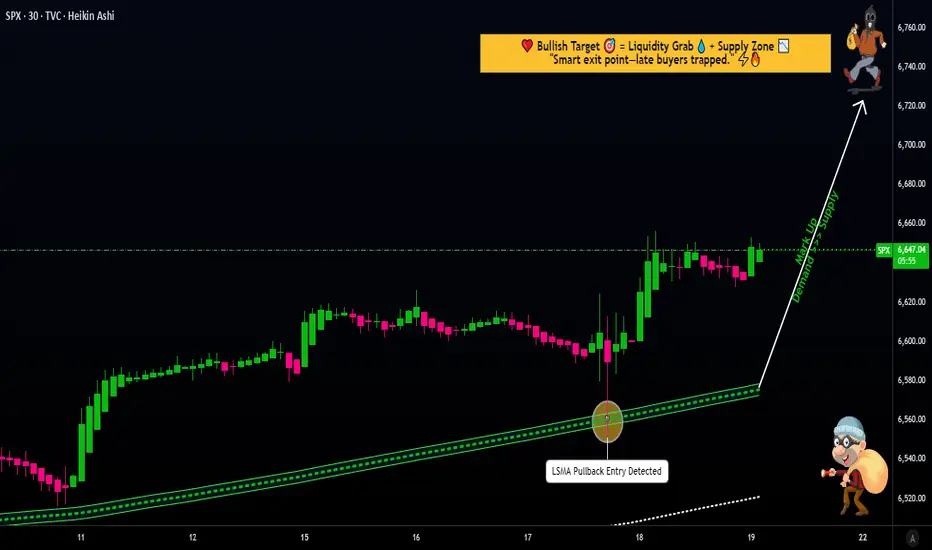
S&P 500 Bullish Layers Setup — Demand Zone Reload Opportunity!🟩 Asset:
US500 / S&P 500 — Index Market Trade Opportunity Guide (Swing / Day Trade)
💡 Trade Plan Overview
A bullish continuation plan is confirmed as the index builds strong demand-zone pressure, supported by broad fundamental economic drivers including resilient U.S corporate earnings, easing treasury yields, and steady sector rotation behavior.
This setup favors structured long positioning using disciplined multi-layer entries.
🎯 Trade Execution Plan (Thief Strategy — Layering Entry Method)
🟦 Entry Strategy (Layer Entries)
You can enter at any price, but here is the structured Thief layering approach:
Buy Limit Layer 1: 6,750
Buy Limit Layer 2: 6,800
Buy Limit Layer 3: 6,850
(You may add more layers if you prefer deeper dips — fully customizable to your personal risk appetite.)
🛡️ Stop Loss (SL)
Thief SL: 6,650
👥 Dear Ladies & Gentlemen (Thief OG’s), feel free to adjust SL based on your approach and risk preference. This SL is not mandatory — trade at your own risk tolerance.
🎯 Target Zone (TP)
Main Target: 7,050
The moving average cluster above current price acts as a strong resistance. Market structure signals a potential overbought trap, so locking profits as we approach 7,050 is wise.
👥 Dear Ladies & Gentlemen (Thief OG’s), this TP is not compulsory — take profits whenever your system confirms opportunities.
📊 Key Market Notes
Demand zones are holding strongly
Momentum shifts show bullish continuation
Price action respects MA levels
Fundamentals + rotation fuels upside
Trap zones above — manage exits properly
🔗 Correlation Watchlist (Related Markets You Must Track)
Monitoring correlated markets strengthens decision-making. Here are highly relevant pairs/assets:
💲 1. US Dollar Index (DXY)
Why important:
S&P 500 typically moves inverse to the USD.
When DXY weakens, US500 often gains momentum.
Strong USD → pressure on equities, especially tech.
Watch for:
USD pullback = bullish support for US500
USD breakout = equities face resistance
💲 2. US10Y / US Treasury Yields
Correlation:
Yields rising = stock market weakness
Yields falling = S&P 500 bullish fuel
Watch for:
Yields softening → risk-on flows
Freight in yield spikes → temporary pullbacks
💲 3. VIX (Volatility Index)
Correlation:
Low VIX = stable bullish conditions
Rising VIX = possible correction / trap
Watch for:
VIX drop under key zones → bullish confirmation
Spike above resistance → protect profits
💲 4. NASDAQ 100 (US100)
Correlation:
Strong tech = strong S&P 500
Tech weakness often leads broader index lower
Watch for:
Mega-cap earnings cycles
AI sector momentum
Bond yield reaction on tech stocks
💲 5. Crude Oil (USOIL / WTI)
Correlation:
High oil prices → inflation pressure → Fed concerns
Lower oil → relief → bullish S&P 500
Watch for:
Oil spike = possible S&P 500 pullback
Oil cool down = index strengthens
💲 6. Gold (XAU/USD)
Correlation:
Indirect & risk sentiment-based
Risk-off flows go into gold → equities may pause
Watch for:
Gold breakout = risk-off environment
Gold drop = risk-on supports S&P 500
📘 Final Thoughts
This setup follows the well-tested Thief layering strategy, combining technical demand zones with macroeconomic alignment. Stick to your personal risk comfort, manage layers wisely, and let price action guide exits.

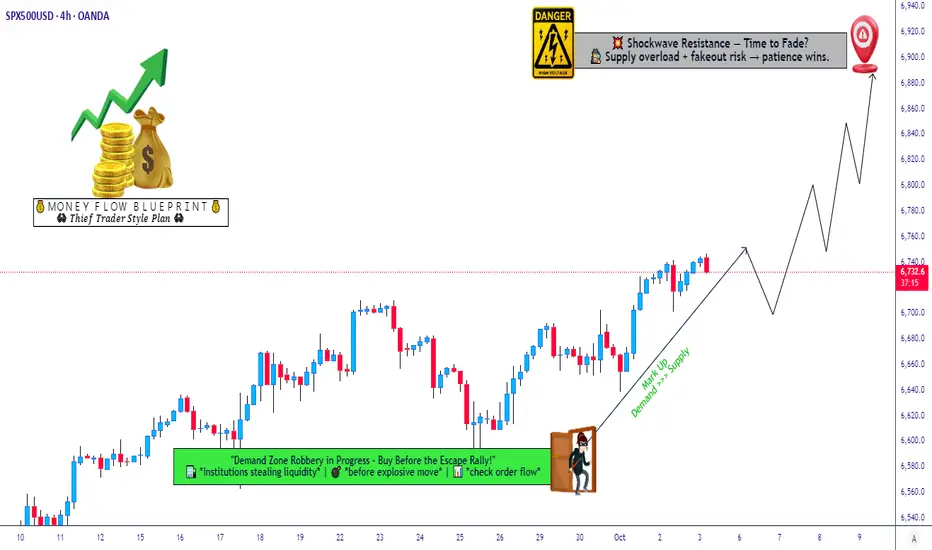
SPX500 Trading Strategy Explained: From Entry to Exit⚡ SPX500 “STANDARD & POOR” Indices Market Wealth Strategy Map ⚡
(Swing / Day Trade Plan – Thief OG Style)
🧭 Plan
📈 Bias: Bullish confirmed with 30m LSMA pullback + 0.786 Fibonacci-based MA confluence.
💡 Entry Approach (Thief Layering Strategy™):
Instead of one-shot entry, I place multiple buy-limit layers to average into strength. Example setup:
Buy limit: 6600
Buy limit: 6620
Buy limit: 6640
👉 You can extend or adjust the layering based on your own strategy.
🎯 Stop Loss (SL)
This is my Thief SL @6560.
⚠️ Note to Ladies & Gentlemen (Thief OG’s): This SL is not a recommendation. Use your own judgment — protect your loot at your own risk.
💰 Target (TP)
📌 6750 — sitting at strong resistance + overbought zone + possible bull-trap.
⚠️ Again, OG’s — this is not financial advice. Take profit when it fits your plan. Secure the bag, then enjoy the loot!
🔍 Related Pairs to Watch
Keep an eye on these correlated assets to confirm the SPX500’s move:
NASDAQ:NDX (Nasdaq 100): Tech-heavy index with strong correlation to SPX500. If tech stocks are pumping, it’s a bullish signal for our trade. 📊
TVC:DXY (US Dollar Index): A weaker dollar often boosts equities. Watch for inverse correlation—DXY dropping could mean SPX500 is ready to fly! 🚀
TVC:VIX (Volatility Index): Low VIX levels signal market calm, supporting our bullish setup. A spike in VIX could warn of trouble, so stay sharp! ⚡
Key Correlation Insight: SPX500 often moves in tandem with NASDAQ:NDX due to shared tech giants (think Apple, Microsoft). If NASDAQ:NDX is rallying, it’s a tailwind for our trade. Conversely, a rising TVC:DXY or TVC:VIX could signal caution.
📝 Thief Note
Dear Ladies & Gentlemen (Thief OG’s):
This map is my personal swing/day trade playbook — not a fixed recommendation. Layer entries, cut losers fast, and loot when you can. Market moves are wild; manage risk like a true OG.
✨ “If you find value in my analysis, a 👍 and 🚀 boost is much appreciated — it helps me share more setups with the community!”
⚠️ Disclaimer: This is a Thief-style trading strategy shared just for fun & educational vibes. Not financial advice. DYOR & trade responsibly.
SPX 500 Swing/Day Trade Plan | Bullish Layers & Risk Guard✨ SPX 500 Index | Market Wealth Strategy Map (Swing/Day Trade) ✨
🚨 Plan: Bullish bias with Thief Strategy (layered limit entries).
🕹️ Style: Multiple buy-limit orders placed at different levels (“layering method” for smarter entries).
🎯 Entry Plan (Layered Thief Style)
🔑 Buy Limit Layers: 6660, 6680, 6700, 6720
➕ You can add more layers if market conditions allow.
🧠 Idea: Scaling in like a true Thief 🕶️ — stealing the best spots!
🛑 Stop Loss (SL)
Thief SL: @ 6640
⚠️ Note: Dear Ladies & Gentlemen (Thief OG’s), I’m not recommending you to use only my SL.
It’s your money → your choice → your risk management.
🎯 Target (TP)
Primary Target: @ 6900
🌀 Why? Shockwave resistance ⚡ + overbought zones 📈 + liquidity traps 🪤.
⛑️ Again, it’s your choice to set your own TP — escape with profits when you feel comfortable!
📊 Related Pairs & Correlations to Watch
CAPITALCOM:US500 / SP:SPX / CME_MINI:ES1! → Direct correlation to SPX 500.
NASDAQ:NDX / NASDAQ 100 → Often leads tech momentum, affects SPX swings.
TVC:DXY (US Dollar Index) → Strong dollar = pressure on indices. Weak dollar = fuel for bulls.
CAPITALCOM:US30 (Dow Jones) → Sometimes diverges from SPX, offering confluence signals.
TVC:VIX → Volatility Index — spikes = watch out for fakeouts / liquidity grabs.
💡 Key Takeaways
✅ Thief layering entry style = Scaling smarter, not harder.
✅ SL/TP = Flexible to your own trading psychology & risk appetite.
✅ Always respect risk management & don’t copy-paste blindly.
✅ Remember: markets love traps — be the thief, not the victim.
✨ “If you find value in my analysis, a 👍 and 🚀 boost is much appreciated — it helps me share more setups with the community!”
⚠️ Disclaimer: This is a Thief-style strategy shared just for fun & market learning purposes.
Not financial advice — trade at your own risk!
#SPX500 #US500 #SP500 #SPX #ThiefStrategy #DayTrading #SwingTrading #IndexTrading #MarketAnalysis #StockMarket
$SPX500 Swing Trade: Bullish SMA Setup!📈 S&P 500 CFD: Thief’s Bullish Pullback Plan 🤑💰
🚨 Swing/Day Trade Setup: S&P 500 Index CFDSteal profits with this 200 SMA Pullback Plan using the "Thief" layered entry strategy! 📊💸 Below is a detailed breakdown combining technicals, fundamentals, and market sentiment to help you navigate this bullish opportunity. Let’s dive in! 🐂
🎯 Trading Plan Overview
Asset: S&P 500 Index CFD ( FOREXCOM:SPX500 )
Bias: Bullish 🐂
Strategy: Pullback to 200 SMA with layered "Thief" limit orders for entries
Why This Plan?
Technicals: The S&P 500 is riding record highs with strong momentum, supported by the 200 SMA as a dynamic support level.
Fundamentals: Cooling inflation (PPI -0.1% vs. +0.3% expected), 100% Fed rate cut probability, and robust corporate earnings (+10% in 2025, +13% in 2026) fuel bullish sentiment.
Sentiment: Neutral Fear & Greed Index (51/100) with low volatility (VIX ~15.04) and AI-driven institutional flows (e.g., Oracle +30%).
📊 Thief’s Technical Setup
Entry Strategy:
Use the Thief Layered Entry approach with multiple buy limit orders to catch pullbacks:
🔔 Buy Limit 1: $6,460
🔔 Buy Limit 2: $6,480
🔔 Buy Limit 3: $6,500
🔔 Buy Limit 4: $6,520
💡 Pro Tip: Adjust layer levels based on your risk tolerance and market conditions. You can enter at any price level or add more layers for flexibility!
Entry Trigger: Pullback to the 200 SMA for optimal risk-reward.
Stop Loss (SL):
Suggested "Thief" SL: $6,440 (below key support).
⚠️ Note: Adjust your SL based on your risk management and strategy. Trade at your own risk, dear Traders!
Take Profit (TP):
Target: $6,700 (near resistance, potential overbought zone, or "police barricade" trap).
🚨 Note: Escape with profits before resistance hits! Set your TP based on your goals—don’t blindly follow mine. Take money at your own risk!
📡 Real-Time Market Data (10 Sept 2025, UTC+1)
Daily Change: +37.43 points (+0.57%)
YTD Performance: Record highs driven by AI optimism and Fed rate cut expectations.
😰😊 Fear & Greed Index
Current Sentiment: Neutral (Score: 51/100)
Breakdown:
📈 Market Momentum: Bullish (S&P 500 above 125-day MA).
🌬️ Volatility (VIX): Low (~15.04), signaling calm markets.
🛡️ Safe Haven Demand: Moderate (bonds lagging stocks).
💰 Junk Bond Demand: Slight greed (narrowing yield spreads).
⚖️ Options Activity: Balanced put/call ratio.
🏛️ Macro & Fundamental Analysis
Producer Price Index (PPI): August PPI fell -0.1% (vs. +0.3% expected), easing inflation concerns.
Fed Rate Cut: 100% probability of a 25-50 bps cut in September 2025.
Labor Market: Weaker-than-expected (911K jobs revised down through March 2025).
Corporate Earnings: Strong outlook (+10% growth in 2025, +13% in 2026).
Key Drivers:
🚀 AI investment surge (e.g., Oracle +30%, Nvidia strength).
🌍 Geopolitical risks (Poland-Russia tensions, Middle East concerns).
📉 Trade policy uncertainties (Trump tariff threats).
🐂🐻 Sentiment Analysis
Institutional Outlook: Cautiously optimistic
🏦 Deutsche Bank & Wells Fargo: S&P 500 targets at 7,000+ by 2026.
💡 Focus: AI capex and earnings resilience.
Retail Trader Mood: Mixed but leaning bullish
📈 Meme stock activity (e.g., GameStop +10%).
₿ Crypto correlation (Bitcoin at $111.9K, Solana at 7-month highs).
⚡ Why This Plan Stands Out
Technical Edge: The 200 SMA pullback is a proven strategy for swing/day traders, offering high-probability entries.
Thief Strategy: Layered limit orders maximize flexibility and reduce risk of missing the move.
Macro Support: Cooling inflation, Fed rate cuts, and AI-driven earnings create a bullish backdrop.
Sentiment Boost: Neutral sentiment with low volatility supports steady upside potential.
Risks to Watch: Geopolitical shocks, overvaluation concerns, and seasonal market weakness.
🔍 Related Pairs to Watch (in USD)
Nasdaq 100 CFD ( NASDAQ:NDX ): Tracks tech-heavy AI stocks driving S&P 500 momentum.
VIX ( TVC:VIX ): Monitor volatility spikes for potential reversals.
US 10-Year Treasury Yield ( TVC:TNX ): Impacts risk sentiment and stock valuations.
FX:USDJPY : Correlates with risk-on/risk-off market moves.
Bitcoin ( BITSTAMP:BTCUSD ): Tracks retail sentiment and risk appetite.
🚨 Key Takeaways
🏆 S&P 500 at record highs, supported by soft PPI and Fed cut expectations.
😎 Neutral sentiment with a greedy tilt if macro data improves.
🤖 AI trade dominates institutional flows, powering bullish momentum.
📅 Watch upcoming CPI data and Fed meeting for next catalysts.
✨ “If you find value in my analysis, a 👍 and 🚀 boost is much appreciated — it helps me share more setups with the community!”
#SPX500 #SwingTrading #DayTrading #ThiefStrategy #Bullish #TechnicalAnalysis #Macro #AI #FedRateCut #TradingIdeas

S&P500 at Resistance: Nvidia Earnings Could Decide the Next Move📊 US500 (S&P 500) has rallied recently 📈, but it’s still struggling to break through the current highs 🔼🧱.
💡 I believe the next move could hinge heavily on Nvidia’s earnings report tomorrow 🖥️💵.
👉 If the report is positive, watch for a break and retest above the current range to position long 🚀.
👉 If the report is negative, we could see the broader stock market sell off 📉.
⚠️ This is for educational purposes only and not financial advice 📚🔒

US500: Bulls Pause as Pullback Risks GrowUS500 has been riding an impressive uptrend, with buyers pushing the index to fresh highs above 6,440, but the recent stalling near resistance suggests that momentum may be losing steam. With growth concerns, central bank caution, and a round of key economic data on deck, the risk of a corrective pullback is building. This setup highlights the importance of watching whether support levels hold or if sellers gain the upper hand.
Current Bias
Bearish (Short Term) – While the broader trend remains bullish, near-term technicals and macro uncertainty point toward a corrective pullback.
Key Fundamental Drivers
US Earnings Season: Mixed corporate earnings, with strength in tech offset by weakness in cyclicals.
Fed Policy: Markets are still weighing timing of potential rate cuts, but sticky inflation data and cautious Fed commentary keep rates elevated.
Bond Yields: US yields remain relatively high, pressuring equities when safe-haven flows emerge.
Macro Context
Interest Rates: The Fed is in a “wait-and-see” mode, balancing sticky services inflation against slowing growth. Rate cuts are still priced for later this year, but not aggressively.
Economic Growth: US economy shows signs of slowing, with softer retail sales and housing data, though labor markets remain resilient.
Commodities/Flows: Energy costs are stabilizing, but higher oil prices in recent weeks could add inflationary pressure.
Geopolitics: Trade tensions, tariffs, and Middle East instability add layers of risk, supporting defensive positioning.
Primary Risk to the Trend
A surprise dovish shift from the Fed or stronger-than-expected US earnings could quickly reignite bullish momentum and push US500 higher, invalidating the pullback scenario.
Most Critical Upcoming News/Event
FOMC Minutes & Powell Speeches – Markets will look for clarity on rate cut timing.
US CPI & PPI Data – Any upside surprises could weigh heavily on equities.
Leader/Lagger Dynamics
The US500 is a leader, often dictating global equity sentiment. Movements in US500 ripple into NASDAQ, DAX, FTSE, and risk-sensitive FX pairs such as AUD/JPY. Its role as a global risk benchmark makes it highly influential.
Key Levels
Support Levels: 6,370, 6,231, 5,920
Resistance Levels: 6,447 (recent high), 6,500 psychological barrier
Stop Loss (SL): 6,480 (above recent highs)
Take Profit (TP):
TP1: 6,370
TP2: 6,231
TP3: 5,920
Summary: Bias and Watchpoints
US500 bias is shifting to neutral-to-bearish, with the index showing signs of fatigue at highs around 6,440–6,450. A pullback toward 6,370 → 6,231 is possible, with 5,920 as an extended target if risk sentiment deteriorates. A protective stop at 6,480 is key in case bulls regain momentum. Traders should keep a close eye on Fed communication and US inflation data, as these remain the most powerful catalysts for near-term direction. With the US500 acting as a leader for global equities, its moves will likely shape broader market sentiment across stocks, indices, and even risk-sensitive currencies.

US500: Rebound Setup After Sharp Pullback – Key Support HoldingUS500 has experienced a strong corrective move after an extended bullish run but is now showing signs of stabilizing near a key support area. This zone aligns with both technical retracement levels and the market's reaction to fundamental shifts—particularly the dovish repricing of the Fed following weak US jobs data.
Technical Analysis (4H Chart)
Pattern: After a strong uptrend, price faced a steep correction, forming a potential short-term reversal setup.
Current Level: 6,235, holding above the 6,217 support zone.
Key Support Levels:
6,217 (immediate support; key defense zone for bulls).
6,171 (38.2% retracement, secondary support if deeper pullback occurs).
Resistance Levels:
6,272 (23.6% retracement and initial resistance).
6,360 (upper resistance zone and retest of recent breakdown).
6,429/6,436 (recent high and target if bullish momentum resumes).
Projection: A rebound from current levels could push US500 back toward 6,360–6,430 if support holds.
Fundamental Analysis
Bias: Neutral-to-bullish as macro drivers favor a recovery from pullback.
Key Fundamentals:
Fed Policy: Weak US jobs (+73K) and downward revisions have solidified rate cut expectations (~75% probability in September), boosting equity sentiment.
Inflation: Market awaits US CPI; softer data would further support equities.
Tariffs: While Trump’s tariffs create a medium-term risk for earnings, immediate Fed easing bets outweigh these concerns.
Risk Sentiment: Global risk remains supported by lower yields and optimism about Fed easing.
Risks:
Hot US CPI could reverse cut expectations, pressuring equities.
Geopolitical risks or tariff escalation could trigger renewed selling.
Key Events:
US CPI and PPI.
Fed speeches and rate expectations.
Earnings reports from key US companies.
Leader/Lagger Dynamics
US500 is a leader, driving global risk sentiment and influencing risk-sensitive assets like AUD/USD, NZD/USD, and JPY crosses.
Summary: Bias and Watchpoints
US500 is neutral-to-bullish, stabilizing at key support (6,217) after a sharp correction. Fed cut expectations and risk-on sentiment support the upside scenario, targeting 6,360–6,430 if US CPI aligns with softer inflation. However, a hot CPI print could invalidate this rebound and trigger another leg lower.

US500 Bearish Idea: Waiting for Structure Break ConfirmationWatching the SPX US500 right now 📈 — it’s rallied hard with strong momentum and is pushing into a key resistance level ⚠️. Since price is overextended, I’m expecting a pullback towards equilibrium on the current move 🔄. My bias is bearish from this level 🔻, with entry dependent on a break in structure on the 30-min timeframe ⏳.
All is explained in the video 🎥 (not financial advice).

Rob the Rally SPX500: Enter Before Resistance Catches You🦹♂️💰**“SPX500 Street Heist” – Thief-Style Robbery Plan for Bulls!**📈💸
(Powered by Thief Trader's Market Robbing Tactics – Scalp | Swing | Day Trade Edition)
🌍Hello, Global Money Hunters!
📣 Salaam, Bonjour, Ola, Hola, Hallo, Marhaba & Welcome to the heist floor! 🎩💼
Thief Trader is back again with a loaded plan to rob the market clean — this time targeting the mighty SPX500 / US500 🎯. Based on a fusion of technical setups, macro sentiment, and the Thief Trading System, we’ve set our sights on the next breakout vault of Wall Street.
🎯 The Gameplan – Heist the Resistance Vault
The index is entering a high-risk resistance barricade — overbought, consolidated, and heavily guarded by bearish robbers (sellers). This is the zone where the market police lurk and trend reversals often get triggered. However, smart thieves always plan with precision.
Here’s the mission briefing:
🔓Entry Zone (Break-in Point)
💥 “The vault is open — grab the bullish loot!”
Enter Long anywhere close to market price or on pullbacks near recent swing lows/highs.
Preferred timeframes: 15-min to 30-min for sniper-level accuracy.
Deploy DCA-style limit orders (layered entries for maximum control).
🛑Stop Loss (Escape Hatch)
Base SL on recent swing low candle wicks on the 4H timeframe.
Suggested: ~6250.00 — but adapt based on your risk appetite, lot size, and position stacking.
📈Target / Loot Location
🎯 Primary Take-Profit: 6450.00
Or… pull out early if you spot resistance fighters guarding the vault.
Use trailing SL to secure gains and manage getaway.
⚡Scalper’s Notice
Only Long-side allowed!
Got big capital? Jump in now.
Running low? Tag along with swing traders and follow the robbery protocol.
Always protect your bag with dynamic trailing stops.
🧠Fundamental Fuel Behind the Plan
Bullish sentiment across major indices
Macro trends, COT positioning, sentiment outlook, and intermarket analysis all greenlit
Geopolitical and Fed tone supportive — tap into real data before entering
👉 Always analyze: News, Fundamentals, Sentiment, COT reports, and macro conditions.
🚨NEWS ZONE ALERT – No Loud Moves!
Avoid entry during major economic news drops
Use trailing SLs to guard profits
Don’t let your open trades get caught in the chaos of news releases!
💥Let’s Boost the Thief Army!
Smash the BOOST button 💖 to power up the robbery crew.
Support the strategy, share the love, and stay ahead of the game using Thief Trading Style. Every trade is a step closer to freedom from financial traps. 🚀💰🎉
📌Disclaimer: This is a general market analysis for educational purposes and should not be considered personal financial advice. Please evaluate your own risk management strategy before placing trades.
📌Markets shift fast — stay flexible, stay alert, and always rob smart.
🔥Stay locked in for the next heist plan — Thief Trader signing off for now…
💸💼📈 Trade smart. Rob harder. 🤑🦹♂️📊

US500 Bulls Assemble | Breakout Heist Strategy📈🚨 MASTER HEIST PLAN: “SPX500 ROBBERY – THIEF TRADING STYLE 🔥💸” 🚨📈
(The Ultimate Long Strategy Blueprint for Smart Day/Swing Traders)
🌍 Greetings to All Market Bandits, Bullish Burglars, and Chart Snipers!
Hola! Bonjour! Ola! Hallo! Marhaba! 🙌
🦹♂️This is your friendly chart thief checking in with the latest SPX500/US500 masterplan!
This isn’t just a trade—it’s a heist 🎯. We’re not here to participate, we’re here to dominate! Welcome to the Thief Trading Style, where we map, trap, and snatch those pips with ruthless precision. 🧠🔍💰
🚀 THIEF TRADE SETUP - SPX500/US500
A mix of technical sniper entries + fundamental black ops analysis = 💸 Maximum Extraction. 💸
🎯 ENTRY PLAN: THE BREAKOUT HEIST
📍Buy Entry Zone: Wait for the clean breakout + candle close above 6270.00.
"The vault opens once we clear that wall. Let the bullish getaway begin!" 💥🚪📈
🛠️Thief Tips for Entry:
Use Buy Stop Orders above resistance levels.
OR layer in Buy Limit Orders near recent pullbacks (15/30m swing zones) using DCA Style (Dollar Cost Average layering like a pro).
Want stealth mode? Set that alert (alarm), and strike when the breakout sings. 🔔🎯
🛑 STOP LOSS – PROTECT THE LOOT
🧨Set your SL smart—beneath the nearest swing low using the 2H timeframe for stronger structure.
💬 “Look, don’t gamble. A thief knows when to run. Set that stop where I showed ya, or risk losin’ the bag.” 💼💣
❗Your SL should reflect your risk per trade, lot size, and number of entries. It’s your getaway plan—don’t mess it up.
💥 TARGETS – WHERE WE CASH OUT
🏴☠️Primary Take Profit (TP1): 6310.00
🏴☠️Secondary Take Profit (TP2): 6370.00
💹 Scalp Traders: Stick to the Long Side Only. Ride the momentum, but use trailing SL to lock it in.
🔍 THIEF FUNDAMENTAL INTEL: WHY THIS IS OUR MOMENT
Current SPX500 bullishness driven by:
✅ Positive macro & geopolitical tailwinds
✅ Institutional positioning (COT reports)
✅ Intermarket analysis showing strong correlations
✅ Momentum building with sentiment and volume
📌 Stay sharp—check all your fundamental reports, news catalysts, and sentiment tools before executing your move. Smart thieves plan every detail. 🎓📊
⚠️ NEWS RELEASE REMINDER
📢 News = Chaos. Don’t get caught in the spray:
🔒Avoid entering trades just before big announcements.
🚀 Use Trailing SL to secure profit if you're already in.
Stay agile. Stay smart. Stay rich. 💼🚁
❤️ SUPPORT THE HEIST – HIT THAT BOOST BUTTON!
👊 Liked the plan? Hit the Boost to join the elite robbery crew.
Every boost fuels the mission. Every like sharpens the strategy. Let's build a team of smart, profitable traders. 🚀💸🔥
🧠 Remember: This is general analysis – not financial advice. Manage your risk like a true thief. Stay updated. Adapt fast. Don't get caught. 🕵️♂️
🎉See you in the next Heist Plan! Keep your tools sharp, your charts cleaner, and your profit bags fatter. 🤑🔥

S&P 500 Counter-Trend Setup After Bullish Week US500Currently watching the S&P 500 (US500) closely 👀. The index has been in a strong bullish trend 📈, but I’m now evaluating a potential counter-trend opportunity.
Given the strength we’ve seen this week — possibly a “foolish rally” — there’s a chance we’ve either printed or are close to printing the high of the week 🧱. That opens the door for a retracement setup, particularly as we head into Monday’s open 🗓️.
🧠 Trade idea: If we get a bearish market structure break, I’ll be looking to enter short — targeting a 1R take profit initially, and holding a portion for a 2R–3R extension 🎯.
Friday sessions, especially after strong trends, often present clean intraday pullbacks — and when Monday’s low is set early, it can trap late buyers and fuel the move 📉.
⚠️ This is not financial advice — just sharing my thought process and trade plan.

S&P 500 BULLISH GRAB: Steal These Gains Before the Trap Closes!🚨 E-MINI S&P 500 HEIST: Bullish Loot Before the Market Turns (Thief Trading Blueprint) 🚨
🌟 Hola! Oi! Bonjour! Ciao! Guten Tag! 🌟
Attention all Market Bandits & Index Raiders! 🏴☠️📊💰
🔥 Thief Trading Intel: We're targeting ES1! (E-Mini S&P500) for a potential bullish breakout! Long entry only—approaching high-risk Red Zone: overbought, consolidating, and ready for a move. Don't let the bears steal your profits!
"Grab your gains and disappear into the night—you've earned this steal!" 💰🌙
🚪 ENTRY: The Vault is Cracked!
📈 "Swipe bullish positions at any price—the heist is ON!"
Buy Limit orders near swing lows/highs (15-30 min TF)
📌 Pro Tip: SET PRICE ALERTS! Don't miss the move
🛑 STOP LOSS: Escape Route
📍 Smart Thief SL: Nearest swing low (4H timeframe)
📍 Adjust based on your risk tolerance & position size
🎯 TARGET: Take the Money & Run!
🎯 6260.00 (or exit early if the market turns)
⚡ SCALPERS' QUICK GRAB
👀 Long positions ONLY!
Big accounts? Strike now
Small accounts? Ride with swing traders
Trailing SL = Your Getaway Car!💨
📢 WHY THIS HEIST? (S&P 500 Setup)
Neutral trend with bullish potential! Watch for:
Fundamentals (COT, Macro Data, Geopolitics)
Market Sentiment & Sector Rotation
Index-Specific Patterns
🔗 Full analysis? Check our bio0 linnks! 👉🏻👉🏻👉🏻
⚠️ WARNING: News = Danger Zone! 📰🚨
Economic reports move markets! Protect your loot:
❌ Avoid new trades during news
🔒 Trailing stops lock in profits
💖 SUPPORT THE HEIST CREW!
💥 SMASH THAT BOOST BUTTON! 💥
More boosts = bigger future scores!
Stronger crew = more profits for all!
Trade like a thief, profit like a king! 👑💰
Next heist coming soon—stay sharp! 🎯🤫

US500/SPX500 Heist Plan: Grab the Index CFD Loot!Greetings, Profit Pirates! 🌟
Money chasers and market rogues, 🤑💸 let’s execute a daring heist on the US500/SPX500 Index CFD market using our 🔥Thief Trading Style🔥, powered by sharp technicals and deep fundamentals. Stick to the charted long-entry strategy, aiming to cash out near the high-risk Pink zone. Stay alert for overbought conditions, consolidation, or a trend reversal trap where bearish bandits dominate. 🏴☠️💪 Lock in your profits and treat yourself—you’ve earned it! 🎉
Entry 📈
The vault’s cracked open! 🏦 Snatch the bullish loot at the current price—the heist is on! For precision, place Buy Limit orders on a 15 or 30-minute timeframe for pullback entries, targeting a retest of the nearest high or low.
Stop Loss 🛑
📍 Set your Thief SL at the recent swing low (5640) on a 4H timeframe for day trades.📍 Adjust SL based on your risk appetite, lot size, and number of orders.
Target 🎯
Aim for 6160 or slip out early to secure your gains! 💰
Scalpers, Eyes Sharp! 👀
Focus on long-side scalps. Big capital? Dive in now! Smaller funds? Team up with swing traders for the robbery. Use a trailing SL to protect your loot. 🧲💵
US500/SPX500 Market Intel 📊
The Index CFD is riding a bullish surge, 🐂 fueled by key drivers. Dive into fundamentals, macroeconomics, COT reports, geopolitical news, sentiment, intermarket analysis, index-specific insights, positioning, and future trend targets for the full picture. 🔗check
⚠️ Trading Alert: News & Position Safety 📰
News can jolt the market! To safeguard your haul:
Avoid new trades during news releases.
Use trailing stops to lock in profits and limit losses. 🚫
Join the Heist! 💥
Back our robbery plan—hit the Boost Button! 🚀 Let’s stack cash effortlessly with the Thief Trading Style. 💪🤝 Stay ready for the next heist, bandits! 🤑🐱👤🎉

up or down...Hello friends🙌
🔊As you can see, the US500 index has been identified with several resistance encounters and the good support that the price has been able to break the resistance and turn it into support. Now, according to today's news, it seems that the price is targeting higher targets that we have identified for you.
In case of correction, it has strong support ahead of it, which we have identified with a white line, but don't forget that buyers have entered...📈
🔥Join us for more signals🔥
Trade safely with us.

"US500/SPX500" Index Market Money Heist Plan (Day / Scalping)🌟Hi! Hola! Ola! Bonjour! Hallo! Marhaba!🌟
Dear Money Makers & Robbers, 🤑 💰💸✈️
Based on 🔥Thief Trading style technical and fundamental analysis🔥, here is our master plan to heist the "US500 / SPX500" Index CFD Market. Please adhere to the strategy I've outlined in the chart, which emphasizes long entry. Our aim is to escape near the high-risk ATR Zone. Risky level, overbought market, consolidation, trend reversal, trap at the level where traders and bearish robbers are stronger. 🏆💸"Take profit and treat yourself, traders. You deserve it!💪🏆🎉
Entry 📈 : "The heist is on! Wait for the MA breakout (5500) then make your move - Bullish profits await!"
however I advise to Place Buy stop orders above the Moving average (or) Place buy limit orders within a 15 or 30 minute timeframe most recent or swing, low or high level for Pullback entries.
📌I strongly advise you to set an "alert (Alarm)" on your chart so you can see when the breakout entry occurs.
Stop Loss 🛑: "🔊 Yo, listen up! 🗣️ If you're lookin' to get in on a buy stop order, don't even think about settin' that stop loss till after the breakout 🚀. You feel me? Now, if you're smart, you'll place that stop loss where I told you to 📍, but if you're a rebel, you can put it wherever you like 🤪 - just don't say I didn't warn you ⚠️. You're playin' with fire 🔥, and it's your risk, not mine 👊."
📍 Thief SL placed at the recent/swing low level Using the 1H timeframe (5200) Day trade basis.
📍 SL is based on your risk of the trade, lot size and how many multiple orders you have to take.
🏴☠️Target 🎯: 5750 (or) Escape Before the Target
🧲Scalpers, take note 👀 : only scalp on the Long side. If you have a lot of money, you can go straight away; if not, you can join swing traders and carry out the robbery plan. Use trailing SL to safeguard your money 💰.
💰💵💴💸"US500/SPX500" Index CFD Market Heist Plan (Day / Scalping Trade) is currently experiencing a bullishness🐂.., driven by several key factors.👆👆👆
📰🗞️Get & Read the Fundamental, Macro economics, COT Report, Geopolitical and News Analysis, Sentimental Outlook, Intermarket Analysis, Index-Specific Analysis,Positioning and future trend targets with Overall Score...... go ahead to check 👉👉👉🔗🔗
⚠️Trading Alert : News Releases and Position Management 📰 🗞️ 🚫🚏
As a reminder, news releases can have a significant impact on market prices and volatility. To minimize potential losses and protect your running positions,
we recommend the following:
Avoid taking new trades during news releases
Use trailing stop-loss orders to protect your running positions and lock in profits
💖Supporting our robbery plan 💥Hit the Boost Button💥 will enable us to effortlessly make and steal money 💰💵. Boost the strength of our robbery team. Every day in this market make money with ease by using the Thief Trading Style.🏆💪🤝❤️🎉🚀
I'll see you soon with another heist plan, so stay tuned 🤑🐱👤🤗🤩

S&P500 Chasing a Retrace - Waiting for Equilibrium After Rally🗓️ Yesterday, I mentioned watching the S&P 500 for a retrace to find a potential long entry. But with the US-China tariff agreement announced, the market rallied hard 🚀—a clear positive for stocks. We didn’t get much of a pullback, and right now, I see the S&P 500 as overextended. I’m not looking to jump in at these premium levels. Instead, I’m waiting for a Fibonacci retrace back down into equilibrium on the current swing for a better opportunity. 👀
My plan: I’ll watch for a bearish break of structure to signal a retrace, then monitor price action as we approach support. If support holds and we get a bullish break of structure, that’s when I’ll look to get involved. 🔄
Just sharing my idea here—this isn’t financial advice! 📢

Cautious Optimism: What’s Next for the S&P 500US500 My Outlook for the Next Week:
Given the relentless bullishness on the chart and the current backdrop, here’s how I see the next week playing out:
Short-Term: The S&P 500 may continue to consolidate or experience mild pullbacks as investors digest recent gains and await fresh catalysts. Sector rotation could create choppiness, especially if tech underperforms.
Catalysts: Watch for key economic data (inflation, employment, Fed commentary) and any major earnings surprises. These could trigger renewed momentum or a sharper correction.
Risk/Reward: The risk of a sharp correction is rising, but the underlying trend remains bullish unless there’s a significant negative surprise. A shallow pullback or sideways action would be healthy and could set up the next leg higher if fundamentals remain intact.
In summary: The S&P 500’s relentless bullishness is being tested by mixed sentiment and cautious analyst forecasts. Fundamentals are still supportive, but risks are rising. For the next week, expect consolidation or mild volatility, with the potential for renewed upside if economic data and earnings remain strong. Stay nimble, watch for sector rotation, and be prepared for both short-term pullbacks and longer-term opportunities.
Not financial advice.

US500 Reversal Zone? My Thought Process Explained 🎯 📉 Earlier today I posted an analysis on the US500, highlighting how price has traded into a weekly bearish order block 🧱 — a key distribution zone where I believe smart money could look to unwind positions. The market is currently overextended and sitting at a premium, which raises the risk of a potential aggressive retrace 🔄, especially heading into the weekend. ⚠️
💭 Here's a video where I break down that exact setup and walk you through my full thought process, including why I’m exercising extreme caution at these levels and what I’m looking for in terms of confirmation.
📚 As always, this is for educational purposes only — not financial advice. 🚫💼

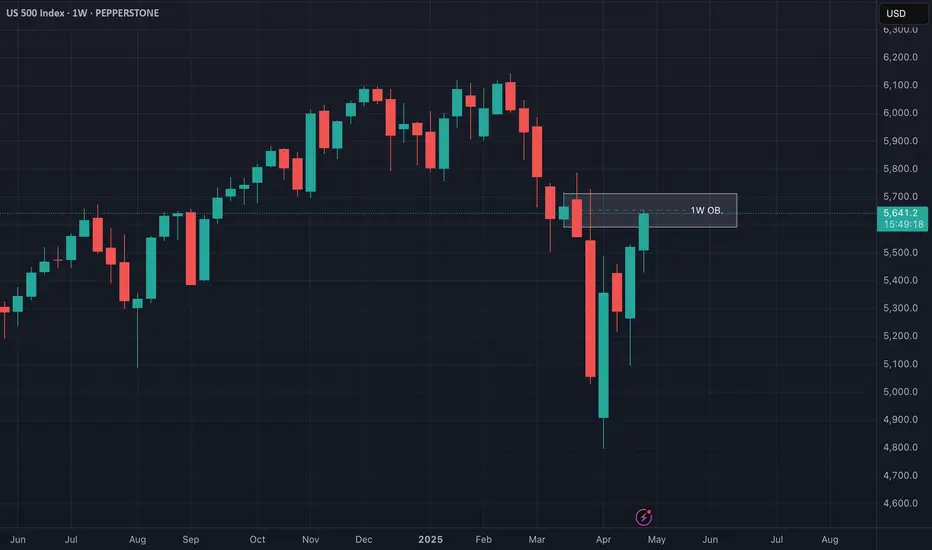
US500 at Critical Resistance - Weekly Chart Breakdown📊 US500 Weekly Chart Analysis
Taking a close look at the US500 on the weekly timeframe, we can see price has now traded directly into a bearish weekly order block 🧱 — a key distribution zone where smart money activity often emerges. At this level, the market is trading at a premium 💰 and appears to be overextended 📈.
⚠️ From a risk management standpoint, I’d advise extreme caution — the current conditions could set the stage for a sharp retracement, especially as we approach week’s end. This level aligns with areas where institutional players may look to offload risk or reverse exposure.
🔁 A potential pullback from here would not be surprising, given the elevated context and technical structure.
📚 This breakdown is for educational purposes only and should not be considered financial advice.