USDCAD: AB=CD pattern forming, price is expected to drop heavy!The USDCAD pair has two key areas where the price could reject. These areas hold potential and could serve as order blocs. The first entry is expected to be more accurate and likely to occur. However, if it doesn’t respect our level and breaks through the region, the price is likely to head towards the second zone of reversal. Focus on both areas rather than just the first, as we need to consider all market possibilities. Good luck and trade safely.
Like and comment for more. Thanks.
Team Setupsfx_
Usdcaddaily

TheGrove | AUDUSD Sell | Idea Trading AnalysisYou can expect a reaction in the direction of selling from the specified Resistance line
USDCAD moving higher as it tests the strong resistance level..
We expect a bearish move from the confluence zone.
Hello Traders, here is the full analysis.
I think we can soon see more fall from this range! GOOD LUCK! Great SELL opportunity USDCAD
I still did my best and this is the most likely count for me at the moment.
-------------------
Traders, if you liked this idea or if you have your own opinion about it, write in the comments. I will be glad 🤝

#USDCAD: +500 Pips Swing Sell Opportunity; One Not To Miss! Dear Traders,
The USDCAD pair is currently in a strong bearish trend and we anticipate a price correction. We expect the price to turn bullish in the short term, filling the liquidity gap it’s left behind. Once filled, the price could reverse and continue selling until it reaches around 1.3200, a 500+ pip move. Currently, there’s only one target, and the stop-loss can be adjusted based on your risk management.
The USD is plummeting, but there’s a chance it could show some bullish momentum. However, the CAD is experiencing a strong, continuous bullish trend, so we expect a correction.
If you enjoy our work, please like and comment. Also, follow us for updates whenever we post ideas.
Team Setupsfx_

USD/CAD Price Outlook – Trade Setup📊 Technical Structure
OANDA:USDCAD USD/CAD is holding firmly above a well-defined support zone around 1.3855–1.3865, following a strong impulsive advance earlier in the week. Recent price action shows consolidation above support rather than aggressive selling, indicating that downside momentum remains limited.
From a structural perspective, the pair is forming a bullish continuation pattern, with higher lows maintained above the support zone. As long as this area holds, price action favours a renewed upside push toward the 1.3900–1.3915 resistance zone, rather than a deeper corrective pullback.
🎯 Trade Setup (Bullish Bias)
Entry Zone: 1.3855 – 1.3865
Stop Loss: 1.3853
Take Profit 1: 1.3900
Take Profit 2: 1.3915
Risk–Reward Ratio: Approx. 1 : 3.24
📌 Invalidation:
A sustained break and close below 1.3857 would invalidate the bullish setup and signal a deeper correction.
🌐 Macro Background
On the macro side, the U.S. Dollar continues to receive underlying support from resilient U.S. economic data, reinforcing expectations that the Federal Reserve is in no rush to cut interest rates. This backdrop helps maintain a firm USD base in the near term.
Although the Canadian Dollar is supported by relatively stable oil prices, the impact appears contained for now. With no clear bearish catalyst against the USD, USD/CAD remains biased toward consolidation followed by upside continuation, particularly while price holds above key technical support.
🔑 Key Technical Levels
Resistance Zone: 1.3900 – 1.3915
Support Zone: 1.3855 – 1.3865
Bullish Invalidation: Below 1.3853
📌 Trade Summary
USD/CAD is consolidating above a critical support zone after a strong bullish leg. As long as price remains supported above 1.3855, the bias favours a buy-on-dips approach, targeting a retest of the upper resistance band.
⚠️ Disclaimer
This analysis is for reference only and does not constitute trading advice. Financial markets involve significant risk; proper risk and position management are essential.

USDCAD Trade Setup: Possible Buy the Dip OpportunityWe are looking at a possible Buy setup on USDCAD! 🇨🇦🇺🇸 The Canadian Dollar is showing significant weakness due to the recent strikes in Venezuela, which have unexpectedly created a supply glut in the energy sector. As Oil prices 🛢️ drop, the CAD takes a hit, while the Greenback (USD) has been gathering strength over the last week.
🚀 The Strategy: Buy Strength, Sell Weakness We are sticking to the golden rule of trend trading. Here is the technical breakdown of what I am watching for:
I am waiting for price to pull back and run sell-side liquidity. 💧
Watch the Weekly Open. I want to see price dip below it to trap shorts, then reclaim that level. A retest of the Weekly Open is our prime Point of Interest (POI). 🎯 Before entry, we need to see a clear Break of Structure (BOS) to the upside. 📈
⚡ Entry Scenarios
Conservative: Wait for the reclaim and retest of the Weekly Open.
Aggressive: Enter on the BOS during the current pullback phase.
🛡️ Place your Stop Loss just below the swing low once the rotation is confirmed. Let the market prove you right!
⚠️ Disclaimer: This analysis is for educational purposes only and does not constitute financial advice. Always do your own due diligence.

USDCAD📉 OANDA:USDCAD Technical Analysis (4H Timeframe)
The overall trend for USD/CAD has shifted to bearish, as the price is trading below the downward-sloping EMA 200 (black line) and has established a series of lower highs and lower lows 📉. The momentum was notably strong during the descent, characterized by large bearish candle bodies. Currently, the price is in a corrective phase (wave 5 of the recent leg), attempting a pullback toward the EMA 50 (red line). The EMA 50 is currently acting as immediate dynamic resistance. If the price fails to break above the 1.38270 USD level with conviction, we expect a continuation of the primary bearish trend toward the lower liquidity zones 🐻.
🔑 Key Levels to Watch:
Major Resistance Zone: 1.41400 USD (Primary Origin Grey Box) 🚩
Secondary Resistance: 1.39900 USD & 1.39000 USD (Grey Boxes) 🎯
Immediate Pivot Resistance: 1.38270 USD (Current Test Area) 💡
First Downside Target: 1.37320 USD (Recent Support / Grey Box) ⚡
Secondary Support Level: 1.36550 USD (Solid Black Line) 🛡️
Ultimate Demand Target: 1.35850 USD (Dashed Line) 📥

USDCADUSDCAD
- Completed " 1234 " Impulsive Waves
- Demand Zone
- Fibonacci Level - 38.20% / 50.00%
- Change of Characteristics
- Order Block

USD/CAD Price Outlook – Trade Setup📊 Technical Structure
OANDA:USDCAD USD/CAD has staged a steady recovery from the 1.3680–1.3700 base, forming a sequence of higher lows and pushing back above the 1.3750 support zone, which now acts as a short-term demand area. Price is currently trading near 1.3770, approaching the lower boundary of a broader 1.3807–1.3822 resistance zone.
On the 1-hour chart, momentum remains constructive, but price is entering a known supply region. The structure suggests a potential bullish continuation after a shallow pullback, rather than immediate breakout. As long as price holds above 1.3740, buyers retain short-term control.
🎯 Trade Setup (Bullish Bias)
Entry Zone: 1.3740 – 1.3724
Stop Loss: 1.3719
Take Profit 1: 1.3807
Take Profit 2: 1.3822
Estimated Risk-to-Reward: approx. 1 : 3.42
The bullish setup remains valid as long as price holds above 1.3739 on an hourly closing basis.
🌐 Macro Background (Simplified)
USD/CAD is supported by a firm US Dollar ahead of the ISM Manufacturing PMI, with markets cautious about underestimating US economic resilience. Any upside surprise in ISM data could reinforce expectations that the Federal Reserve may slow the pace of rate cuts, lending near-term support to the USD.
At the same time, rising crude oil prices linked to US–Venezuela tensions may provide intermittent support to the Canadian Dollar, limiting upside momentum and keeping the pair in a grinding, step-by-step advance rather than a breakout rally.
In short, macro drivers are mixed, but near-term price action favours buying pullbacks rather than chasing strength.
🔑 Key Technical Levels
Resistance Zone: 1.3807 – 1.3822
Support Zone: 1.3739 – 1.3719
Bullish Invalidation: Hourly close below 1.3739
📌 Trade Summary
USD/CAD is rebuilding bullish structure after defending the 1.3750 area. While immediate upside may be capped near resistance, the broader setup favours dip-buying toward 1.3739–1.3724, with scope for a move toward 1.3807 and 1.3822 if US data supports the Dollar. The bullish view is invalidated only if price breaks and holds below 1.3739.
⚠️ Disclaimer
This analysis is for reference only and does not constitute trading advice. Financial markets involve significant risk; proper risk and position management are essential.

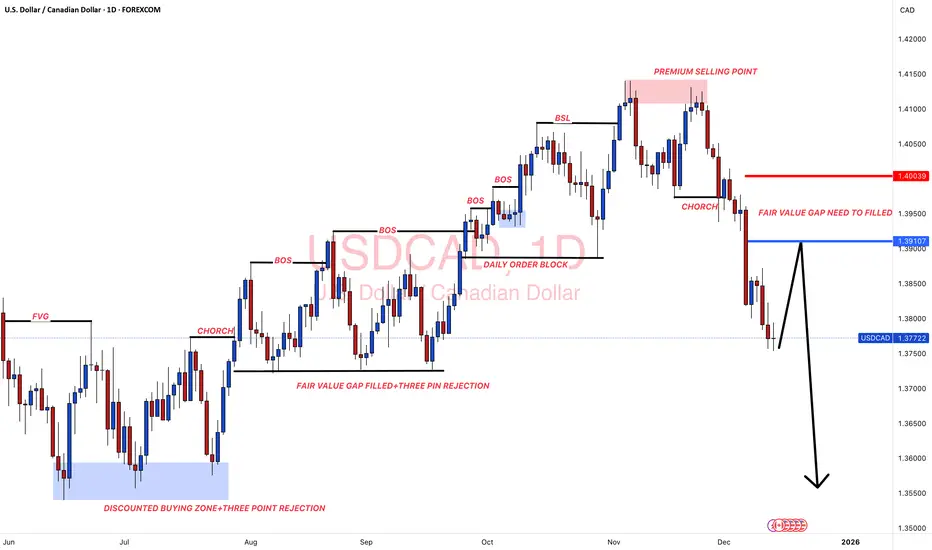
#USDCAD: A Perfect Selling Zone For The Week 15/12/2025Dear Traders,
Overview On USDCAD📈
🔺Price has left a great area of selling zone which need to be filled; we already have given an entry point and an exit point for you to identify the selling zone easily. USD is likely to show some minor bullish behaviour which will push the price of USDCAD to our point of interest.
🔺There is only one swing selling target that we currently have, this is not a long term trade instead or intraday trade.
Entry and Stop Loss Planning📊
🔺You must use your own knowledge to establish trading plan successfully, entry at the area as described in the chart only if it matches your bias.
🔺Use 'Red Line' as a exit point or as a stop loss also trade with accurate lot size based on your account.
🔺Take Profit Set at the 'Black Arrow' Ends.
Support and Encouragement ❤️🏆
If you like our idea then please like and comment which will encourage us to post such more ideas. Also share your views in the comment sections.
Tean Setupsfx_
USDCAD: +400 Pips Selling Opportunity!Overview🧠
The USDCAD currency pair has reversed and a potential change in trend is occurring. Confirmation is required before a sell entry can be made. The only take profit is a swing move with a potential gain of approximately 400 pips. The stop loss can be placed above the higher high. Please like and comment for more.
Team Setupsfx

USD/CAD Price Outlook – Trade Setup📊 Technical Structure
USD/CAD found solid support around the 1.3724–1.3740 zone after a sharp decline earlier in the month and has since rebounded steadily. Price is now consolidating below the 1.3807–1.3822 resistance area, which also marks a key supply zone from the previous breakdown.
On the 4-hour chart, the pair remains above a trendline, suggesting that the broader structure is still corrective-to-bullish rather than a trend reversal. As long as price holds above the 1.3724 support, the technical bias favours a buy-on-dip scenario, with upside potential toward the upper resistance band.
A decisive breakdown below the support zone would invalidate the bullish structure and shift the bias back to neutral or bearish.
🎯 Trade Setup (Bullish Bias)
Entry Zone: 1.3740 – 1.3724
Stop Loss: 1.3717
Take Profit 1: 1.3807
Take Profit 2: 1.3822
Estimated Risk-to-Reward: approx. 1 : 2.86
This bullish setup remains valid as long as price holds above 1.3724 on a 4-hour closing basis.
🌐 Macro Background (Simplified)
The Canadian Dollar has come under pressure following weaker-than-expected Canadian Retail Sales, highlighting soft household demand. This has reinforced expectations that the Bank of Canada (BoC) may need to deliver additional rate cuts, which weighs on CAD sentiment.
Meanwhile, the US Dollar remains relatively stable ahead of key US data releases, including preliminary Q3 GDP. Although USD momentum is not aggressive, relative CAD weakness continues to provide underlying support for USD/CAD.
In short, soft Canadian data + rate-cut expectations create a supportive macro backdrop for USD/CAD on dips.
🔑 Key Technical Levels
Resistance Zone: 1.3807 – 1.3822
Support Zone: 1.3740 – 1.3724
Bullish Invalidation: 4-hour close below 1.3724
📌 Trade Summary
USD/CAD is holding above trend support after a corrective pullback, maintaining a constructive bullish structure. As long as 1.3724 remains intact, a continuation move toward 1.3807–1.3822 is favoured. A clear break below support would invalidate this bullish view and require a reassessment of market direction.
⚠️ Disclaimer
This analysis is for educational purposes only and does not constitute investment advice. Trading involves risk; please manage position size and risk appropriately.

USD/CAD Price Outlook – Trade Setup📊 Technical Structure
USD/CAD remains in a short-term consolidation phase but continues to hold above the key support zone around 1.3789–1.3779, indicating that downside pressure is limited. Price action over the past sessions shows repeated defences of this support area, followed by higher lows, suggesting buyers are gradually regaining control.
On the 1-hour chart, the pair is attempting to build a base above the support zone while pressing toward the 1.3820 resistance area. As long as price holds above 1.3779, the technical structure favours a continuation move higher toward the 1.3820–1.3830 resistance zone. A clear breakdown below support would invalidate the bullish continuation scenario.
🎯 Trade Setup (Bullish Bias)
Entry Zone: 1.3789 – 1.3779
Stop Loss: 1.3773
Take Profit 1: 1.3820
Take Profit 2: 1.3830
Estimated Risk-to-Reward: approx. 1 : 2.47
The bullish setup remains valid as long as price holds above 1.3779 on an hourly closing basis.
🌐 Macro Background (Simplified)
The US Dollar has found short-term support after rebounding from softer US CPI data, as markets reassess the pace and timing of future Federal Reserve rate cuts. While inflation has cooled, expectations for aggressive easing remain measured, allowing the USD to stabilize in the near term.
Meanwhile, the Canadian Dollar remains cautious ahead of key domestic data, particularly Canadian Retail Sales, which could influence near-term CAD volatility. With oil prices offering limited directional support and macro uncertainty persisting, USD/CAD remains sensitive to relative data surprises.
In short: macro conditions are neutral-to-supportive for USD in the short term, allowing technical factors to take the lead.
🔑 Key Technical Levels
Resistance Zone: 1.3820 – 1.3830
Support Zone: 1.3789 – 1.3779
Bullish Invalidation: Hourly close below 1.3779
📌 Trade Summary
USD/CAD is consolidating above a well-defined support zone, with price structure suggesting accumulation rather than distribution. As long as 1.3779 support holds, a push higher toward 1.3820–1.3830 is favoured. The bullish view remains intact unless price breaks decisively below support, which would shift the bias back to range-bound or bearish conditions.
⚠️ Disclaimer
This analysis is for educational purposes only and does not constitute investment advice. Trading involves risk; please manage position size and risk appropriately.

USDCAD BUY | Day Trading AnalysisHello Traders, here is the full analysis.
Price reversal going up, levels for BUY .. GOOD LUCK! Great BUY opportunity USDCAD
I still did my best and this is the most likely count for me at the moment.
Support the idea with like and follow my profile TO SEE MORE.
Traders, if you liked this idea or if you have your own opinion about it, write in the comments. I will be glad 🤝
Patience is the If You Have Any Question, Feel Free To Ask 🤗
Just follow chart with idea and analysis and when you are ready come in THE GROVE | VIP GROUP, earn more and safe, wait for the signal at the right moment and make money with us💰

USDCADUSDCAD
- Bullish Channel as an corrective pattern in Long Time Frame
- Completed " 123 " Impulsive Waves
- Fibonacci Level - 61.80%
- S / R Level
- RSI - Divergence

USDCAD BUY | Idea Trading AnalysisUSDCAD is falling towards a support level which is a pullback support and could bounce from this level to our take profit.
We expect a decline in the channel after testing the current level which suggests that the price will continue to rise
Hello Traders, here is the full analysis.
I think we can soon see more fall from this range! GOOD LUCK! Great BUY opportunity USDCAD
I still did my best and this is the most likely count for me at the moment.
-------------------
Traders, if you liked this idea or if you have your own opinion about it, write in the comments. I will be glad 🤝

USD/CAD Price Outlook – Trade Setup📊 Technical Structure
OANDA:USDCAD USD/CAD is trading flat around 1.3950, holding below the 1.3966–1.3975 Resistance Zone, where repeated rejections keep the short-term bias tilted to the downside. The pair continues to oscillate within a compressed structure, failing to sustain any break above resistance, while the 1.3928–1.3937 Support Zone remains untested below.
As long as price stays under the resistance band, the structure favours another push lower toward support. A clean hourly close above 1.3975 would invalidate the bearish setup and shift momentum back upward.
🎯 Trade Setup
Entry: 1.3966 – 1.3975
Stop Loss: 1.3980
Take Profit 1: 1.3937
Take Profit 2: 1.3928
Risk–Reward Ratio: Approximately 1 : 2.5
Bearish structure remains valid below 1.3975. A breakout above this level invalidates the setup.
🌐 Macro Background
USD/CAD trades in a tight range ahead of Canada’s November employment report. Markets expect the Unemployment Rate to rise to 7%, signalling slower labour-market conditions and increasing the likelihood that the Bank of Canada (BoC) could extend its easing cycle at next week’s policy meeting. Soft Canadian data would generally weaken the CAD.
Meanwhile, the US Dollar remains subdued as traders firmly price in a 25 bps Fed rate cut at the December 9–10 meeting. According to the CME FedWatch Tool, the probability of a cut stands near 87%. Weakening labour-market indicators in the US and expectations that tariff-driven inflation is non-persistent add to the dovish pressure on the USD.
Overall, both currencies face macro headwinds, but the technical picture for USD/CAD favours a downside continuation toward support unless Canada’s jobs report surprises significantly.
🔑 Key Technical Levels
Resistance Zone: 1.3966 – 1.3975
Support Zone: 1.3928 – 1.3937
Structure Break (Invalidation): 1.3980
Targets: 1.3937 / 1.3928
📌 Trade Summary
USD/CAD remains capped beneath the resistance zone, preserving a short-term bearish structure. The preferred approach is to sell into 1.3966–1.3975, targeting a move back toward 1.3928–1.3937 support. A sustained move above 1.3980 cancels the setup.
⚠️ Disclaimer
This analysis is for reference only and does not constitute trading advice. Trading involves significant risk, and proper risk management is essential.

USDCADUSDCAD
- Double Top in Short Time Frame
- Completed " 12345 " Impulsive Waves
- Break of Structure
- RSI - Divergence
- Bullish Channel as an corrective pattern in Long Time Frame

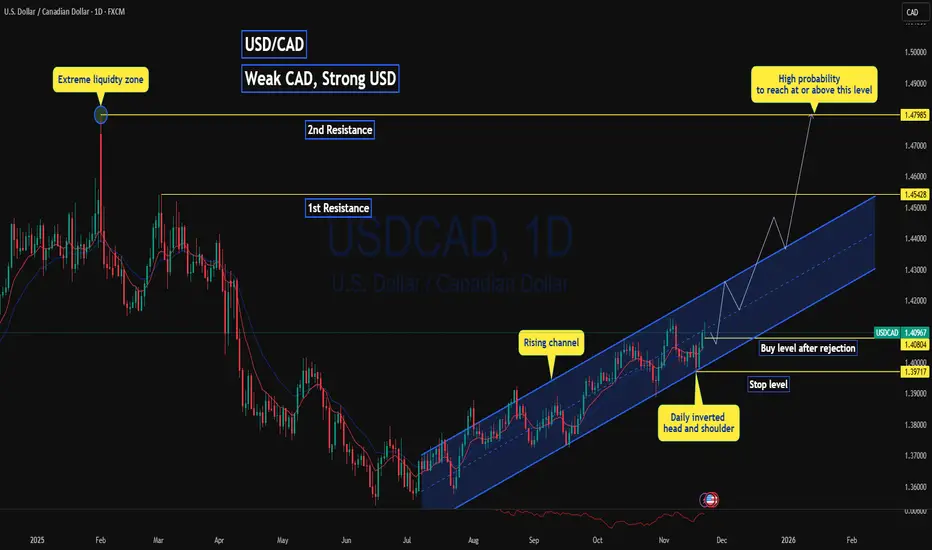
USDCAD is set to go 700 pip up!💹 Trade Setup USD/CAD
USD/CAD has formed a bullish channel with recent formation of inverted head and shoulder on the support level of the rising channel.
Weekly price action is has shown strong rejection from the support level with multiple liquidity grab.
with weaker CPI 2.9% where the forecast is 3.1% on CAD as well as continued bearish trend in Crude Oil ( as CAD is highly influence to WTI price ) putting CAD under pressure, While strong NFP data Non-Farm Employment Change 119k while forecast 53k boosting DXY making USD /CAD one of the strongest USD currency pairs to trade on
📈Trading Idea :
Look for bullish setup after false breakout of daily support at 1.4080 and rejection above
✈️Targets
1st Resistance 1.4543
2nd Resistance: 1.4799
🔴Stop level
at or below 1.3971 as this is the lower shadow of the inverted head and shoulder.
Follow for more ideas and update on this pair and other pairs !
USD/CAD Price Outlook – Trade Setup (USD/CAD)📊 Technical Structure
OANDA:USDCAD USD/CAD remains supported above 1.4014–1.4019, a key intraday demand zone that has supported price multiple times over the past sessions. Price is attempting a rebound from this support area, pushing back toward the 1.4040–1.4045 intraday pivot.
A sustained move above 1.4050 may open room for a continuation toward the resistance zone at 1.4066–1.4072, which aligns with previous supply and structural highs on the 30M chart. Failure to hold 1.4010 would invalidate the bullish setup and expose downside risk toward 1.3980.
Overall, price action favours a buy-the-dip structure as long as the support zone remains intact.
🎯 Trade Setup
Idea: Buy from support zone for continuation toward resistance.
Entry: 1.4014 – 1.4019
Stop Loss: 1.4011
Take Profit 1: 1.4066
Take Profit 2: 1.4072
Risk–Reward Ratio: ≈ 1 : 6.46
Bias remains short-term bullish while the pair trades above 1.4010.
🌐 Macro Background
USD/CAD extends modest gains around 1.4030–1.4050 during Monday’s Asian session as the Canadian Dollar weakens alongside declining crude oil prices.
According to FXStreet, “USD/CAD holds gains near 1.4050 as lower crude Oil prices weigh on the Canadian Dollar.” 【FXStreet】
Oil Pressure on CAD:
WTI crude pulls back from last session’s 2% rise, trading near $59.30 after Russia’s Novorossiysk port resumed operations following a two-day shutdown caused by a Ukrainian drone strike.
Meanwhile, the IEA warns of a potential 4 million bpd oversupply in 2026, reinforcing bearish pressure on energy markets.
BoC Expectations:
Markets expect the Bank of Canada to hold rates steady through 2026, unless economic conditions deteriorate further. October CPI data later today could influence rate expectations.
Fed Commentary:
Hawkish remarks from Fed officials continue to support the US Dollar.
Kansas City Fed President Jeffery Schmid said monetary policy should “lean against demand growth,” calling current conditions “modestly restrictive.”
Rate Cut Odds:
CME FedWatch shows 46% probability of a 25bps Fed cut in December — a sharp decline from 67% last week, reducing near-term dovish expectations.
Overall, the macro backdrop remains slightly USD-supportive, maintaining upward pressure on USD/CAD as long as oil prices stay weak and Fed officials maintain a cautious stance.
🔑 Key Technical Levels
Resistance: 1.4066 – 1.4072
Support: 1.4014 – 1.4019
Psychological Level: 1.4050
📌 Trade Summary
USD/CAD sustains above the 1.4010 support region, keeping the short-term bias tilted to the upside. Weakening oil prices and cautious Fed rhetoric favour a rebound toward 1.4066–1.4072.
A break below 1.4011 would negate the bullish scenario and shift focus toward 1.3980.
⚠️ Disclaimer
This analysis is for reference only and does not constitute trading advice. Trading involves significant risk, and proper risk management is essential.

USD/CAD: Wave of Destruction or Dollar RevivalUSD/CAD: Wave of Destruction or Dollar Revival
📈 Possible Scenarios for the Week
Bearish Scenario (Main Scenario):
Price breaks below ~1.3777
Wave (5) is developing → possible decline to ~1.3570–1.3425
Corrective (Bullish) Scenario:
USD/CAD holds current support
A corrective wave upward is developing to ~1.3970–1.4150
Consolidation:
Range between ~1.3777 and ~1.3970
Prices are gaining strength before the next impulse
✅ Conclusion
USD/CAD could see significant movement in the coming week—the pair is at a crossroads: either the major bearish impulse will continue, or an upward correction will begin.
Key levels: 1.3777 (support) and 1.3970 (resistance)
When trading, it's worth watching for confirmation of the wave structure and price reaction at the designated levels.

USDCAD Eye a Deeper Pullback as Oil & Dollar Momentum CoolsUSDCAD, After a sharp rebound toward 1.4020, USD/CAD is showing signs of exhaustion as selling pressure re-emerges at the top of the recent range. With oil prices stabilizing near mid-60s and the Bank of Canada signaling patience amid weak but steady domestic data, the pair faces the risk of another leg lower toward 1.39 and possibly 1.38 if U.S. data underperforms.
Current Bias
Bearish – USDCAD is holding below key resistance at 1.4030, with price action suggesting a potential correction toward 1.3910 and 1.3810 in the short term.
Key Fundamental Drivers
Oil Recovery: Crude oil has rebounded from recent lows, supporting the Canadian dollar and easing upward pressure on USD/CAD.
Divergent Central Bank Tone: The Fed remains cautious on cuts, while the BoC maintains a “wait and assess” stance, reflecting a balanced policy gap that limits upside for USD/CAD.
Data Softness: Canada’s growth data remains sluggish, but labor market strength offsets deeper pessimism. Meanwhile, U.S. consumer and manufacturing resilience keeps USD demand steady.
Yield Differentials: Modest narrowing between U.S. and Canadian yields favors mild CAD appreciation if risk sentiment holds stable.
Macro Context
U.S. economy continues to show solid momentum, though some leading indicators are flattening. Fed officials, including Logan and Schmid, have signaled that rates are restrictive enough but still not ready for aggressive cuts.
In Canada, Q2 GDP showed contraction, but employment and wage data suggest the downturn is shallow. The BoC remains cautious, preferring stability over immediate easing. Oil’s moderate rebound and stable export demand provide underlying CAD support.
Globally, energy market stabilization and China’s steady PMI data are limiting risk-off flows, reducing USD’s haven premium.
Primary Risk to the Trend
A sudden decline in oil prices or a hawkish shift from the Fed could reignite USD strength and push USD/CAD back toward 1.41+. Conversely, an unexpected BoC hawkish tone or strong Canadian employment data could accelerate the downside.
Most Critical Upcoming News/Event
U.S. ISM Manufacturing and Services PMI
U.S. Non-Farm Payrolls and CPI data
Canada Employment Report and Ivey PMI
BoC’s Business Outlook Survey
Leader/Lagger Dynamics
USD/CAD typically acts as a lagger to broader USD trends but a leader among commodity-linked currencies (AUD/CAD, NZD/CAD). Oil and Treasury yield moves drive its direction, while DXY strength or weakness sets the overall bias.
Key Levels
Support Levels: 1.3910, 1.3810
Resistance Levels: 1.4030, 1.4080
Stop Loss (SL): 1.4070 (above structural resistance)
Take Profit (TP): 1.3810 (lower support confluence)
Summary: Bias and Watchpoints
USDCAD carries a bearish bias as short-term momentum fades below 1.4030. The combination of firmer oil prices, a steady BoC stance, and a cooling dollar backdrop sets the stage for a pullback toward 1.3910 and potentially 1.3810. Traders should watch for confirmation from upcoming U.S. ISM and jobs data, which could either reinforce the correction or restore USD dominance. A stop above 1.4070 helps protect against sudden yield-driven spikes, while 1.3810 remains the key target zone aligned with both technical structure and the evolving macro narrative.

USD/CAD) Bullish trend analysis Read The captionSMC Trading point update
Technical analysis of USD/CAD on the 4H t
Overall Concept
The analysis suggests a retracement entry before a continuation to the upside.
The market is currently bullish, respecting higher highs and higher lows.
The analyst expects a pullback into a discount zone (Fibonacci retracement) before a move toward the target point at 1.41464.
---
Technical Breakdown
1. Trend Context
Price is trading above both the 50 EMA (1.40120) and 200 EMA (1.39622) → confirming bullish momentum.
The strong impulsive bullish candles indicate institutional buying.
2. Key Levels
Current Price: 1.40843
Retracement Zone (Potential Buy Area): Between the 0.62–0.79 Fibonacci retracement levels (≈1.4060–1.4040).
Target Point: 1.41464
3. Fibonacci Tool
The retracement tool is drawn from the most recent swing low to swing high.
The blue shaded zone marks the discount entry zone, ideal for smart money re-entry after a short pullback.
4. Expected Move
Scenario: Price retraces to the 0.62–0.79 zone (liquidity sweep or mitigation of demand)
Then: A bullish continuation toward 1.4146 target level, which aligns with previous liquidity or imbalance area.
5. Volume & Confirmation
Volume is moderate (14.73K), supporting a healthy bullish push after correction.
Candlestick structure shows strong bullish impulses with minor pullbacks → confirming buyer control.
---
Trade Idea Summary
Bias: Bullish
Entry Zone: 1.4060 – 1.4040 (Fibonacci discount zone)
Stop Loss: Below 1.4020 (beneath previous structure)
Target: 1.4146
Risk-to-Reward (RR): Approximately 1:3 or better
Mr SMC Trading point
---
Confirmation to Watch
Bullish rejection candle or engulfing pattern within the blue zone
EMA 50 holding as dynamic support
Possible equal highs liquidity sweep near 1.4146 as the final take-profit zone
Please support boost 🚀 this analysis

#USDCAD: Price to continue remain bullish! Let's wait and watchDear traders,
I hope you all are doing well.
The USDCAD pair has been extremely bullish since the CAD currency began to decline. We now have an excellent opportunity to rise, with the potential for the price to reverse in good time. This analysis is based solely on the current market conditions and price behaviour, so it may differ from your own views. The target is a swing, and you can adjust it according to your own analysis. Please use this analysis for educational purposes only.
Good luck and trade safely!
Team Setupsfx_
