USDCAD— FRGNT DAILY CHART FORECAST. Q1 | W4 | D28 | Y26📅 Q1 | W4 | D28 | Y26
📊 USDCAD— FRGNT DAILY CHART FORECAST
🔍 Analysis Approach
I’m applying a developed version of Smart Money Concepts, with a structured focus on:
• Identifying Key Points of Interest (POIs) on Higher Time Frames (HTFs) 🕰️
• Using those POIs to define a clear and controlled trading range 📐
• Refining those zones on Lower Time Frames (LTFs) 🔎
• Waiting for a Break of Structure (BoS) as confirmation ✅
This process keeps me precise, disciplined, and aligned with market narrative, rather than reacting emotionally or chasing price.
💡 My Motto
“Capital management, discipline, and consistency in your trading edge.”
A positive risk-to-reward ratio, combined with a high-probability execution model, is the backbone of any sustainable trading plan 📈🔐
⚠️ On Losses
Losses are part of the mathematical reality of trading 🎲
They don’t define you — they are necessary, expected, and managed.
We acknowledge them, learn, and move forward 📊➡️
🙏 I appreciate you taking the time to review my Daily Forecast.
Further context and supporting material can be found in the Links section.
Stay sharp 🧠
Stay consistent 🎯
Protect your capital 🔐
— FRGNT 🚀📈
FX:USDCAD
Usdcadforecast

USDCAD — FRGNT DAILY CHART FORECAST. Q1 | W4 | D28 | Y26📅 Q1 | W4 | D28 | Y26
📊 USDCAD — FRGNT DAILY CHART FORECAST
🔍 Analysis Approach
I’m applying a developed version of Smart Money Concepts, with a structured focus on:
• Identifying Key Points of Interest (POIs) on Higher Time Frames (HTFs) 🕰️
• Using those POIs to define a clear and controlled trading range 📐
• Refining those zones on Lower Time Frames (LTFs) 🔎
• Waiting for a Break of Structure (BoS) as confirmation ✅
This process keeps me precise, disciplined, and aligned with market narrative, rather than reacting emotionally or chasing price.
💡 My Motto
“Capital management, discipline, and consistency in your trading edge.”
A positive risk-to-reward ratio, combined with a high-probability execution model, is the backbone of any sustainable trading plan 📈🔐
⚠️ On Losses
Losses are part of the mathematical reality of trading 🎲
They don’t define you — they are necessary, expected, and managed.
We acknowledge them, learn, and move forward 📊➡️
🙏 I appreciate you taking the time to review my Daily Forecast.
Further context and supporting material can be found in the Links section.
Stay sharp 🧠
Stay consistent 🎯
Protect your capital 🔐
— FRGNT 🚀📈
FX:USDCAD

USDCAD — FRGNT DAILY CHART POST TRADE ANALYSIS. SIMPLE TRADING!📅 Q1 | W4 | D26| Y26
📊 USDCAD — FRGNT DAILY CHART POST TRADE ANALYSIS
🔍 Analysis Approach
I’m applying a developed version of Smart Money Concepts, with a structured focus on:
• Identifying Key Points of Interest (POIs) on Higher Time Frames (HTFs) 🕰️
• Using those POIs to define a clear and controlled trading range 📐
• Refining those zones on Lower Time Frames (LTFs) 🔎
• Waiting for a Break of Structure (BoS) as confirmation ✅
This process keeps me precise, disciplined, and aligned with market narrative, rather than reacting emotionally or chasing price.
💡 My Motto
“Capital management, discipline, and consistency in your trading edge.”
A positive risk-to-reward ratio, combined with a high-probability execution model, is the backbone of any sustainable trading plan 📈🔐
⚠️ On Losses
Losses are part of the mathematical reality of trading 🎲
They don’t define you — they are necessary, expected, and managed.
We acknowledge them, learn, and move forward 📊➡️
🙏 I appreciate you taking the time to review my Daily Forecast.
Further context and supporting material can be found in the Links section.
Stay sharp 🧠
Stay consistent 🎯
Protect your capital 🔐
— FRGNT 🚀📈
FX:USDCAD

USDCAD — FRGNT DAILY CHART FORECAST. Q1 | W4 | D26| Y26📅 Q1 | W4 | D26| Y26
📊 USDCAD — FRGNT DAILY CHART FORECAST
🔍 Analysis Approach
I’m applying a developed version of Smart Money Concepts, with a structured focus on:
• Identifying Key Points of Interest (POIs) on Higher Time Frames (HTFs) 🕰️
• Using those POIs to define a clear and controlled trading range 📐
• Refining those zones on Lower Time Frames (LTFs) 🔎
• Waiting for a Break of Structure (BoS) as confirmation ✅
This process keeps me precise, disciplined, and aligned with market narrative, rather than reacting emotionally or chasing price.
💡 My Motto
“Capital management, discipline, and consistency in your trading edge.”
A positive risk-to-reward ratio, combined with a high-probability execution model, is the backbone of any sustainable trading plan 📈🔐
⚠️ On Losses
Losses are part of the mathematical reality of trading 🎲
They don’t define you — they are necessary, expected, and managed.
We acknowledge them, learn, and move forward 📊➡️
🙏 I appreciate you taking the time to review my Daily Forecast.
Further context and supporting material can be found in the Links section.
Stay sharp 🧠
Stay consistent 🎯
Protect your capital 🔐
— FRGNT 🚀📈
FX:USDCAD

#USDCAD: +500 Pips Swing Sell Opportunity; One Not To Miss! Dear Traders,
The USDCAD pair is currently in a strong bearish trend and we anticipate a price correction. We expect the price to turn bullish in the short term, filling the liquidity gap it’s left behind. Once filled, the price could reverse and continue selling until it reaches around 1.3200, a 500+ pip move. Currently, there’s only one target, and the stop-loss can be adjusted based on your risk management.
The USD is plummeting, but there’s a chance it could show some bullish momentum. However, the CAD is experiencing a strong, continuous bullish trend, so we expect a correction.
If you enjoy our work, please like and comment. Also, follow us for updates whenever we post ideas.
Team Setupsfx_

USDCAD — FRGNT FUN COUPON FRIDAY Q1 | D23 | W3 | Y26📅 Q1 | D23 | W3 | Y26
📊 USDCAD — FRGNT FUN COUPON FRIDAY DAILY CHART FORECAST
🔍 Analysis Approach
I’m applying a developed version of Smart Money Concepts, with a structured focus on:
• Identifying Key Points of Interest (POIs) on Higher Time Frames (HTFs) 🕰️
• Using those POIs to define a clear and controlled trading range 📐
• Refining those zones on Lower Time Frames (LTFs) 🔎
• Waiting for a Break of Structure (BoS) as confirmation ✅
This process keeps me precise, disciplined, and aligned with market narrative, rather than reacting emotionally or chasing price.
💡 My Motto
“Capital management, discipline, and consistency in your trading edge.”
A positive risk-to-reward ratio, combined with a high-probability execution model, is the backbone of any sustainable trading plan 📈🔐
⚠️ On Losses
Losses are part of the mathematical reality of trading 🎲
They don’t define you — they are necessary, expected, and managed.
We acknowledge them, learn, and move forward 📊➡️
🙏 I appreciate you taking the time to review my Daily Forecast.
Further context and supporting material can be found in the Links section.
Stay sharp 🧠
Stay consistent 🎯
Protect your capital 🔐
— FRGNT 🚀📈
FX:USDCAD

USD/CAD(20260121)Today's AnalysisMarket News:
The Polish central bank has approved a plan to purchase 150 tons of gold, increasing its gold reserves to 700 tons.
Technical Analysis:
Today's Buy/Sell Threshold:
1.3842
Support and Resistance Levels:
1.3906
1.3882
1.3866
1.3817
1.3802
1.3778
Trading Strategy:
Consider buying if the price breaks above 1.3842, with a first target price of 1.3866.
Consider selling if the price breaks below 1.3817, with a first target price of 1.3802.

USD/CAD(20260119)Today's AnalysisMarket News:
President Trump vowed last Saturday to impose a series of escalating tariffs on EU member states Denmark, Sweden, France, Germany, the Netherlands, and Finland, as well as the UK and Norway, until the US is authorized to purchase Greenland. On March 17th, Trump announced on social media that a 10% tariff would be imposed on goods imported from Denmark, Norway, Sweden, France, Germany, the UK, the Netherlands, and Finland starting February 1st, and declared that the tariff rate would increase to 25% from June 1st, until the parties reach an agreement on the US's "full and complete purchase of Greenland."
Technical Analysis:
Today's Buy/Sell Threshold:
1.3909
Support and Resistance Levels:
1.3953
1.3936
1.3926
1.3892
1.3881
1.3865
Trading Strategy:
If the price breaks above 1.3926, consider buying with a first target price of 1.3953.
If the price breaks below 1.3909, consider selling with a first target price of 1.3892.

USD/CAD Closing in on Breakout! Will Bulls Take Control?🔥 USD/CAD "THE LOONIE": Bullish Breakout Play (Swing Trade Setup) | Layer Entry Strategy 🚀
TradingView Description:
🎯 TRADE IDEA: BULLISH SWING ON USD/CAD
🏆 Plan & Thesis:
The Loonie is approaching a critical juncture! 🧐 We are stalking a potential bullish breakout above the strong resistance zone at 1.41400. Our plan is to patiently wait for a confirmed breakout and momentum shift, signaling the next leg up. This is a swing trade opportunity targeting a key resistance area.
⚡ Why This Setup?
Key Resistance Break: A decisive break above 1.41400 indicates buyer strength overpowering sellers.
Trend Continuation: Aligns with the broader bullish structure on the higher timeframes.
Low-Risk, High-Reward Entry: Using the "Thief" layer strategy to optimize our average entry price.
📈 Trade Execution Details:
🎯 Entry Strategy (The "Thief" Layer Method): 🤑
We do not chase the price! We use a strategic layer of Buy Limit orders to enter on any retracement after the breakout is confirmed.
Layer 1: 1.41200
Layer 2: 1.41000
Layer 3: 1.40800
Layer 4: 1.40600
👉 You can adjust the number of layers and levels based on your capital and risk appetite.
🛑 Stop Loss (RISK MANAGEMENT):
A consolidated stop loss is placed below all entry layers at 1.40400.
⚠️ Disclaimer: This is MY stop loss. Please adjust your position size and SL based on YOUR personal risk management strategy. Protect your capital!
🎯 Take Profit Target:
Our primary profit target is set at 1.42100, a zone of strong historical resistance where we anticipate a pullback or overbought conditions.
💡 Pro Tip: Consider taking partial profits on the way up and moving your stop loss to breakeven to secure risk-free trades!
🌐 Market Context & Correlated Pairs to Watch:
Understanding correlations is key to validating this thesis! Keep an eye on these:
OANDA:USDCAD & PEPPERSTONE:USDX (DXY): 👑 DIRECT CORRELATION. A stronger US Dollar Index typically boosts USD/CAD. Watch for DXY strength to confirm our bullish bias.
OANDA:USDCAD & GETTEX:WTIC (Crude Oil): 👑 INVERSE CORRELATION. Canada is a major oil exporter. If Oil prices fall, CAD often weakens, pushing USD/CAD higher (bullish for our trade).
FX:EURUSD & FX:GBPUSD : These major pairs often move inversely to the USD. If they are falling, it can signal broad USD strength, supporting our USD/CAD long.
✅ Key Takeaways:
✅ Wait for a confirmed breakout and close above 1.41400.
✅ Execute entries using the layer method for best average price.
✅ MANAGE YOUR RISK! This is not financial advice. Your risk, your rules.
✅ Watch correlated pairs ( TVC:DXY , TVC:XAU , GETTEX:WTIC ) for confluence.
👑 Let's get this bread, traders! If you found this idea helpful, please give it a LIKE 👍, SHARE it with a fellow trader, and FOLLOW me for more high-quality setups! Your support helps the community grow! 💬 Drop a comment below with your thoughts!

USD/CAD(20260115)Today's AnalysisMarket News:
Daniel Casali, investment strategy partner at UK wealth management firm Evelyn Partners, said on Tuesday that his team is optimistic about both gold and silver. He pointed out that the uncertainty caused by events such as the outbreak of the Russia-Ukraine conflict in 2022 and US President Trump's announcement of so-called "Liberation Day" tariffs last April continues to support gold prices. As major world powers continue to diversify their trade war tactics, Casali stated that an atmosphere of "resource nationalism" is forming, continuously driving the precious metals market higher. In the first week of 2026, the US forcibly took control of Venezuelan strongman Maduro, while the White House hinted at possible military action to control Greenland. These actions exacerbated political risks and further strengthened the uncertainty supporting rising precious metal prices. Casali stated, "The current geopolitical game is complex, but the core conclusion is that resource nationalism will drive up gold and silver prices."
Technical Analysis:
Today's Buy/Sell Threshold:
1.3880
Support and Resistance Levels:
1.3912
1.3900
1.3892
1.3868
1.3861
1.3849
Trading Strategy:
If the price breaks above 1.3880, consider buying, with a first target price of 1.3900.
If the price breaks below 1.3868, consider selling, with a first target price of 1.3849.

USD/CAD Price Outlook – Trade Setup📊 Technical Structure
OANDA:USDCAD USD/CAD is holding firmly above a well-defined support zone around 1.3855–1.3865, following a strong impulsive advance earlier in the week. Recent price action shows consolidation above support rather than aggressive selling, indicating that downside momentum remains limited.
From a structural perspective, the pair is forming a bullish continuation pattern, with higher lows maintained above the support zone. As long as this area holds, price action favours a renewed upside push toward the 1.3900–1.3915 resistance zone, rather than a deeper corrective pullback.
🎯 Trade Setup (Bullish Bias)
Entry Zone: 1.3855 – 1.3865
Stop Loss: 1.3853
Take Profit 1: 1.3900
Take Profit 2: 1.3915
Risk–Reward Ratio: Approx. 1 : 3.24
📌 Invalidation:
A sustained break and close below 1.3857 would invalidate the bullish setup and signal a deeper correction.
🌐 Macro Background
On the macro side, the U.S. Dollar continues to receive underlying support from resilient U.S. economic data, reinforcing expectations that the Federal Reserve is in no rush to cut interest rates. This backdrop helps maintain a firm USD base in the near term.
Although the Canadian Dollar is supported by relatively stable oil prices, the impact appears contained for now. With no clear bearish catalyst against the USD, USD/CAD remains biased toward consolidation followed by upside continuation, particularly while price holds above key technical support.
🔑 Key Technical Levels
Resistance Zone: 1.3900 – 1.3915
Support Zone: 1.3855 – 1.3865
Bullish Invalidation: Below 1.3853
📌 Trade Summary
USD/CAD is consolidating above a critical support zone after a strong bullish leg. As long as price remains supported above 1.3855, the bias favours a buy-on-dips approach, targeting a retest of the upper resistance band.
⚠️ Disclaimer
This analysis is for reference only and does not constitute trading advice. Financial markets involve significant risk; proper risk and position management are essential.

USDCAD Short Ideathis pair has formed an ascending channel on H1 timeframe
now we're waiting for a momentum candle to close below the last touch of the channel so we can enter a sell trade
Follow us for more idea or trades

USDCAD Long Setup — Retest Zone Could Fuel the Next Push HigherToday, I want to share a long trading opportunity on the USDCAD ( FX:USDCAD ) pair. Stay tuned!
USDCAD is currently breaking through the resistance zone(1.394 CAD-1.389 CAD) with good momentum, and this zone is now acting as support. It’s also near the Potential Reversal Zone (PRZ) and the support lines, which can provide a solid foundation for the continuation of the bullish trend.
From an Elliott Wave perspective, it seems that USDCAD has completed main wave 3, and we should now expect the corrective wave 4 before the pair resumes its upward movement.
Additionally, recent U.S. unemployment claims data, which was favorable for the DXY index( TVC:DXY ), supports the continuation of the USDCAD bullish trend.
I expect that as USDCAD enters the Potential Reversal Zone (PRZ) , it will begin to climb and target the resistance zone(1.394 CAD-1.389 CAD) once again.
First Target: 1.389 CAD
Second Target: 1.393 CAD
Stop Loss(SL): 1.378 CAD(Worst)
💡 Please respect each other's opinions and express agreement or disagreement politely.
📌U.S. Dollar/Canadian Dollar Analysis (USDCAD), 4-hour time frame.
🛑 Always set a Stop Loss(SL) for every position you open.
✅ This is just my idea; I’d love to see your thoughts too!
🔥 If you find it helpful, please BOOST this post and share it with your friends.

USDCAD Trade Setup: Possible Buy the Dip OpportunityWe are looking at a possible Buy setup on USDCAD! 🇨🇦🇺🇸 The Canadian Dollar is showing significant weakness due to the recent strikes in Venezuela, which have unexpectedly created a supply glut in the energy sector. As Oil prices 🛢️ drop, the CAD takes a hit, while the Greenback (USD) has been gathering strength over the last week.
🚀 The Strategy: Buy Strength, Sell Weakness We are sticking to the golden rule of trend trading. Here is the technical breakdown of what I am watching for:
I am waiting for price to pull back and run sell-side liquidity. 💧
Watch the Weekly Open. I want to see price dip below it to trap shorts, then reclaim that level. A retest of the Weekly Open is our prime Point of Interest (POI). 🎯 Before entry, we need to see a clear Break of Structure (BOS) to the upside. 📈
⚡ Entry Scenarios
Conservative: Wait for the reclaim and retest of the Weekly Open.
Aggressive: Enter on the BOS during the current pullback phase.
🛡️ Place your Stop Loss just below the swing low once the rotation is confirmed. Let the market prove you right!
⚠️ Disclaimer: This analysis is for educational purposes only and does not constitute financial advice. Always do your own due diligence.

USD/CAD - Bullish Pennant Loading (09.01.2026)📝 Description 🔍 Setup (Technical Structure) FX:USDCAD
USD/CAD is forming a classic Bullish Pennant pattern after a strong impulsive move up (flagpole). Price is consolidating with higher lows, respecting short-term EMA support and holding above the Ichimoku cloud — a sign of healthy bullish continuation.
Key confirmations:
Strong bullish flagpole
Tight consolidation (pennant structure)
Price holding above EMA & cloud
No major bearish rejection yet
📍 Support & Resistance
🔴 Key Support: Pennant base / EMA zone
🟢 1st Resistance: 1.3911
🟢 2nd Resistance / Target: 1.3935
🎯 Measured Move Target: Based on flagpole height projection
#USDCAD #ForexTrading #BullishPennant #PriceAction #TrendContinuation #SupportResistance #TradingView #Kabhi_TA_Trading
⚠️ Disclaimer
This analysis is for educational purposes only.
Forex trading involves risk — always use proper risk management and stop-loss.
💬 Support the Analysis👍 Like if you see the bullish continuation
💬 Comment: Breakout or Fakeout? 🔁 Share with traders watching USD/CAD

USDCAD — FRGNT FUN COUPON FRIDAY DAILY CHART FORECAST📅 Q1 | D9 | W1 | Y26
📊 USDCAD — FRGNT FUN COUPON FRIDAY DAILY CHART FORECAST
🔍 Analysis Approach
I’m applying a developed version of Smart Money Concepts, with a structured focus on:
• Identifying Key Points of Interest (POIs) on Higher Time Frames (HTFs) 🕰️
• Using those POIs to define a clear and controlled trading range 📐
• Refining those zones on Lower Time Frames (LTFs) 🔎
• Waiting for a Break of Structure (BoS) as confirmation ✅
This process keeps me precise, disciplined, and aligned with market narrative, rather than reacting emotionally or chasing price.
💡 My Motto
“Capital management, discipline, and consistency in your trading edge.”
A positive risk-to-reward ratio, combined with a high-probability execution model, is the backbone of any sustainable trading plan 📈🔐
⚠️ On Losses
Losses are part of the mathematical reality of trading 🎲
They don’t define you — they are necessary, expected, and managed.
We acknowledge them, learn, and move forward 📊➡️
🙏 I appreciate you taking the time to review my Daily Forecast.
Further context and supporting material can be found in the Links section.
Stay sharp 🧠
Stay consistent 🎯
Protect your capital 🔐
— FRGNT 🚀📈
FX:USDCAD

USD/CAD(20260108)Today's AnalysisMarket News:
U.S. Energy Secretary Chris Wright stated that the Trump administration plans to take over Venezuela's future oil sales and use the proceeds to rebuild the country's economy.
"If we control where the oil flows and the cash flow generated from those sales, we will have tremendous leverage," Wright said Wednesday at the Goldman Sachs Energy, Clean Technology, and Utilities conference in Miami. "We need that leverage and control over oil sales to drive the necessary changes in Venezuela." Wright anticipates that Venezuela's daily crude oil production could increase by hundreds of thousands of barrels in the short to medium term. The U.S. government plans to deposit the proceeds into government accounts to benefit the Venezuelan people.
Technical Analysis:
Today's Buy/Sell Threshold:
1.3837
Support and Resistance Levels:
1.3908
1.3881
1.3864
1.3809
1.3792
1.3765
Trading Strategy:
If the price breaks above 1.3864, consider buying with a first target price of 1.3881.
If the price breaks below 1.3837, consider selling with a first target price of 1.3809.

USDCAD📉 OANDA:USDCAD Technical Analysis (4H Timeframe)
The overall trend for USD/CAD has shifted to bearish, as the price is trading below the downward-sloping EMA 200 (black line) and has established a series of lower highs and lower lows 📉. The momentum was notably strong during the descent, characterized by large bearish candle bodies. Currently, the price is in a corrective phase (wave 5 of the recent leg), attempting a pullback toward the EMA 50 (red line). The EMA 50 is currently acting as immediate dynamic resistance. If the price fails to break above the 1.38270 USD level with conviction, we expect a continuation of the primary bearish trend toward the lower liquidity zones 🐻.
🔑 Key Levels to Watch:
Major Resistance Zone: 1.41400 USD (Primary Origin Grey Box) 🚩
Secondary Resistance: 1.39900 USD & 1.39000 USD (Grey Boxes) 🎯
Immediate Pivot Resistance: 1.38270 USD (Current Test Area) 💡
First Downside Target: 1.37320 USD (Recent Support / Grey Box) ⚡
Secondary Support Level: 1.36550 USD (Solid Black Line) 🛡️
Ultimate Demand Target: 1.35850 USD (Dashed Line) 📥

TheGrove | USDCAD buy | Idea Trading AnalysisUSDCAD is moving in an UP trend channel.
The chart broke through the dynamic Support line line
We expect a decline in the channel after testing the current level which suggests that the price will continue to rise
We expect a decline in the channel after testing the current level
Hello Traders, here is the full analysis.
I think we can soon see more fall from this range! GOOD LUCK! Great SELL opportunity USDCAD
I still did my best and this is the most likely count for me at the moment.
-------------------
Traders, if you liked this idea or if you have your own opinion about it, write in the comments. I will be glad ⚜️

USDCADUSDCAD
- Completed " 1234 " Impulsive Waves
- Demand Zone
- Fibonacci Level - 38.20% / 50.00%
- Change of Characteristics
- Order Block

USD/CAD Price Outlook – Trade Setup📊 Technical Structure
OANDA:USDCAD USD/CAD has staged a steady recovery from the 1.3680–1.3700 base, forming a sequence of higher lows and pushing back above the 1.3750 support zone, which now acts as a short-term demand area. Price is currently trading near 1.3770, approaching the lower boundary of a broader 1.3807–1.3822 resistance zone.
On the 1-hour chart, momentum remains constructive, but price is entering a known supply region. The structure suggests a potential bullish continuation after a shallow pullback, rather than immediate breakout. As long as price holds above 1.3740, buyers retain short-term control.
🎯 Trade Setup (Bullish Bias)
Entry Zone: 1.3740 – 1.3724
Stop Loss: 1.3719
Take Profit 1: 1.3807
Take Profit 2: 1.3822
Estimated Risk-to-Reward: approx. 1 : 3.42
The bullish setup remains valid as long as price holds above 1.3739 on an hourly closing basis.
🌐 Macro Background (Simplified)
USD/CAD is supported by a firm US Dollar ahead of the ISM Manufacturing PMI, with markets cautious about underestimating US economic resilience. Any upside surprise in ISM data could reinforce expectations that the Federal Reserve may slow the pace of rate cuts, lending near-term support to the USD.
At the same time, rising crude oil prices linked to US–Venezuela tensions may provide intermittent support to the Canadian Dollar, limiting upside momentum and keeping the pair in a grinding, step-by-step advance rather than a breakout rally.
In short, macro drivers are mixed, but near-term price action favours buying pullbacks rather than chasing strength.
🔑 Key Technical Levels
Resistance Zone: 1.3807 – 1.3822
Support Zone: 1.3739 – 1.3719
Bullish Invalidation: Hourly close below 1.3739
📌 Trade Summary
USD/CAD is rebuilding bullish structure after defending the 1.3750 area. While immediate upside may be capped near resistance, the broader setup favours dip-buying toward 1.3739–1.3724, with scope for a move toward 1.3807 and 1.3822 if US data supports the Dollar. The bullish view is invalidated only if price breaks and holds below 1.3739.
⚠️ Disclaimer
This analysis is for reference only and does not constitute trading advice. Financial markets involve significant risk; proper risk and position management are essential.

Q1 | W2 | Y26 USDCAD — FRGNT WEEK AHEAD FORECAST📅 Q1 | W2 | Y26
📊 USDCAD — FRGNT WEEK AHEAD FORECAST
🔍 Analysis Approach
I’m applying a developed version of Smart Money Concepts, with a structured focus on:
• Identifying Key Points of Interest (POIs) on Higher Time Frames (HTFs) 🕰️
• Using those POIs to define a clear and controlled trading range 📐
• Refining those zones on Lower Time Frames (LTFs) 🔎
• Waiting for a Break of Structure (BoS) as confirmation ✅
This process keeps me precise, disciplined, and aligned with market narrative, rather than reacting emotionally or chasing price.
💡 My Motto
“Capital management, discipline, and consistency in your trading edge.”
A positive risk-to-reward ratio, combined with a high-probability execution model, is the backbone of any sustainable trading plan 📈🔐
⚠️ On Losses
Losses are part of the mathematical reality of trading 🎲
They don’t define you — they are necessary, expected, and managed.
We acknowledge them, learn, and move forward 📊➡️
🙏 I appreciate you taking the time to review my Daily Forecast.
Further context and supporting material can be found in the Links section.
Stay sharp 🧠
Stay consistent 🎯
Protect your capital 🔐
— FRGNT MASTERY 🚀📈
FX:USDCAD

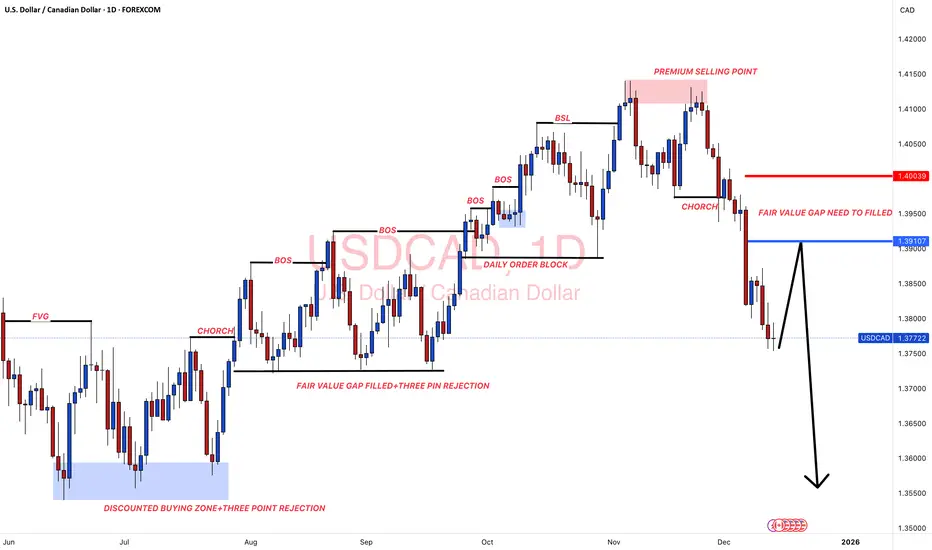
#USDCAD: A Perfect Selling Zone For The Week 15/12/2025Dear Traders,
Overview On USDCAD📈
🔺Price has left a great area of selling zone which need to be filled; we already have given an entry point and an exit point for you to identify the selling zone easily. USD is likely to show some minor bullish behaviour which will push the price of USDCAD to our point of interest.
🔺There is only one swing selling target that we currently have, this is not a long term trade instead or intraday trade.
Entry and Stop Loss Planning📊
🔺You must use your own knowledge to establish trading plan successfully, entry at the area as described in the chart only if it matches your bias.
🔺Use 'Red Line' as a exit point or as a stop loss also trade with accurate lot size based on your account.
🔺Take Profit Set at the 'Black Arrow' Ends.
Support and Encouragement ❤️🏆
If you like our idea then please like and comment which will encourage us to post such more ideas. Also share your views in the comment sections.
Tean Setupsfx_