USDCAD Bearish Breakout!
HI,Traders !
#USDCAD made a bearish
Breakout of the key
Horizontal level of 1.37376
And the breakout is confirmed
So we are bearish biased and
We will be expecting a
Further bearish continuation !
Comment and subscribe to help us grow !
Usdcadidea

USDCAD: +400 Pips Selling Opportunity!Overview🧠
The USDCAD currency pair has reversed and a potential change in trend is occurring. Confirmation is required before a sell entry can be made. The only take profit is a swing move with a potential gain of approximately 400 pips. The stop loss can be placed above the higher high. Please like and comment for more.
Team Setupsfx

USD/CAD Price Outlook – Trade Setup📊 Technical Structure
USD/CAD found solid support around the 1.3724–1.3740 zone after a sharp decline earlier in the month and has since rebounded steadily. Price is now consolidating below the 1.3807–1.3822 resistance area, which also marks a key supply zone from the previous breakdown.
On the 4-hour chart, the pair remains above a trendline, suggesting that the broader structure is still corrective-to-bullish rather than a trend reversal. As long as price holds above the 1.3724 support, the technical bias favours a buy-on-dip scenario, with upside potential toward the upper resistance band.
A decisive breakdown below the support zone would invalidate the bullish structure and shift the bias back to neutral or bearish.
🎯 Trade Setup (Bullish Bias)
Entry Zone: 1.3740 – 1.3724
Stop Loss: 1.3717
Take Profit 1: 1.3807
Take Profit 2: 1.3822
Estimated Risk-to-Reward: approx. 1 : 2.86
This bullish setup remains valid as long as price holds above 1.3724 on a 4-hour closing basis.
🌐 Macro Background (Simplified)
The Canadian Dollar has come under pressure following weaker-than-expected Canadian Retail Sales, highlighting soft household demand. This has reinforced expectations that the Bank of Canada (BoC) may need to deliver additional rate cuts, which weighs on CAD sentiment.
Meanwhile, the US Dollar remains relatively stable ahead of key US data releases, including preliminary Q3 GDP. Although USD momentum is not aggressive, relative CAD weakness continues to provide underlying support for USD/CAD.
In short, soft Canadian data + rate-cut expectations create a supportive macro backdrop for USD/CAD on dips.
🔑 Key Technical Levels
Resistance Zone: 1.3807 – 1.3822
Support Zone: 1.3740 – 1.3724
Bullish Invalidation: 4-hour close below 1.3724
📌 Trade Summary
USD/CAD is holding above trend support after a corrective pullback, maintaining a constructive bullish structure. As long as 1.3724 remains intact, a continuation move toward 1.3807–1.3822 is favoured. A clear break below support would invalidate this bullish view and require a reassessment of market direction.
⚠️ Disclaimer
This analysis is for educational purposes only and does not constitute investment advice. Trading involves risk; please manage position size and risk appropriately.

USD/CAD Price Outlook – Trade Setup📊 Technical Structure
USD/CAD remains in a short-term consolidation phase but continues to hold above the key support zone around 1.3789–1.3779, indicating that downside pressure is limited. Price action over the past sessions shows repeated defences of this support area, followed by higher lows, suggesting buyers are gradually regaining control.
On the 1-hour chart, the pair is attempting to build a base above the support zone while pressing toward the 1.3820 resistance area. As long as price holds above 1.3779, the technical structure favours a continuation move higher toward the 1.3820–1.3830 resistance zone. A clear breakdown below support would invalidate the bullish continuation scenario.
🎯 Trade Setup (Bullish Bias)
Entry Zone: 1.3789 – 1.3779
Stop Loss: 1.3773
Take Profit 1: 1.3820
Take Profit 2: 1.3830
Estimated Risk-to-Reward: approx. 1 : 2.47
The bullish setup remains valid as long as price holds above 1.3779 on an hourly closing basis.
🌐 Macro Background (Simplified)
The US Dollar has found short-term support after rebounding from softer US CPI data, as markets reassess the pace and timing of future Federal Reserve rate cuts. While inflation has cooled, expectations for aggressive easing remain measured, allowing the USD to stabilize in the near term.
Meanwhile, the Canadian Dollar remains cautious ahead of key domestic data, particularly Canadian Retail Sales, which could influence near-term CAD volatility. With oil prices offering limited directional support and macro uncertainty persisting, USD/CAD remains sensitive to relative data surprises.
In short: macro conditions are neutral-to-supportive for USD in the short term, allowing technical factors to take the lead.
🔑 Key Technical Levels
Resistance Zone: 1.3820 – 1.3830
Support Zone: 1.3789 – 1.3779
Bullish Invalidation: Hourly close below 1.3779
📌 Trade Summary
USD/CAD is consolidating above a well-defined support zone, with price structure suggesting accumulation rather than distribution. As long as 1.3779 support holds, a push higher toward 1.3820–1.3830 is favoured. The bullish view remains intact unless price breaks decisively below support, which would shift the bias back to range-bound or bearish conditions.
⚠️ Disclaimer
This analysis is for educational purposes only and does not constitute investment advice. Trading involves risk; please manage position size and risk appropriately.

Trade Idea on USDCAD on 1HR TFBullish setup on USDCAD on 1HR TF.
Entry: Buy stop at 1.37803
SL: 1.3735 (0.379% loss)
TP: 1.39378 (1.135% profit)
RR: 1:3
Bullish points:
- Falling wedge breakout
- Bullish divergence on 1hr

USDCAD Bearish Trend Continuation From Marked ResistancesH4 - Bearish Trend in play
Two Solid Resistance Levels
Trend continuation very likely after pullback.

USDCAD - Looking To Sell Pullbacks In The Short TermH4 - Strong bearish move.
No opposite signs.
Expecting bearish continuation until the two Fibonacci resistance zones hold.
If you enjoy this idea, don’t forget to LIKE 👍, FOLLOW ✅, SHARE 🙌, and COMMENT ✍! Drop your thoughts and charts below to keep the discussion going. Your support helps keep this content free and reach more people! 🚀
--------------------------------------------------------------------------------------------------------

Smart Money Levels on USD/CAD – What’s Next for the Loonie?“USD/CAD – The LOONIE Profit Playbook (Swing/Day Trade) 🚀💰”
📋 Description:
Dear Ladies & Gentleman (Thief OG’s),
Here’s the plan for our favourite cross, USD/CAD – “The Loonie”:
Plan: Bullish bias (with a setup for a potential bearish flip if you like to dance with the other side)
Entry (Bullish):
Pullback-1: 1.39400
Pullback-2: 1.39000
Enter at a dip into one of those levels, let the market breathe, then ride the wave.
Stop Loss:
This is Thief SL at 1.38800 — place your stop after the pullback level you used.
Target (Bullish):
Our target zone: 1.41000 — watch for strong resistance, overbought signals & a possible trap. Escape with profit when you see the signs.
Entry (Bearish):
If you prefer the short side: you may enter anywhere, but keep sharp eyes on pullback zones and the target levels below.
Bearish Targets: 1.39400 & 1.39000
🔍 More to watch – Related Pairs & Correlations:
OANDA:USDCHF (often moves inversely with USD/CAD)
OANDA:AUDUSD (commodity-linked crosses, relevant when commodities shift)
OANDA:CADJPY (Canadian dollar strength/weakness can show up across CAD pairs)
Watch how CAD strength or USD strength flows across pairs. When CAD weakens, USD/CAD rises — when CAD strengthens, USD/CAD dips.
⚠️ Note:
Dear Ladies & Gentleman (Thief OG’s), I am not recommending you set only my stop-loss or take-profit rules. It’s your own choice — make money, then take money — at your own risk.
✨ Footer:
“If you find value in my analysis, a 👍 and 🚀 boost is much appreciated — it helps me share more setups with the community!”
📌 Disclaimer:
This is Thief style trading strategy just for fun.
#USDCAD #Forex #SwingTrade #DayTrade #Loonie #ForexSetup #ThiefTrader #TradingViewIdeas #ForexAnalysis #CurrencyPairs

USD/CAD False breakout of 1.3780 sell entry?USD/CAD is following a predictable pattern of false breakout of the swing high and since it starts this down wave.
There is false break 1, then drop
Falose break 2, then another drop
Current price is trending below swing low and there is a higher possility the market to bouce off the swing hihg which is a high probale entry on a falose breakout of the resistance line.

USDCAD Will Keep Falling!
HI,Traders !
#USDCAD is trading in a
Downtrend and the pair made
A retest of the horizontal
Resistance of 1.39769 from where
We are already seeing a bearish
Move down so we will be
Expecting a further
Bearish move down !
Comment and subscribe to help us grow !

USD/CAD Price Outlook – Trade Setup📊 Technical Structure
OANDA:USDCAD USD/CAD is trading flat around 1.3950, holding below the 1.3966–1.3975 Resistance Zone, where repeated rejections keep the short-term bias tilted to the downside. The pair continues to oscillate within a compressed structure, failing to sustain any break above resistance, while the 1.3928–1.3937 Support Zone remains untested below.
As long as price stays under the resistance band, the structure favours another push lower toward support. A clean hourly close above 1.3975 would invalidate the bearish setup and shift momentum back upward.
🎯 Trade Setup
Entry: 1.3966 – 1.3975
Stop Loss: 1.3980
Take Profit 1: 1.3937
Take Profit 2: 1.3928
Risk–Reward Ratio: Approximately 1 : 2.5
Bearish structure remains valid below 1.3975. A breakout above this level invalidates the setup.
🌐 Macro Background
USD/CAD trades in a tight range ahead of Canada’s November employment report. Markets expect the Unemployment Rate to rise to 7%, signalling slower labour-market conditions and increasing the likelihood that the Bank of Canada (BoC) could extend its easing cycle at next week’s policy meeting. Soft Canadian data would generally weaken the CAD.
Meanwhile, the US Dollar remains subdued as traders firmly price in a 25 bps Fed rate cut at the December 9–10 meeting. According to the CME FedWatch Tool, the probability of a cut stands near 87%. Weakening labour-market indicators in the US and expectations that tariff-driven inflation is non-persistent add to the dovish pressure on the USD.
Overall, both currencies face macro headwinds, but the technical picture for USD/CAD favours a downside continuation toward support unless Canada’s jobs report surprises significantly.
🔑 Key Technical Levels
Resistance Zone: 1.3966 – 1.3975
Support Zone: 1.3928 – 1.3937
Structure Break (Invalidation): 1.3980
Targets: 1.3937 / 1.3928
📌 Trade Summary
USD/CAD remains capped beneath the resistance zone, preserving a short-term bearish structure. The preferred approach is to sell into 1.3966–1.3975, targeting a move back toward 1.3928–1.3937 support. A sustained move above 1.3980 cancels the setup.
⚠️ Disclaimer
This analysis is for reference only and does not constitute trading advice. Trading involves significant risk, and proper risk management is essential.

USDCAD 1H A structured approach to market analysis combining Fibonacci retracement levels with key Support & Resistance zones.
Price action is monitored to identify reaction points, liquidity zones, and potential reversal or continuation setups.
The analysis focuses on high-probability confluence areas where Fibonacci ratios align with historical structure levels, helping traders spot optimal entry points, stop-loss zones, and profit-taking targets.

USD/CAD Closing in on Breakout! Will Bulls Take Control?🔥 USD/CAD "THE LOONIE": Bullish Breakout Play (Swing Trade Setup) | Layer Entry Strategy 🚀
TradingView Description:
🎯 TRADE IDEA: BULLISH SWING ON USD/CAD
🏆 Plan & Thesis:
The Loonie is approaching a critical juncture! 🧐 We are stalking a potential bullish breakout above the strong resistance zone at 1.41400. Our plan is to patiently wait for a confirmed breakout and momentum shift, signaling the next leg up. This is a swing trade opportunity targeting a key resistance area.
⚡ Why This Setup?
Key Resistance Break: A decisive break above 1.41400 indicates buyer strength overpowering sellers.
Trend Continuation: Aligns with the broader bullish structure on the higher timeframes.
Low-Risk, High-Reward Entry: Using the "Thief" layer strategy to optimize our average entry price.
📈 Trade Execution Details:
🎯 Entry Strategy (The "Thief" Layer Method): 🤑
We do not chase the price! We use a strategic layer of Buy Limit orders to enter on any retracement after the breakout is confirmed.
Layer 1: 1.41200
Layer 2: 1.41000
Layer 3: 1.40800
Layer 4: 1.40600
👉 You can adjust the number of layers and levels based on your capital and risk appetite.
🛑 Stop Loss (RISK MANAGEMENT):
A consolidated stop loss is placed below all entry layers at 1.40400.
⚠️ Disclaimer: This is MY stop loss. Please adjust your position size and SL based on YOUR personal risk management strategy. Protect your capital!
🎯 Take Profit Target:
Our primary profit target is set at 1.42100, a zone of strong historical resistance where we anticipate a pullback or overbought conditions.
💡 Pro Tip: Consider taking partial profits on the way up and moving your stop loss to breakeven to secure risk-free trades!
🌐 Market Context & Correlated Pairs to Watch:
Understanding correlations is key to validating this thesis! Keep an eye on these:
OANDA:USDCAD & PEPPERSTONE:USDX (DXY): 👑 DIRECT CORRELATION. A stronger US Dollar Index typically boosts USD/CAD. Watch for DXY strength to confirm our bullish bias.
OANDA:USDCAD & GETTEX:WTIC (Crude Oil): 👑 INVERSE CORRELATION. Canada is a major oil exporter. If Oil prices fall, CAD often weakens, pushing USD/CAD higher (bullish for our trade).
FX:EURUSD & FX:GBPUSD : These major pairs often move inversely to the USD. If they are falling, it can signal broad USD strength, supporting our USD/CAD long.
✅ Key Takeaways:
✅ Wait for a confirmed breakout and close above 1.41400.
✅ Execute entries using the layer method for best average price.
✅ MANAGE YOUR RISK! This is not financial advice. Your risk, your rules.
✅ Watch correlated pairs ( TVC:DXY , TVC:XAU , GETTEX:WTIC ) for confluence.
👑 Let's get this bread, traders! If you found this idea helpful, please give it a LIKE 👍, SHARE it with a fellow trader, and FOLLOW me for more high-quality setups! Your support helps the community grow! 💬 Drop a comment below with your thoughts!

USDCAD Resistance Ahead!
HI,Traders !
#USDCAD keeps going up
And the pair is locally oversold
So after it hits the horizontal
Resistance of 1.40666 we
Will be expecting a local
Bearish correction !
Comment and subscribe to help us grow !

USD/CAD Price Outlook – Trade Setup (USD/CAD)📊 Technical Structure
OANDA:USDCAD USD/CAD remains supported above 1.4014–1.4019, a key intraday demand zone that has supported price multiple times over the past sessions. Price is attempting a rebound from this support area, pushing back toward the 1.4040–1.4045 intraday pivot.
A sustained move above 1.4050 may open room for a continuation toward the resistance zone at 1.4066–1.4072, which aligns with previous supply and structural highs on the 30M chart. Failure to hold 1.4010 would invalidate the bullish setup and expose downside risk toward 1.3980.
Overall, price action favours a buy-the-dip structure as long as the support zone remains intact.
🎯 Trade Setup
Idea: Buy from support zone for continuation toward resistance.
Entry: 1.4014 – 1.4019
Stop Loss: 1.4011
Take Profit 1: 1.4066
Take Profit 2: 1.4072
Risk–Reward Ratio: ≈ 1 : 6.46
Bias remains short-term bullish while the pair trades above 1.4010.
🌐 Macro Background
USD/CAD extends modest gains around 1.4030–1.4050 during Monday’s Asian session as the Canadian Dollar weakens alongside declining crude oil prices.
According to FXStreet, “USD/CAD holds gains near 1.4050 as lower crude Oil prices weigh on the Canadian Dollar.” 【FXStreet】
Oil Pressure on CAD:
WTI crude pulls back from last session’s 2% rise, trading near $59.30 after Russia’s Novorossiysk port resumed operations following a two-day shutdown caused by a Ukrainian drone strike.
Meanwhile, the IEA warns of a potential 4 million bpd oversupply in 2026, reinforcing bearish pressure on energy markets.
BoC Expectations:
Markets expect the Bank of Canada to hold rates steady through 2026, unless economic conditions deteriorate further. October CPI data later today could influence rate expectations.
Fed Commentary:
Hawkish remarks from Fed officials continue to support the US Dollar.
Kansas City Fed President Jeffery Schmid said monetary policy should “lean against demand growth,” calling current conditions “modestly restrictive.”
Rate Cut Odds:
CME FedWatch shows 46% probability of a 25bps Fed cut in December — a sharp decline from 67% last week, reducing near-term dovish expectations.
Overall, the macro backdrop remains slightly USD-supportive, maintaining upward pressure on USD/CAD as long as oil prices stay weak and Fed officials maintain a cautious stance.
🔑 Key Technical Levels
Resistance: 1.4066 – 1.4072
Support: 1.4014 – 1.4019
Psychological Level: 1.4050
📌 Trade Summary
USD/CAD sustains above the 1.4010 support region, keeping the short-term bias tilted to the upside. Weakening oil prices and cautious Fed rhetoric favour a rebound toward 1.4066–1.4072.
A break below 1.4011 would negate the bullish scenario and shift focus toward 1.3980.
⚠️ Disclaimer
This analysis is for reference only and does not constitute trading advice. Trading involves significant risk, and proper risk management is essential.

#USDCAD: Price to continue remain bullish! Let's wait and watchDear traders,
I hope you all are doing well.
The USDCAD pair has been extremely bullish since the CAD currency began to decline. We now have an excellent opportunity to rise, with the potential for the price to reverse in good time. This analysis is based solely on the current market conditions and price behaviour, so it may differ from your own views. The target is a swing, and you can adjust it according to your own analysis. Please use this analysis for educational purposes only.
Good luck and trade safely!
Team Setupsfx_

USDCAD Will Go Down!
HI,Traders !
#USDCAD made a bearish
Breakout of the rising support
And is now consolidating
Below the line so we are
Bearish biased and we will
Be expecting a further
Bearish continuation !
Comment and subscribe to help us grow !

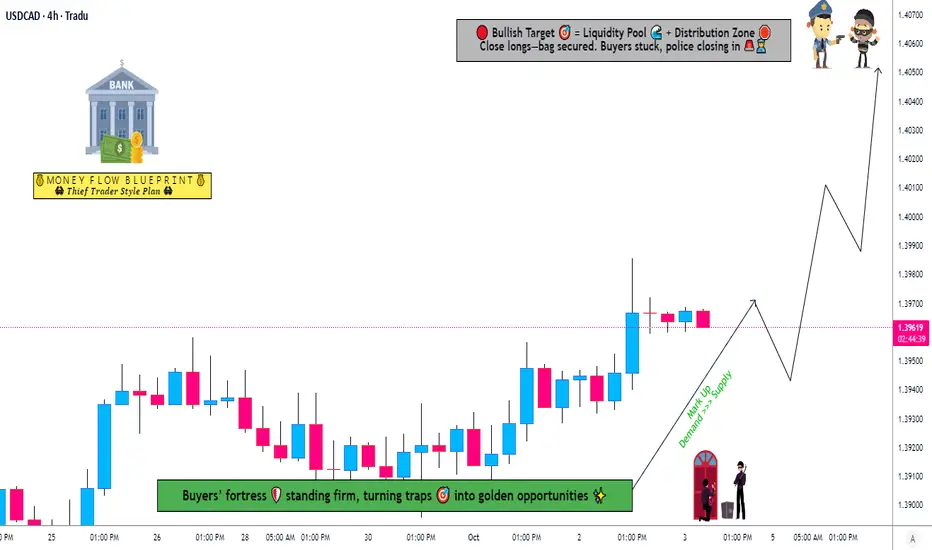
Trading Map for USD/CAD — Bullish Layered Entry Strategy🦒 The Loonie Heist: USD/CAD Swing & Day Trade Wealth Map 🚀
Asset: USD/CAD ("The Loonie")
Outlook: Bullish 📈
Vibe: Thief-Style Layering Strategy — Sneaky, Smart, and Stylish 😎
Welcome, Ladies and Gentlemen, to the Loonie Heist! This USD/CAD trading plan is designed for the crafty traders out there — our Thief OG's — ready to layer up entries and snatch profits like pros. Let’s break down this stylish, rule-compliant TradingView idea that’s ready to steal the spotlight! ✨
📜 The Plan: Bullish Breakout with a Thief’s Precision 🕵️♂️
Strategy: Thief Layering — A multi-limit order approach for smooth, calculated entries.
Entry Levels: Deploy your buy limit orders like a mastermind at:
1.39300
1.39400
1.39500
1.39600
Pro Tip: Feel free to add more layers based on your risk appetite — scale it up, Thief OG style!
Stop Loss (SL): Set a sneaky SL at 1.39000 to guard your loot.
Note: This is my suggested SL, but you’re the boss of your trades — adjust to your risk tolerance! ⚠️
Take Profit (TP): Aim for 1.40500, just shy of the 1.40600 police barricade (a strong resistance zone with overbought signals and potential traps). Lock in profits and escape like a pro! 🏃♂️ Note: TP is your call — take the money when it feels right!
🔍 Why USD/CAD? Key Market Insights 🧠
Market Context: USD/CAD is riding a bullish wave, driven by USD strength and CAD’s sensitivity to oil prices. Keep an eye on macroeconomic data like US Non-Farm Payrolls and Canadian employment reports, as they can sway the Loonie! 📊
Technical Setup: The pair is testing key support levels around 1.39300–1.39600, making it a prime spot for layered entries. The 1.40600 resistance is a historical hurdle, so watch for price action there! 🚨
Thief’s Edge: By layering buy limits, you’re stacking the odds in your favor, catching dips and riding the trend with finesse.
💰 Related Pairs to Watch 👀
Keep these correlated pairs on your radar to spot opportunities and confirm trends:
OANDA:USDCHF ($): Positive correlation with USD/CAD due to USD strength. If USD/CHF is climbing, it could signal more upside for USD/CAD.
OANDA:AUDUSD ($): Negative correlation with USD/CAD. A falling AUD/USD (stronger USD) often aligns with USD/CAD bullish moves.
OANDA:NZDUSD ($): Similar to AUD/USD, this pair’s weakness can support USD/CAD’s bullish case.
Key Point: Watch oil prices (WTI, Brent) since CAD is a commodity currency. If oil weakens, USD/CAD may push higher! 🛢️
⚠️ Risk Management (Thief’s Code) 🛡️
Risk Disclaimer: Trading is a high-stakes game, and this Thief-Style Strategy is for fun and educational purposes. Always manage your risk, set your own SL/TP, and trade responsibly. Don’t chase the market — let it come to you!
Position Sizing: Adjust your lot sizes based on your account and risk tolerance. The Thief OG never risks the whole vault! 💸
✨ “If you find value in my analysis, a 👍 and 🚀 boost is much appreciated — it helps me share more setups with the community!”
Disclaimer: This is a Thief-Style Trading Strategy crafted for fun and educational purposes. Trade at your own risk, and always conduct your own analysis.
#Hashtags: #USDCAD #Forex #SwingTrading #DayTrading #ThiefStrategy #LoonieHeist #Bullish #TradingView
Is This the Next Bullish Wave for USD/CAD Traders?💵 USD/CAD "THE LOONIE" | Forex Market Wealth Strategy Map (Swing/Day Trade)
📊 Trade Plan: BULLISH Outlook
Entry Style (Thief Layering Strategy):
Multiple buy limit orders layered around 🔑 key levels.
Example layers:
🟢 1.37600
🟢 1.37700
🟢 1.37800
🟢 1.37900
🟢 1.38000
(You can increase or reduce your own limit layers depending on risk & style).
Stop Loss (Thief SL 🚨):
🛑 Suggested protective stop @ 1.37400
⚠️ Note to my OG Thief crew: This SL is just my style. You are free to choose your own SL — manage your risk your way.
Target (Police Trap Exit 🎯):
👮♂️ Strong resistance + overbought conditions = possible trap zone.
🎯 Target: 1.39200
⚠️ Note: Same as above — this TP is my roadmap, but you choose how & when to take profits. Escape smart!
🔍 Key Market Outlook
USD/CAD shows bullish momentum supported by USD resilience and CAD lagging on weaker oil flows.
Macro View: Fed’s tone + oil market softness = stronger USD pressure on CAD.
Sentiment Check: Buyers layering in, market showing gradual accumulation.
Police (resistance) spotted higher up — profit-taking advised before getting caught in the trap!
🔗 Related Pairs to Watch & Correlations
💹 TVC:DXY → Dollar Index (tracks USD strength 💪).
🛢 BLACKBULL:WTI Crude Oil → CAD correlation 🔑 (weaker oil = weaker CAD).
💶 FX:EURUSD / FX:GBPUSD → Inverse flows vs USD.
🇲🇽 FX:USDMXN → Another USD + commodity-linked pair to compare moves.
Keeping an eye on these helps confirm momentum across markets ✅.
✨ “If you find value in my analysis, a 👍 and 🚀 boost is much appreciated — it helps me share more setups with the community!”
⚠️ Disclaimer: This is a Thief style trading strategy 🥷 created for fun & educational sharing only. This is not financial advice. Trade at your own risk.
#USDCAD #Forex #SwingTrade #DayTrading #TradingStrategy #Loonie #ThiefStyle #FXCorrelations #Dollar #CAD #ForexCommunity

USD/CAD Bullish Bias Supported by COT Data and Seasonal Trends🗓 Monthly Chart Overview
• Price Inefficiency Zone: There's a clear imbalance between 1.40165 and 1.41248, suggesting a potential magnet for price. A retracement to at least the 50% level of this inefficiency could be expected.
• Bullish Structure: Price has formed a bullish order block and is currently retracing, which often precedes a continuation move upward.
• This setup hints at accumulation before a bullish expansion.
📆 Weekly Chart Insights
• Inefficiency Filled: Price has filled previous inefficiencies, showing healthy market structure.
• Liquidity Behavior: We've seen price sweep lows, then begin sweeping highs, while respecting bullish blocks—a strong indication of a shift in directional intent.
• This behavior supports the idea that USD/CAD is preparing for a bullish continuation.
📅 Daily Chart Momentum
• Aggressive Breakout: After a period of consolidation, price broke out aggressively to the upside, confirming bullish momentum.
• Structure: The daily chart maintains a bullish structure, reinforcing the higher timeframe bias.
💹 Commitment of Traders (COT) Data
• USD Positioning: The U.S. Dollar is showing net buying interest, supporting strength.
• CAD Positioning: The Canadian Dollar is net bearish on average when compared to last year’s data.
• This divergence in sentiment adds confluence to a bullish USD/CAD bias.
📊 Seasonal Trends
• Historically, USD/CAD tends to rise from August through November, with September, October, and especially November being the most bullish months.
• This seasonal tendency aligns with the current technical and fundamental setup.
🏦 Macro Considerations
• Interest Rates: Keep a close eye on central bank rate decisions and forward guidance, as they can significantly impact USD/CAD volatility and direction.
🔍 Summary
USD/CAD shows strong bullish potential across monthly, weekly, and daily timeframes. Technical structure, COT data, and seasonal trends all point toward a continuation to the upside. A revisit to the inefficiency zone around 1.4060–1.4120 could be a key target in the coming months.

#USDCAD: Two Major Buying Zones, Patience Pays! As previously analysed, USDCAD is expected to decline towards our predetermined entry point. We anticipate a bearish US Dollar for the remainder of the week, which will ultimately lead USDCAD to reach the entry zone. Three distinct target areas exist, collectively worth over 1100 pips. Each entry point, stop loss, and take profit is clearly defined.
We wish you the best of luck and safe trading.
Thank you for your support.
If you wish to assist us, we encourage you to consider the following actions:
- Like our ideas
- Provide comments on our ideas
- Share our ideas
Kind Regards,
Team Setupsfx_
Much Love ❤️🚀

#USDCAD: 1000+ Pips Big Bullish Move With Three TargetsThe USDCAD is currently in a bearish trend since the day has dropped significantly and is still falling. We anticipate the price to drop slightly more before it reaches our entry zone. There are two entry points, and you can choose either one that aligns with your views. There are three targets, and you can set take profit targets that suit you best.
Good luck and trade safely.
Thanks for your support! 😊
If you want to help us out, here are a few things you can do:
- Like our ideas
- Comment on our ideas
- Share our ideas
Team Setupsfx_
❤️🚀

#USDCAD: +400 PIPS Possible Buying Opportunity! USDCAD currently trading at a critical level and we think we expect price to start distributing to another high and take price to 1.45 or beyond that level. This idea possibly will give us a great to risk to reward ratio trade. Please do your own research and manage your risk always.
Team Setupsfx_!
