USDCAD— FRGNT DAILY CHART FORECAST. Q1 | W4 | D28 | Y26📅 Q1 | W4 | D28 | Y26
📊 USDCAD— FRGNT DAILY CHART FORECAST
🔍 Analysis Approach
I’m applying a developed version of Smart Money Concepts, with a structured focus on:
• Identifying Key Points of Interest (POIs) on Higher Time Frames (HTFs) 🕰️
• Using those POIs to define a clear and controlled trading range 📐
• Refining those zones on Lower Time Frames (LTFs) 🔎
• Waiting for a Break of Structure (BoS) as confirmation ✅
This process keeps me precise, disciplined, and aligned with market narrative, rather than reacting emotionally or chasing price.
💡 My Motto
“Capital management, discipline, and consistency in your trading edge.”
A positive risk-to-reward ratio, combined with a high-probability execution model, is the backbone of any sustainable trading plan 📈🔐
⚠️ On Losses
Losses are part of the mathematical reality of trading 🎲
They don’t define you — they are necessary, expected, and managed.
We acknowledge them, learn, and move forward 📊➡️
🙏 I appreciate you taking the time to review my Daily Forecast.
Further context and supporting material can be found in the Links section.
Stay sharp 🧠
Stay consistent 🎯
Protect your capital 🔐
— FRGNT 🚀📈
FX:USDCAD
Usdcadlong

TheGrove | USDCAD buy | Idea Trading AnalysisUSD/CAD is trading within a Ascending pattern, with price holding above the ascending support line after a clear bullish and is moving on support line and after going up. Price is trading inside a bullish ascending channel after a strong break of structure.
We expect a decline in the channel after testing the current level
Hello Traders, here is the full analysis.
I think we can soon see more fall from this range! GOOD LUCK! Great buy opportunity USDCAD
I still did my best and this is the most likely count for me at the moment.
-------------------
Traders, if you liked this idea or if you have your own opinion about it, write in the comments. I will be glad ⚜️

USD/CAD Closing in on Breakout! Will Bulls Take Control?🔥 USD/CAD "THE LOONIE": Bullish Breakout Play (Swing Trade Setup) | Layer Entry Strategy 🚀
TradingView Description:
🎯 TRADE IDEA: BULLISH SWING ON USD/CAD
🏆 Plan & Thesis:
The Loonie is approaching a critical juncture! 🧐 We are stalking a potential bullish breakout above the strong resistance zone at 1.41400. Our plan is to patiently wait for a confirmed breakout and momentum shift, signaling the next leg up. This is a swing trade opportunity targeting a key resistance area.
⚡ Why This Setup?
Key Resistance Break: A decisive break above 1.41400 indicates buyer strength overpowering sellers.
Trend Continuation: Aligns with the broader bullish structure on the higher timeframes.
Low-Risk, High-Reward Entry: Using the "Thief" layer strategy to optimize our average entry price.
📈 Trade Execution Details:
🎯 Entry Strategy (The "Thief" Layer Method): 🤑
We do not chase the price! We use a strategic layer of Buy Limit orders to enter on any retracement after the breakout is confirmed.
Layer 1: 1.41200
Layer 2: 1.41000
Layer 3: 1.40800
Layer 4: 1.40600
👉 You can adjust the number of layers and levels based on your capital and risk appetite.
🛑 Stop Loss (RISK MANAGEMENT):
A consolidated stop loss is placed below all entry layers at 1.40400.
⚠️ Disclaimer: This is MY stop loss. Please adjust your position size and SL based on YOUR personal risk management strategy. Protect your capital!
🎯 Take Profit Target:
Our primary profit target is set at 1.42100, a zone of strong historical resistance where we anticipate a pullback or overbought conditions.
💡 Pro Tip: Consider taking partial profits on the way up and moving your stop loss to breakeven to secure risk-free trades!
🌐 Market Context & Correlated Pairs to Watch:
Understanding correlations is key to validating this thesis! Keep an eye on these:
OANDA:USDCAD & PEPPERSTONE:USDX (DXY): 👑 DIRECT CORRELATION. A stronger US Dollar Index typically boosts USD/CAD. Watch for DXY strength to confirm our bullish bias.
OANDA:USDCAD & GETTEX:WTIC (Crude Oil): 👑 INVERSE CORRELATION. Canada is a major oil exporter. If Oil prices fall, CAD often weakens, pushing USD/CAD higher (bullish for our trade).
FX:EURUSD & FX:GBPUSD : These major pairs often move inversely to the USD. If they are falling, it can signal broad USD strength, supporting our USD/CAD long.
✅ Key Takeaways:
✅ Wait for a confirmed breakout and close above 1.41400.
✅ Execute entries using the layer method for best average price.
✅ MANAGE YOUR RISK! This is not financial advice. Your risk, your rules.
✅ Watch correlated pairs ( TVC:DXY , TVC:XAU , GETTEX:WTIC ) for confluence.
👑 Let's get this bread, traders! If you found this idea helpful, please give it a LIKE 👍, SHARE it with a fellow trader, and FOLLOW me for more high-quality setups! Your support helps the community grow! 💬 Drop a comment below with your thoughts!

USD/CAD Price Outlook – Trade Setup📊 Technical Structure
OANDA:USDCAD USD/CAD is holding firmly above a well-defined support zone around 1.3855–1.3865, following a strong impulsive advance earlier in the week. Recent price action shows consolidation above support rather than aggressive selling, indicating that downside momentum remains limited.
From a structural perspective, the pair is forming a bullish continuation pattern, with higher lows maintained above the support zone. As long as this area holds, price action favours a renewed upside push toward the 1.3900–1.3915 resistance zone, rather than a deeper corrective pullback.
🎯 Trade Setup (Bullish Bias)
Entry Zone: 1.3855 – 1.3865
Stop Loss: 1.3853
Take Profit 1: 1.3900
Take Profit 2: 1.3915
Risk–Reward Ratio: Approx. 1 : 3.24
📌 Invalidation:
A sustained break and close below 1.3857 would invalidate the bullish setup and signal a deeper correction.
🌐 Macro Background
On the macro side, the U.S. Dollar continues to receive underlying support from resilient U.S. economic data, reinforcing expectations that the Federal Reserve is in no rush to cut interest rates. This backdrop helps maintain a firm USD base in the near term.
Although the Canadian Dollar is supported by relatively stable oil prices, the impact appears contained for now. With no clear bearish catalyst against the USD, USD/CAD remains biased toward consolidation followed by upside continuation, particularly while price holds above key technical support.
🔑 Key Technical Levels
Resistance Zone: 1.3900 – 1.3915
Support Zone: 1.3855 – 1.3865
Bullish Invalidation: Below 1.3853
📌 Trade Summary
USD/CAD is consolidating above a critical support zone after a strong bullish leg. As long as price remains supported above 1.3855, the bias favours a buy-on-dips approach, targeting a retest of the upper resistance band.
⚠️ Disclaimer
This analysis is for reference only and does not constitute trading advice. Financial markets involve significant risk; proper risk and position management are essential.

USD/CAD Bullish Structure Confirmed — Momentum Favors Upside!🚨 USD/CAD "THE LOONIE" FOREX OPPORTUNITY 🇺🇸🇨🇦 | Swing/Day Trade Setup
📊 MARKET OVERVIEW
Asset: USD/CAD (United States Dollar / Canadian Dollar)
Nickname: "The Loonie" 🦆
Market: Forex Major Pair
Trade Style: Swing Trading / Day Trading
Timeframe: Multi-timeframe analysis confirmed
🎯 TRADE PLAN BREAKDOWN
📈 Bias: BULLISH - Moving Average Breakout Confirmed ✅
Price action showing strong momentum above key moving averages with breakout structure validated.
🔵 ENTRY ZONE:
Flexible entry strategy - Multiple price levels available for position building
Current market conditions allow entries at various technical levels
🎯 TARGET LEVEL:
TP: 1.40000 🎯
This psychological level acts as:
Strong resistance zone 💪
Historical price reaction area
Potential overbought territory ⚠️
Watch for bull trap scenarios near target
⚠️ PROFIT MANAGEMENT NOTE:
Fellow traders & market OGs - This is MY target level based on technical analysis. YOU control YOUR money! 💰 Scale out, trail stops, or take profits at YOUR comfort zone. Trade at your own risk and never risk more than you can afford to lose! 🛡️
🔴 STOP LOSS:
SL: 1.38100 🛑
Risk management level positioned below key support structure.
⚠️ RISK MANAGEMENT NOTE:
Dear traders - This SL is based on technical invalidation points. Adjust YOUR stop loss according to YOUR risk tolerance, account size, and trading plan. Never trade without stops! Your capital, your rules! 💼
🔗 CORRELATED PAIRS TO WATCH
📌 US DOLLAR PAIRS:
EUR/USD 💶 - Inverse correlation (USD strength affects both)
GBP/USD 💷 - Similar USD exposure, watch for divergence
DXY (US Dollar Index) 📈 - Primary USD strength indicator
USD/JPY 🇯🇵 - Risk sentiment correlation
📌 COMMODITY CURRENCY PAIRS:
AUD/USD 🇦🇺 - Fellow commodity currency (gold/resources)
NZD/USD 🇳🇿 - Risk appetite correlation with CAD
USD/MXN 🇲🇽 - North American regional correlation
📌 ENERGY-RELATED:
Crude Oil (WTI/Brent) 🛢️ - CRITICAL for CAD (Canada = major oil exporter)
Strong inverse correlation: Oil ⬆️ = CAD ⬆️ (USD/CAD ⬇️)
📰 FUNDAMENTAL & ECONOMIC FACTORS
🇺🇸 US DOLLAR DRIVERS:
✅ Federal Reserve Policy - Monitor FOMC statements & rate decisions
✅ US Economic Data:
Non-Farm Payrolls (NFP) 📊
CPI/Inflation reports 📈
Retail Sales & Consumer Confidence
GDP Growth figures
✅ Treasury Yields - Higher yields = USD strength typically
🇨🇦 CANADIAN DOLLAR DRIVERS:
✅ Bank of Canada (BoC) Policy - Rate decisions & monetary policy stance
✅ Crude Oil Prices 🛢️ - MOST IMPORTANT for CAD strength
✅ Canadian Economic Data:
Employment figures
GDP reports
Manufacturing & Trade Balance
Housing market data
⚡ UPCOMING CATALYSTS TO WATCH:
🔔 Check economic calendar for:
US Fed speeches & minutes
Canadian employment reports
Weekly oil inventory data (EIA reports)
Central bank rate decisions (both Fed & BoC)
Inflation data releases from both nations
Trade balance & current account reports
🌍 GLOBAL RISK FACTORS:
⚠️ Geopolitical tensions affecting oil markets
⚠️ Global economic growth concerns
⚠️ OPEC+ production decisions impacting oil
⚠️ US-China trade relations
⚠️ Energy policy changes in North America
🔑 KEY TECHNICAL POINTS
✨ Moving average breakout structure confirmed
✨ Momentum indicators supporting bullish bias
✨ Watch for resistance cluster around 1.40000
✨ Volume confirmation on upside moves is critical
✨ Multiple timeframe alignment present
⚖️ RISK DISCLAIMER
🚨 TRADING INVOLVES SUBSTANTIAL RISK 🚨
This is NOT financial advice - purely educational technical analysis! 📚
Always use proper risk management (1-2% per trade max) 🛡️
Never trade with money you can't afford to lose 💸
Past performance doesn't guarantee future results 📉📈
Market conditions change rapidly - stay adaptable! 🔄
Trade smart, manage risk, protect your capital! 💪
💬 ENGAGEMENT CALL-TO-ACTION
🔥 Found this analysis helpful?
👍 Smash that LIKE button!
💬 Drop your thoughts in the COMMENTS!
👥 FOLLOW for more forex setups & market insights!
🔔 Turn on notifications so you never miss an update!
Let's make profitable trades together! 🚀💰

USDCAD Long Setup — Retest Zone Could Fuel the Next Push HigherToday, I want to share a long trading opportunity on the USDCAD ( FX:USDCAD ) pair. Stay tuned!
USDCAD is currently breaking through the resistance zone(1.394 CAD-1.389 CAD) with good momentum, and this zone is now acting as support. It’s also near the Potential Reversal Zone (PRZ) and the support lines, which can provide a solid foundation for the continuation of the bullish trend.
From an Elliott Wave perspective, it seems that USDCAD has completed main wave 3, and we should now expect the corrective wave 4 before the pair resumes its upward movement.
Additionally, recent U.S. unemployment claims data, which was favorable for the DXY index( TVC:DXY ), supports the continuation of the USDCAD bullish trend.
I expect that as USDCAD enters the Potential Reversal Zone (PRZ) , it will begin to climb and target the resistance zone(1.394 CAD-1.389 CAD) once again.
First Target: 1.389 CAD
Second Target: 1.393 CAD
Stop Loss(SL): 1.378 CAD(Worst)
💡 Please respect each other's opinions and express agreement or disagreement politely.
📌U.S. Dollar/Canadian Dollar Analysis (USDCAD), 4-hour time frame.
🛑 Always set a Stop Loss(SL) for every position you open.
✅ This is just my idea; I’d love to see your thoughts too!
🔥 If you find it helpful, please BOOST this post and share it with your friends.

USDCAD Trade Setup: Possible Buy the Dip OpportunityWe are looking at a possible Buy setup on USDCAD! 🇨🇦🇺🇸 The Canadian Dollar is showing significant weakness due to the recent strikes in Venezuela, which have unexpectedly created a supply glut in the energy sector. As Oil prices 🛢️ drop, the CAD takes a hit, while the Greenback (USD) has been gathering strength over the last week.
🚀 The Strategy: Buy Strength, Sell Weakness We are sticking to the golden rule of trend trading. Here is the technical breakdown of what I am watching for:
I am waiting for price to pull back and run sell-side liquidity. 💧
Watch the Weekly Open. I want to see price dip below it to trap shorts, then reclaim that level. A retest of the Weekly Open is our prime Point of Interest (POI). 🎯 Before entry, we need to see a clear Break of Structure (BOS) to the upside. 📈
⚡ Entry Scenarios
Conservative: Wait for the reclaim and retest of the Weekly Open.
Aggressive: Enter on the BOS during the current pullback phase.
🛡️ Place your Stop Loss just below the swing low once the rotation is confirmed. Let the market prove you right!
⚠️ Disclaimer: This analysis is for educational purposes only and does not constitute financial advice. Always do your own due diligence.

USD/CAD - Bullish Pennant Loading (09.01.2026)📝 Description 🔍 Setup (Technical Structure) FX:USDCAD
USD/CAD is forming a classic Bullish Pennant pattern after a strong impulsive move up (flagpole). Price is consolidating with higher lows, respecting short-term EMA support and holding above the Ichimoku cloud — a sign of healthy bullish continuation.
Key confirmations:
Strong bullish flagpole
Tight consolidation (pennant structure)
Price holding above EMA & cloud
No major bearish rejection yet
📍 Support & Resistance
🔴 Key Support: Pennant base / EMA zone
🟢 1st Resistance: 1.3911
🟢 2nd Resistance / Target: 1.3935
🎯 Measured Move Target: Based on flagpole height projection
#USDCAD #ForexTrading #BullishPennant #PriceAction #TrendContinuation #SupportResistance #TradingView #Kabhi_TA_Trading
⚠️ Disclaimer
This analysis is for educational purposes only.
Forex trading involves risk — always use proper risk management and stop-loss.
💬 Support the Analysis👍 Like if you see the bullish continuation
💬 Comment: Breakout or Fakeout? 🔁 Share with traders watching USD/CAD

USD/CAD(20260108)Today's AnalysisMarket News:
U.S. Energy Secretary Chris Wright stated that the Trump administration plans to take over Venezuela's future oil sales and use the proceeds to rebuild the country's economy.
"If we control where the oil flows and the cash flow generated from those sales, we will have tremendous leverage," Wright said Wednesday at the Goldman Sachs Energy, Clean Technology, and Utilities conference in Miami. "We need that leverage and control over oil sales to drive the necessary changes in Venezuela." Wright anticipates that Venezuela's daily crude oil production could increase by hundreds of thousands of barrels in the short to medium term. The U.S. government plans to deposit the proceeds into government accounts to benefit the Venezuelan people.
Technical Analysis:
Today's Buy/Sell Threshold:
1.3837
Support and Resistance Levels:
1.3908
1.3881
1.3864
1.3809
1.3792
1.3765
Trading Strategy:
If the price breaks above 1.3864, consider buying with a first target price of 1.3881.
If the price breaks below 1.3837, consider selling with a first target price of 1.3809.

USDCAD📉 OANDA:USDCAD Technical Analysis (4H Timeframe)
The overall trend for USD/CAD has shifted to bearish, as the price is trading below the downward-sloping EMA 200 (black line) and has established a series of lower highs and lower lows 📉. The momentum was notably strong during the descent, characterized by large bearish candle bodies. Currently, the price is in a corrective phase (wave 5 of the recent leg), attempting a pullback toward the EMA 50 (red line). The EMA 50 is currently acting as immediate dynamic resistance. If the price fails to break above the 1.38270 USD level with conviction, we expect a continuation of the primary bearish trend toward the lower liquidity zones 🐻.
🔑 Key Levels to Watch:
Major Resistance Zone: 1.41400 USD (Primary Origin Grey Box) 🚩
Secondary Resistance: 1.39900 USD & 1.39000 USD (Grey Boxes) 🎯
Immediate Pivot Resistance: 1.38270 USD (Current Test Area) 💡
First Downside Target: 1.37320 USD (Recent Support / Grey Box) ⚡
Secondary Support Level: 1.36550 USD (Solid Black Line) 🛡️
Ultimate Demand Target: 1.35850 USD (Dashed Line) 📥

TheGrove | USDCAD buy | Idea Trading AnalysisUSDCAD is moving in an UP trend channel.
The chart broke through the dynamic Support line line
We expect a decline in the channel after testing the current level which suggests that the price will continue to rise
We expect a decline in the channel after testing the current level
Hello Traders, here is the full analysis.
I think we can soon see more fall from this range! GOOD LUCK! Great SELL opportunity USDCAD
I still did my best and this is the most likely count for me at the moment.
-------------------
Traders, if you liked this idea or if you have your own opinion about it, write in the comments. I will be glad ⚜️

USDCAD — FRGNT DAILY CHART FORECAST Q1 | D7 | W1 | Y26
📅 Q1 | D7 | W1 | Y26
📊 USDCAD — FRGNT DAILY CHART FORECAST
🔍 Analysis Approach
I’m applying a developed version of Smart Money Concepts, with a structured focus on:
• Identifying Key Points of Interest (POIs) on Higher Time Frames (HTFs) 🕰️
• Using those POIs to define a clear and controlled trading range 📐
• Refining those zones on Lower Time Frames (LTFs) 🔎
• Waiting for a Break of Structure (BoS) as confirmation ✅
This process keeps me precise, disciplined, and aligned with market narrative, rather than reacting emotionally or chasing price.
💡 My Motto
“Capital management, discipline, and consistency in your trading edge.”
A positive risk-to-reward ratio, combined with a high-probability execution model, is the backbone of any sustainable trading plan 📈🔐
⚠️ On Losses
Losses are part of the mathematical reality of trading 🎲
They don’t define you — they are necessary, expected, and managed.
We acknowledge them, learn, and move forward 📊➡️
🙏 I appreciate you taking the time to review my Daily Forecast.
Further context and supporting material can be found in the Links section.
Stay sharp 🧠
Stay consistent 🎯
Protect your capital 🔐
— FRGNT 🚀📈
FX:USDCAD

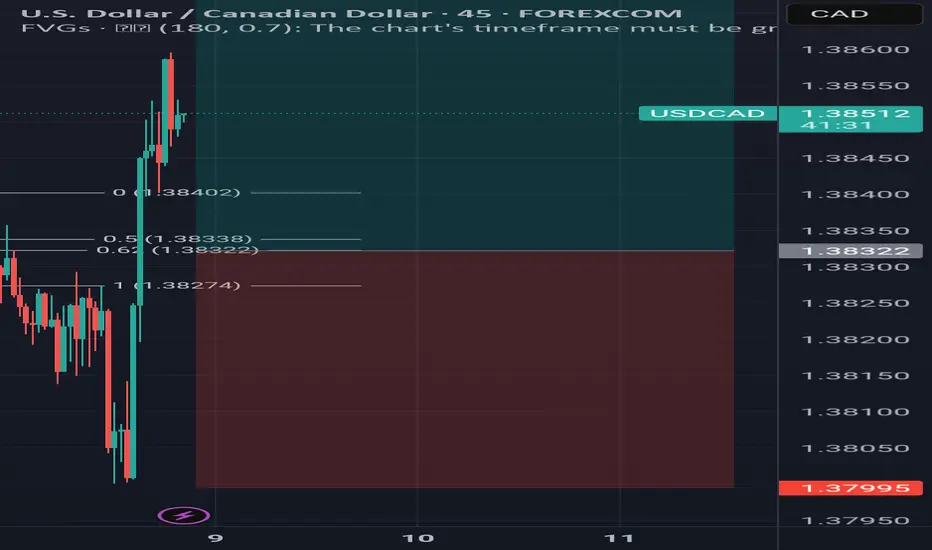
USDCADUSDCAD
- Completed " 1234 " Impulsive Waves
- Demand Zone
- Fibonacci Level - 38.20% / 50.00%
- Change of Characteristics
- Order Block

USD/CAD Price Outlook – Trade Setup📊 Technical Structure
OANDA:USDCAD USD/CAD has staged a steady recovery from the 1.3680–1.3700 base, forming a sequence of higher lows and pushing back above the 1.3750 support zone, which now acts as a short-term demand area. Price is currently trading near 1.3770, approaching the lower boundary of a broader 1.3807–1.3822 resistance zone.
On the 1-hour chart, momentum remains constructive, but price is entering a known supply region. The structure suggests a potential bullish continuation after a shallow pullback, rather than immediate breakout. As long as price holds above 1.3740, buyers retain short-term control.
🎯 Trade Setup (Bullish Bias)
Entry Zone: 1.3740 – 1.3724
Stop Loss: 1.3719
Take Profit 1: 1.3807
Take Profit 2: 1.3822
Estimated Risk-to-Reward: approx. 1 : 3.42
The bullish setup remains valid as long as price holds above 1.3739 on an hourly closing basis.
🌐 Macro Background (Simplified)
USD/CAD is supported by a firm US Dollar ahead of the ISM Manufacturing PMI, with markets cautious about underestimating US economic resilience. Any upside surprise in ISM data could reinforce expectations that the Federal Reserve may slow the pace of rate cuts, lending near-term support to the USD.
At the same time, rising crude oil prices linked to US–Venezuela tensions may provide intermittent support to the Canadian Dollar, limiting upside momentum and keeping the pair in a grinding, step-by-step advance rather than a breakout rally.
In short, macro drivers are mixed, but near-term price action favours buying pullbacks rather than chasing strength.
🔑 Key Technical Levels
Resistance Zone: 1.3807 – 1.3822
Support Zone: 1.3739 – 1.3719
Bullish Invalidation: Hourly close below 1.3739
📌 Trade Summary
USD/CAD is rebuilding bullish structure after defending the 1.3750 area. While immediate upside may be capped near resistance, the broader setup favours dip-buying toward 1.3739–1.3724, with scope for a move toward 1.3807 and 1.3822 if US data supports the Dollar. The bullish view is invalidated only if price breaks and holds below 1.3739.
⚠️ Disclaimer
This analysis is for reference only and does not constitute trading advice. Financial markets involve significant risk; proper risk and position management are essential.

USD/CAD(20251230)Today's AnalysisMarket News:
Last week, Trump posted a lengthy statement on social media, which he called the "Trump Rule." He stated that the Federal Reserve, led by his soon-to-be-nominated new chairman, should lower interest rates to help keep the stock market and economy thriving, even at the risk of stimulating inflation. Trump posted, "I expect my new Fed chair to lower interest rates when the markets are doing well, not to destroy them without reason."
Technical Analysis:
Today's Buy/Sell Threshold:
1.3682
Support and Resistance Levels:
1.3726
1.3709
1.3699
1.3666
1.3655
1.3639
Trading Strategy:
If the price breaks above 1.3699, consider buying, with a first target price of 1.3726.
If the price breaks below 1.3682, consider selling, with a first target price of 1.3666.

USDCAD LONG / SIMPLE and EFFECTIVE strategy !!The strategy is plain and simple:
Buy at major support or sell at major resistance level without waiting for confirmations for best entry and shorter SLs and TPs. RR is 1:1, don't be fooled about all this 1:3-1:5 RR, with 1:1 u will be much more consistent with very low DD periods !!!
Its up to you how much space u will give price to move from the major zone. I personally put my SL at reasonable distance above/below the previous highs/lows, not so much and not 2 pips away from previous wicks.
That's all to the strategy, nothing complicated and engaging, just put alarms previous to the zone and wait for them to pop up on your phone.

Buy usdcad I was expecting a reversal today and it's been confirmed by a fair value gap on the 4hour timeframe. All the best and risk responsibly. Risk to reward is 1:3. Could be more
USD/CAD Price Outlook – Trade Setup📊 Technical Structure
USD/CAD found solid support around the 1.3724–1.3740 zone after a sharp decline earlier in the month and has since rebounded steadily. Price is now consolidating below the 1.3807–1.3822 resistance area, which also marks a key supply zone from the previous breakdown.
On the 4-hour chart, the pair remains above a trendline, suggesting that the broader structure is still corrective-to-bullish rather than a trend reversal. As long as price holds above the 1.3724 support, the technical bias favours a buy-on-dip scenario, with upside potential toward the upper resistance band.
A decisive breakdown below the support zone would invalidate the bullish structure and shift the bias back to neutral or bearish.
🎯 Trade Setup (Bullish Bias)
Entry Zone: 1.3740 – 1.3724
Stop Loss: 1.3717
Take Profit 1: 1.3807
Take Profit 2: 1.3822
Estimated Risk-to-Reward: approx. 1 : 2.86
This bullish setup remains valid as long as price holds above 1.3724 on a 4-hour closing basis.
🌐 Macro Background (Simplified)
The Canadian Dollar has come under pressure following weaker-than-expected Canadian Retail Sales, highlighting soft household demand. This has reinforced expectations that the Bank of Canada (BoC) may need to deliver additional rate cuts, which weighs on CAD sentiment.
Meanwhile, the US Dollar remains relatively stable ahead of key US data releases, including preliminary Q3 GDP. Although USD momentum is not aggressive, relative CAD weakness continues to provide underlying support for USD/CAD.
In short, soft Canadian data + rate-cut expectations create a supportive macro backdrop for USD/CAD on dips.
🔑 Key Technical Levels
Resistance Zone: 1.3807 – 1.3822
Support Zone: 1.3740 – 1.3724
Bullish Invalidation: 4-hour close below 1.3724
📌 Trade Summary
USD/CAD is holding above trend support after a corrective pullback, maintaining a constructive bullish structure. As long as 1.3724 remains intact, a continuation move toward 1.3807–1.3822 is favoured. A clear break below support would invalidate this bullish view and require a reassessment of market direction.
⚠️ Disclaimer
This analysis is for educational purposes only and does not constitute investment advice. Trading involves risk; please manage position size and risk appropriately.

USDCAD 4H AnalysisHere is an analysis of USDCAD on 4H time frame.
It looks like down movement is completed and USDCAD is about to upside.
SL TP levels are given om chart.
NFA DYOR

USD/CAD Price Outlook – Trade Setup📊 Technical Structure
USD/CAD remains in a short-term consolidation phase but continues to hold above the key support zone around 1.3789–1.3779, indicating that downside pressure is limited. Price action over the past sessions shows repeated defences of this support area, followed by higher lows, suggesting buyers are gradually regaining control.
On the 1-hour chart, the pair is attempting to build a base above the support zone while pressing toward the 1.3820 resistance area. As long as price holds above 1.3779, the technical structure favours a continuation move higher toward the 1.3820–1.3830 resistance zone. A clear breakdown below support would invalidate the bullish continuation scenario.
🎯 Trade Setup (Bullish Bias)
Entry Zone: 1.3789 – 1.3779
Stop Loss: 1.3773
Take Profit 1: 1.3820
Take Profit 2: 1.3830
Estimated Risk-to-Reward: approx. 1 : 2.47
The bullish setup remains valid as long as price holds above 1.3779 on an hourly closing basis.
🌐 Macro Background (Simplified)
The US Dollar has found short-term support after rebounding from softer US CPI data, as markets reassess the pace and timing of future Federal Reserve rate cuts. While inflation has cooled, expectations for aggressive easing remain measured, allowing the USD to stabilize in the near term.
Meanwhile, the Canadian Dollar remains cautious ahead of key domestic data, particularly Canadian Retail Sales, which could influence near-term CAD volatility. With oil prices offering limited directional support and macro uncertainty persisting, USD/CAD remains sensitive to relative data surprises.
In short: macro conditions are neutral-to-supportive for USD in the short term, allowing technical factors to take the lead.
🔑 Key Technical Levels
Resistance Zone: 1.3820 – 1.3830
Support Zone: 1.3789 – 1.3779
Bullish Invalidation: Hourly close below 1.3779
📌 Trade Summary
USD/CAD is consolidating above a well-defined support zone, with price structure suggesting accumulation rather than distribution. As long as 1.3779 support holds, a push higher toward 1.3820–1.3830 is favoured. The bullish view remains intact unless price breaks decisively below support, which would shift the bias back to range-bound or bearish conditions.
⚠️ Disclaimer
This analysis is for educational purposes only and does not constitute investment advice. Trading involves risk; please manage position size and risk appropriately.

USDCAD BUY | Day Trading AnalysisHello Traders, here is the full analysis.
Price reversal going up, levels for BUY .. GOOD LUCK! Great BUY opportunity USDCAD
I still did my best and this is the most likely count for me at the moment.
Support the idea with like and follow my profile TO SEE MORE.
Traders, if you liked this idea or if you have your own opinion about it, write in the comments. I will be glad 🤝
Patience is the If You Have Any Question, Feel Free To Ask 🤗
Just follow chart with idea and analysis and when you are ready come in THE GROVE | VIP GROUP, earn more and safe, wait for the signal at the right moment and make money with us💰

Trade Idea on USDCAD on 1HR TFBullish setup on USDCAD on 1HR TF.
Entry: Buy stop at 1.37803
SL: 1.3735 (0.379% loss)
TP: 1.39378 (1.135% profit)
RR: 1:3
Bullish points:
- Falling wedge breakout
- Bullish divergence on 1hr

USDCADUSDCAD
- Bullish Channel as an corrective pattern in Long Time Frame
- Completed " 123 " Impulsive Waves
- Fibonacci Level - 61.80%
- S / R Level
- RSI - Divergence
