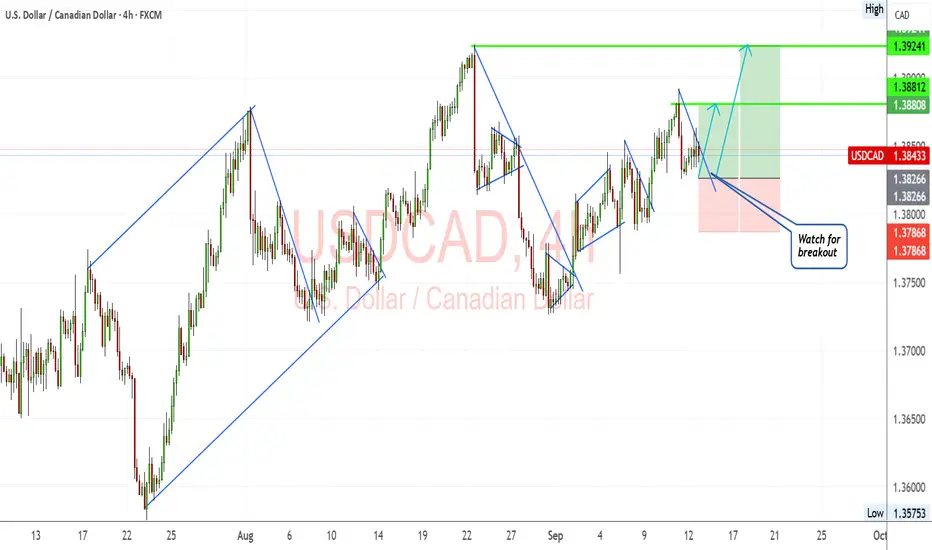
Usdcadlong
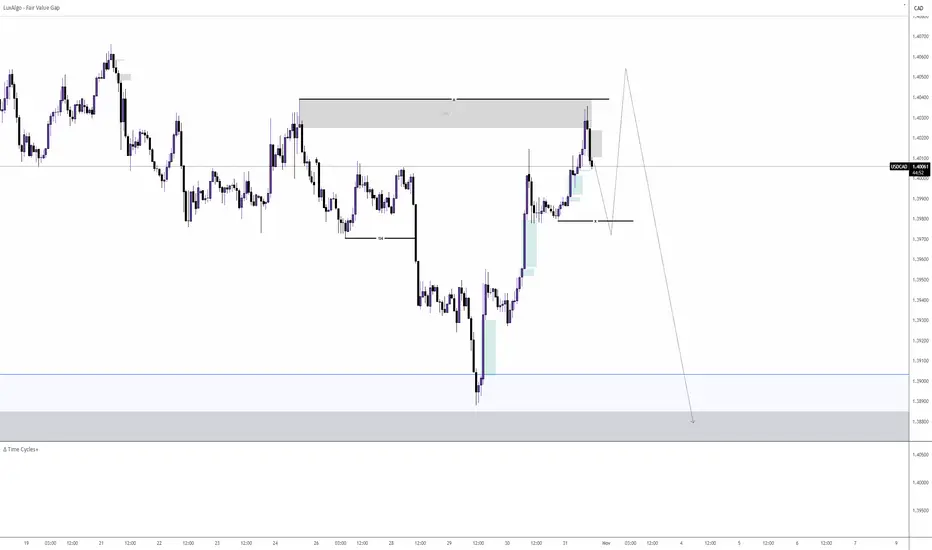
Trading Map for USD/CAD — Bullish Layered Entry Strategy🦒 The Loonie Heist: USD/CAD Swing & Day Trade Wealth Map 🚀
Asset: USD/CAD ("The Loonie")
Outlook: Bullish 📈
Vibe: Thief-Style Layering Strategy — Sneaky, Smart, and Stylish 😎
Welcome, Ladies and Gentlemen, to the Loonie Heist! This USD/CAD trading plan is designed for the crafty traders out there — our Thief OG's — ready to layer up entries and snatch profits like pros. Let’s break down this stylish, rule-compliant TradingView idea that’s ready to steal the spotlight! ✨
📜 The Plan: Bullish Breakout with a Thief’s Precision 🕵️♂️
Strategy: Thief Layering — A multi-limit order approach for smooth, calculated entries.
Entry Levels: Deploy your buy limit orders like a mastermind at:
1.39300
1.39400
1.39500
1.39600
Pro Tip: Feel free to add more layers based on your risk appetite — scale it up, Thief OG style!
Stop Loss (SL): Set a sneaky SL at 1.39000 to guard your loot.
Note: This is my suggested SL, but you’re the boss of your trades — adjust to your risk tolerance! ⚠️
Take Profit (TP): Aim for 1.40500, just shy of the 1.40600 police barricade (a strong resistance zone with overbought signals and potential traps). Lock in profits and escape like a pro! 🏃♂️ Note: TP is your call — take the money when it feels right!
🔍 Why USD/CAD? Key Market Insights 🧠
Market Context: USD/CAD is riding a bullish wave, driven by USD strength and CAD’s sensitivity to oil prices. Keep an eye on macroeconomic data like US Non-Farm Payrolls and Canadian employment reports, as they can sway the Loonie! 📊
Technical Setup: The pair is testing key support levels around 1.39300–1.39600, making it a prime spot for layered entries. The 1.40600 resistance is a historical hurdle, so watch for price action there! 🚨
Thief’s Edge: By layering buy limits, you’re stacking the odds in your favor, catching dips and riding the trend with finesse.
💰 Related Pairs to Watch 👀
Keep these correlated pairs on your radar to spot opportunities and confirm trends:
OANDA:USDCHF ($): Positive correlation with USD/CAD due to USD strength. If USD/CHF is climbing, it could signal more upside for USD/CAD.
OANDA:AUDUSD ($): Negative correlation with USD/CAD. A falling AUD/USD (stronger USD) often aligns with USD/CAD bullish moves.
OANDA:NZDUSD ($): Similar to AUD/USD, this pair’s weakness can support USD/CAD’s bullish case.
Key Point: Watch oil prices (WTI, Brent) since CAD is a commodity currency. If oil weakens, USD/CAD may push higher! 🛢️
⚠️ Risk Management (Thief’s Code) 🛡️
Risk Disclaimer: Trading is a high-stakes game, and this Thief-Style Strategy is for fun and educational purposes. Always manage your risk, set your own SL/TP, and trade responsibly. Don’t chase the market — let it come to you!
Position Sizing: Adjust your lot sizes based on your account and risk tolerance. The Thief OG never risks the whole vault! 💸
✨ “If you find value in my analysis, a 👍 and 🚀 boost is much appreciated — it helps me share more setups with the community!”
Disclaimer: This is a Thief-Style Trading Strategy crafted for fun and educational purposes. Trade at your own risk, and always conduct your own analysis.
#Hashtags: #USDCAD #Forex #SwingTrading #DayTrading #ThiefStrategy #LoonieHeist #Bullish #TradingView
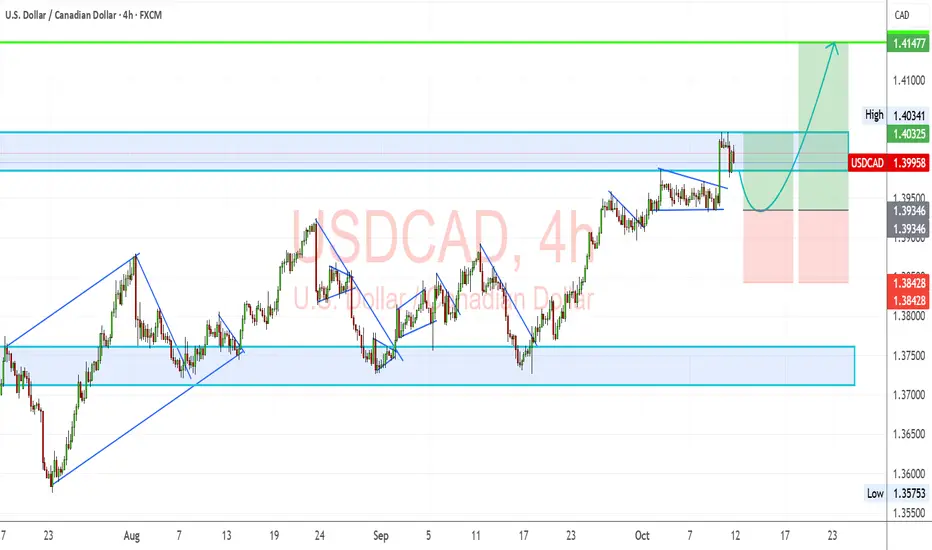
technical analysis of your chart for USD/CAD (15-minute timeframThe pair is moving within an ascending channel, indicating short-term bullish momentum.
Higher highs and higher lows confirm the ongoing uptrend structure.
🟦 Key Zone
Support Level: 1.3985 – 1.3990
This shaded zone represents a demand area where price previously found strong buying interest.
As long as this level holds, the short-term bullish bias remains valid.
🔹 Price Action Outlook
Price is currently testing the lower trendline of the channel and near the support zone.
A bullish reaction from this level could trigger a bounce toward the mid-channel and potentially the upper resistance.
🎯 Target
Upside Target: 1.4039
This corresponds to the upper boundary of the channel and a previous swing high area.
⚠️ Invalidation / Risk Level
A break below 1.3980 would invalidate the bullish setup and could lead to a bearish correction toward 1.3965 or lower.
📈 Trading Signal (Summary)
Bias: Bullish (short-term)
Entry Zone: 1.3985 – 1.3995 (support area)
Target: 1.4039
Stop-Loss: Below 1.3980 ICMARKETS:EURUSD ICMARKETS:GBPUSD ICMARKETS:USDJPY ICMARKETS:GBPJPY ICMARKETS:AUDUSD ICMARKETS:USDCAD ICMARKETS:USDCHF ICMARKETS:NZDUSD ICMARKETS:EURJPY ICMARKETS:EURJPY ICMARKETS:AUDJPY ICMARKETS:EURGBP ICMARKETS:GBPAUD ICMARKETS:USDZAR ICMARKETS:USDDKK

USDCADNot financial advice. The essence of investing & trading is the intelligent and patient preying on the greed, fear, impatience, addiction and ignorance of the majority. It's definitionally Darwinian.

USDCAD Forming Bullish StructureUSDCAD on the daily chart is maintaining a strong bullish structure after breaking above the previous resistance zone around 1.3940. The market has been forming higher highs and higher lows, showing solid buying pressure as the pair heads toward the 1.4140–1.4200 resistance range. The current price action suggests a potential continuation setup where a minor pullback toward the breakout zone could invite more buyers before the next bullish impulse. The upward momentum is supported by clear technical strength, making this a favorable setup for long positions if price sustains above 1.3940.
From a fundamental standpoint, the US dollar remains dominant amid the ongoing strength in the US economy and persistent inflation pressures, which keep expectations of prolonged higher interest rates from the Federal Reserve alive. In contrast, the Canadian dollar faces pressure due to weaker growth prospects and declining oil prices, which reduce demand for the CAD as a commodity-linked currency. Additionally, global risk sentiment has leaned defensive, favoring the USD as a safe-haven asset.
If the bullish momentum continues and the market holds above the current support region, USDCAD could likely retest the 1.4140–1.4200 zone in the near term. Traders will closely monitor US inflation data and crude oil performance as key drivers for this pair’s next move. Overall, the setup aligns with both technical and fundamental bullish conditions, offering a clear profit potential on continuation of the trend.
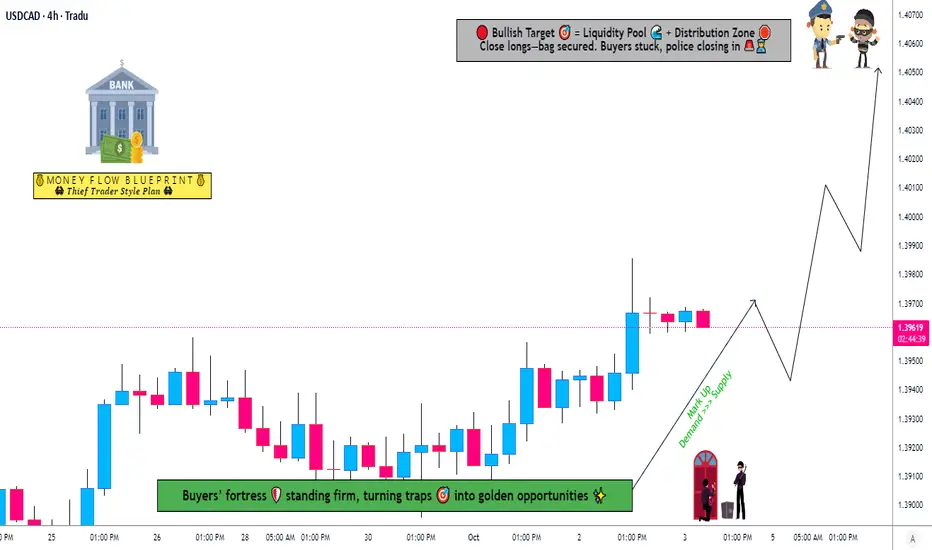
Is This the Next Bullish Wave for USD/CAD Traders?💵 USD/CAD "THE LOONIE" | Forex Market Wealth Strategy Map (Swing/Day Trade)
📊 Trade Plan: BULLISH Outlook
Entry Style (Thief Layering Strategy):
Multiple buy limit orders layered around 🔑 key levels.
Example layers:
🟢 1.37600
🟢 1.37700
🟢 1.37800
🟢 1.37900
🟢 1.38000
(You can increase or reduce your own limit layers depending on risk & style).
Stop Loss (Thief SL 🚨):
🛑 Suggested protective stop @ 1.37400
⚠️ Note to my OG Thief crew: This SL is just my style. You are free to choose your own SL — manage your risk your way.
Target (Police Trap Exit 🎯):
👮♂️ Strong resistance + overbought conditions = possible trap zone.
🎯 Target: 1.39200
⚠️ Note: Same as above — this TP is my roadmap, but you choose how & when to take profits. Escape smart!
🔍 Key Market Outlook
USD/CAD shows bullish momentum supported by USD resilience and CAD lagging on weaker oil flows.
Macro View: Fed’s tone + oil market softness = stronger USD pressure on CAD.
Sentiment Check: Buyers layering in, market showing gradual accumulation.
Police (resistance) spotted higher up — profit-taking advised before getting caught in the trap!
🔗 Related Pairs to Watch & Correlations
💹 TVC:DXY → Dollar Index (tracks USD strength 💪).
🛢 BLACKBULL:WTI Crude Oil → CAD correlation 🔑 (weaker oil = weaker CAD).
💶 FX:EURUSD / FX:GBPUSD → Inverse flows vs USD.
🇲🇽 FX:USDMXN → Another USD + commodity-linked pair to compare moves.
Keeping an eye on these helps confirm momentum across markets ✅.
✨ “If you find value in my analysis, a 👍 and 🚀 boost is much appreciated — it helps me share more setups with the community!”
⚠️ Disclaimer: This is a Thief style trading strategy 🥷 created for fun & educational sharing only. This is not financial advice. Trade at your own risk.
#USDCAD #Forex #SwingTrade #DayTrading #TradingStrategy #Loonie #ThiefStyle #FXCorrelations #Dollar #CAD #ForexCommunity

USD/CAD Bullish Bias Supported by COT Data and Seasonal Trends🗓 Monthly Chart Overview
• Price Inefficiency Zone: There's a clear imbalance between 1.40165 and 1.41248, suggesting a potential magnet for price. A retracement to at least the 50% level of this inefficiency could be expected.
• Bullish Structure: Price has formed a bullish order block and is currently retracing, which often precedes a continuation move upward.
• This setup hints at accumulation before a bullish expansion.
📆 Weekly Chart Insights
• Inefficiency Filled: Price has filled previous inefficiencies, showing healthy market structure.
• Liquidity Behavior: We've seen price sweep lows, then begin sweeping highs, while respecting bullish blocks—a strong indication of a shift in directional intent.
• This behavior supports the idea that USD/CAD is preparing for a bullish continuation.
📅 Daily Chart Momentum
• Aggressive Breakout: After a period of consolidation, price broke out aggressively to the upside, confirming bullish momentum.
• Structure: The daily chart maintains a bullish structure, reinforcing the higher timeframe bias.
💹 Commitment of Traders (COT) Data
• USD Positioning: The U.S. Dollar is showing net buying interest, supporting strength.
• CAD Positioning: The Canadian Dollar is net bearish on average when compared to last year’s data.
• This divergence in sentiment adds confluence to a bullish USD/CAD bias.
📊 Seasonal Trends
• Historically, USD/CAD tends to rise from August through November, with September, October, and especially November being the most bullish months.
• This seasonal tendency aligns with the current technical and fundamental setup.
🏦 Macro Considerations
• Interest Rates: Keep a close eye on central bank rate decisions and forward guidance, as they can significantly impact USD/CAD volatility and direction.
🔍 Summary
USD/CAD shows strong bullish potential across monthly, weekly, and daily timeframes. Technical structure, COT data, and seasonal trends all point toward a continuation to the upside. A revisit to the inefficiency zone around 1.4060–1.4120 could be a key target in the coming months.

#USDCAD: Two Major Buying Zones, Patience Pays! As previously analysed, USDCAD is expected to decline towards our predetermined entry point. We anticipate a bearish US Dollar for the remainder of the week, which will ultimately lead USDCAD to reach the entry zone. Three distinct target areas exist, collectively worth over 1100 pips. Each entry point, stop loss, and take profit is clearly defined.
We wish you the best of luck and safe trading.
Thank you for your support.
If you wish to assist us, we encourage you to consider the following actions:
- Like our ideas
- Provide comments on our ideas
- Share our ideas
Kind Regards,
Team Setupsfx_
Much Love ❤️🚀

#USDCAD: 1000+ Pips Big Bullish Move With Three TargetsThe USDCAD is currently in a bearish trend since the day has dropped significantly and is still falling. We anticipate the price to drop slightly more before it reaches our entry zone. There are two entry points, and you can choose either one that aligns with your views. There are three targets, and you can set take profit targets that suit you best.
Good luck and trade safely.
Thanks for your support! 😊
If you want to help us out, here are a few things you can do:
- Like our ideas
- Comment on our ideas
- Share our ideas
Team Setupsfx_
❤️🚀

#USDCAD: +400 PIPS Possible Buying Opportunity! USDCAD currently trading at a critical level and we think we expect price to start distributing to another high and take price to 1.45 or beyond that level. This idea possibly will give us a great to risk to reward ratio trade. Please do your own research and manage your risk always.
Team Setupsfx_!

USD/CAD) Bullish trend analysis Read The captionSMC Trading point update
Technical analysis of USD/CAD Bullish Continuation Setup (4H Chart)
Technical Overview:
Instrument: U.S. Dollar / Canadian Dollar (USD/CAD)
Timeframe: 4-Hour
Current Price: ~1.4028
Bias: Bullish
---
Chart Breakdown:
1. Fair Value Gap (FVG) Zone – Demand Area (Yellow Box):
Price recently filled the FVG and respected the 1.3970–1.3990 support zone.
This zone acted as a bullish mitigation area, showing institutional buying interest.
2. Structure Shift:
After consolidating, USD/CAD broke above short-term highs, confirming a bullish market structure shift (MSS).
The ongoing pullback into the FVG area could serve as a retest entry point.
3. Target Point:
Projected target is around 1.4124, aligning with previous liquidity highs.
This move suggests a potential +100 pips upside from current levels.
4. Trade Plan:
Entry Zone: 1.3980 – 1.4000 (on FVG retest)
Target: 1.4124
Invalidation: Below 1.3950 (if structure fails and price re-enters deeper range)
Mr SMC Trading point
---
Trading Insight:
This setup reflects a Smart Money Concepts (SMC) bullish continuation pattern.
The market has broken structure to the upside and is likely to continue higher after a brief retracement into the fair value gap zone — targeting liquidity resting above 1.4124.
---
Please support boost 🚀 this analysis

USDCAD Bullish Setup | Wait for Break of Structure ConfirmationUSDCAD continues to trend bullish on the higher timeframe 💪. Recently, we’ve seen a healthy retracement, which could provide the groundwork for a potential trend continuation setup.
🔎 On the 30-minute chart, I’m watching closely for a bullish break of market structure followed by a retest of the current range. If that plays out, it could present a solid buy opportunity aligned with the higher-timeframe trend 📈.
⚖️ However, if price fails to break structure and confirm the setup, there’s no trade — patience is key here. We simply wait for the market to show its hand before acting.
⚠️ Disclaimer: This analysis is for educational purposes only and not financial advice.

USDCAD Dollar Building as Loonie Struggles with Oil & Weak DataUSDCAD has surged into a key resistance zone, showing resilience even against temporary pullbacks. The pair is benefiting from broad USD strength as the Fed maintains a cautious stance on rate cuts, while the Canadian dollar is weighed down by weaker labor data and softer oil demand. Price action suggests the market is gearing up for another bullish extension if buyers can defend current support.
Current Bias
Bullish – upward momentum is intact with strong support holding above 1.3930 and potential continuation toward higher resistance.
Key Fundamental Drivers
USD Strength: Supported by sticky US inflation and a Fed reluctant to accelerate cuts.
CAD Weakness: Canada’s job market recovery remains patchy, with unemployment elevated and wage growth cooling.
Oil Prices: Recent volatility in crude undermines CAD, which typically benefits from higher energy prices.
Macro Context
Interest Rate Expectations: Fed holding rates steady longer, BoC facing pressure to ease further if labor market slack persists.
Economic Growth Trends: US growth remains steady, Canada showing signs of stagnation.
Commodity Flows: Oil fluctuations weigh directly on CAD; weaker demand outlook adds to downside risk.
Geopolitical Themes: Global tariff disputes and risk aversion support USD safe-haven flows at the expense of CAD.
Primary Risk to the Trend
A sharp rebound in oil prices or stronger-than-expected Canadian inflation data could strengthen CAD and cap USD gains.
Most Critical Upcoming News/Event
Canada CPI (Oct 22) will be critical for BoC expectations.
US CPI and Fed speeches remain key for dollar direction.
Leader/Lagger Dynamics
USDCAD is more of a lagger, reacting to USD moves and oil-driven CAD flows. It follows broader USD direction but can influence CAD crosses like CADJPY and EURCAD.
Key Levels
Support Levels:
1.3930 (short-term support)
1.3842 (structural support)
Resistance Levels:
1.4035 (near-term resistance)
1.4147 (major target)
Stop Loss (SL): 1.3842
Take Profit (TP): 1.4147
Summary: Bias and Watchpoints
USDCAD bias is bullish, with buyers defending support and positioning for another leg higher. The fundamental backdrop of a stronger USD and weaker CAD underpins the move, with oil prices adding a bearish weight to the Canadian dollar. The setup looks favorable for continuation toward 1.4147, provided support at 1.3930 holds. Stop loss sits at 1.3842 to protect against a deeper correction, while the take profit is set at 1.4147. The pair remains a lagger, following USD strength and oil dynamics, making US and Canadian inflation data the most important watchpoints ahead.
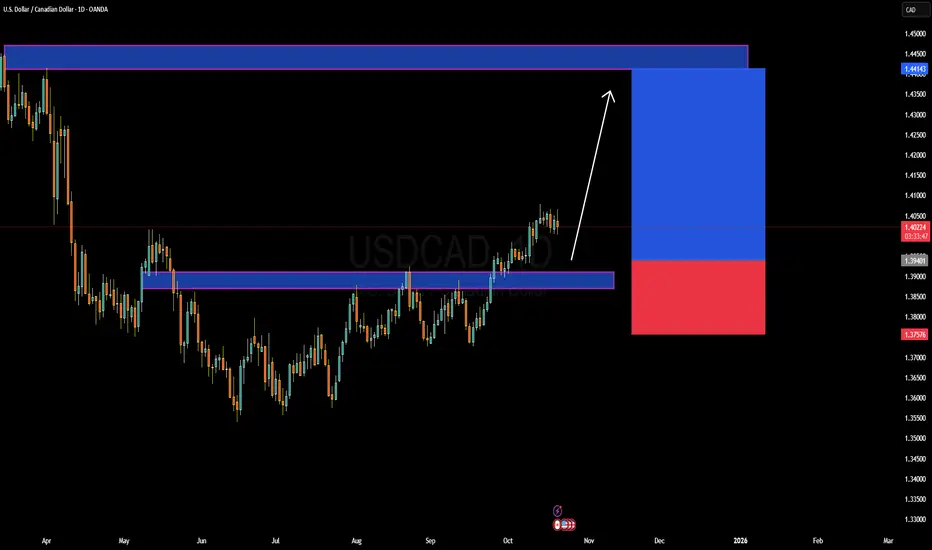
USD/CAD Can we get to $1.50?? I think so Here is a quick analysis on what we are seeing with USD/CAD
Level 1: 1.40
Level 2: 1.43
Level 3: 1.50
Where do you think USD/Cad will go put your comments below
Kris
Trade Smarter Live Better

USDCAD Bullish Trade IdeaTrend: Bullish
Divergence: None
Continuation Pattern: Bullish Rectangle
Reversal Pattern: None
Bias:Bullish
Scenario:Buy at Rnage Breakout
Trade Plan
Stop Loss 1.392
Entry Level 1.4001
TP1 1.4070

USD/CAD Bullish Heist Plan – Will You Join the Crew?💼💸 USD/CAD "The Loonie" – Bullish Vault Heist Plan 🕶️📈
"Layer the Entry. Stack the Cash. Escape Clean."
🧠 Mastermind Setup (Thief Trader Blueprint)
🔍 Asset: USD/CAD – The Loonie (Forex Market)
📜 Plan: Bullish — Thief is moving in with precision layering strategy.
📈 Entry Plan:
Thief’s not kicking the door once—he’s picking multiple locks!
Layer those buy limits for stealth entries:
(1.37700) 🏦 | (1.37500) 💰 | (1.37300) 🔑 | (1.37000) 🚪
💡 Add more layers if the vault’s deeper than expected.
🛑 Stop Loss (SL):
🎯 Official Thief SL parked @ 1.37000.
But remember—OG thieves adjust SL to match their risk appetite & personal strategy.
🎯 Target: 1.38680 – Grab the loot and vanish!
📢 Heist Intel (Market Context)
USD/CAD is eyeing upside momentum, powered by USD strength + oil price plays.
Expect pullbacks before the real breakout—perfect for layered infiltration.
⚠️ Thief’s Street Rules:
Don’t enter during high-impact news — guards will be on alert.
Use trailing stops to protect the loot once in profit.
Layer patiently—don’t rush the vault door.
💣 Final Words from the Crew:
Every pip is a coin in the bag. Stay disciplined, stay layered, and leave no trace. 🐱👤💎
💖 Boost the plan, share with the crew, and let’s make this Loonie Heist legendary. 🚀💼

USD/ CAD) Bullish Analysis Read The captionSMC Trading point update
Technical analysis of USD/CAD (1H timeframe) chart analysis:
---
Bullish USD/CAD Setup
Support Zone: Price is respecting the support level (yellow box around 1.3920 – 1.3930).
Moving Averages:
50 EMA (red) is below current price, providing short-term bullish support.
200 EMA (blue) is also trending upward, confirming overall bullish bias.
Market Structure: Higher highs and higher lows suggest continuation to the upside.
Projection: Price is expected to bounce from the support zone and push toward the next resistance/target.
---
Target Point
1.3998 (near 1.4000 psychological level).
This aligns with the measured move projection from the last impulsive rally.
Mr SMC Trading point
---
Trading Idea
Bias: Bullish.
Entry Zone: Around 1.3920 – 1.3930 (support level retest).
Target: 1.3998.
Invalidation: A sustained break below 1.3900 would invalidate the bullish scenario.
---
Please support boost 🚀 this analysis

USDCAD Bulls Building Momentum as Loonie WeakensUSDCAD has bounced strongly from recent lows, with buyers regaining control and pushing the pair toward key resistance levels. The move reflects a combination of weaker Canadian fundamentals and resilient USD demand. With oil prices under pressure and the Bank of Canada leaning dovish, the stage looks set for USD strength to continue pressing higher against the CAD.
Current Bias
Bullish – price structure favors further upside toward resistance.
Key Fundamental Drivers
Federal Reserve: While the Fed is moving toward gradual easing, safe-haven demand and inflation risks from tariffs keep the dollar supported.
Bank of Canada: Markets price a high probability of another BoC rate cut, reflecting weak labor market data and slowing growth.
Oil Prices: Crude remains soft near the low $60s, weighing directly on the CAD as energy exports weaken.
Macro Context
Interest Rates: The Fed is cautious but still less dovish than the BoC, creating policy divergence that favors USD.
Economic Growth: Canada’s GDP contracted in Q2, and labor data confirms rising unemployment; meanwhile, the U.S. economy, though slowing, is relatively stronger.
Commodity Flows: Oil remains CAD’s key driver, and falling prices keep downside pressure on the currency.
Geopolitics: U.S. tariffs on Canadian auto parts and broader trade uncertainty add extra headwinds for Canada.
Primary Risk to the Trend
A sharp rebound in oil prices or surprisingly hawkish comments from the BoC could reverse the bullish momentum.
Most Critical Upcoming News/Event
Canada GDP and employment reports
U.S. PCE inflation data
BoC policy meeting outlook
Leader/Lagger Dynamics
USDCAD often acts as a lagger to oil moves, with crude leading sentiment on CAD. However, in times of strong USD demand, USDCAD can act as a leader for CAD crosses like CADJPY and AUDCAD.
Key Levels
Support Levels: 1.3738, 1.3668
Resistance Levels: 1.3826, 1.3891
Stop Loss (SL): 1.3668 (below recent swing support)
Take Profit (TP): 1.3826 (first target), extension to 1.3891
Summary: Bias and Watchpoints
USDCAD carries a bullish bias, supported by weaker Canadian data, softer oil prices, and dovish BoC expectations. A stop loss below 1.3668 protects against downside risks, while targets at 1.3826 and 1.3891 keep focus on upside continuation. Watch Canadian GDP and employment data closely, alongside U.S. PCE inflation, as key catalysts. The pair remains reactive to oil prices but could act as a leader for CAD crosses if USD strength dominates.

USDCAD Breakout Watch: Bulls Eye 1.3920 After Retesting SupportUSDCAD is coiling for a potential breakout, with buyers defending the 1.3820–1.3840 support zone and eyeing higher levels. The chart shows repeated higher lows, and fundamentals are aligning in favor of the dollar as the Canadian side faces pressure from weaker data and oil volatility. The setup is building momentum for a push toward 1.3920 if the breakout materializes.
Current Bias
Bullish – USD strength and Canadian headwinds support upside continuation.
Key Fundamental Drivers
Federal Reserve: Slower pace of cuts compared to expectations keeps USD attractive.
Bank of Canada: Market pricing leans heavily toward further easing after weak jobs data and slowing growth.
Oil Prices: WTI struggles below $65, weighing on CAD’s commodity-linked appeal.
Trade balance: Canada’s recent deficits add to pressure on CAD.
Macro Context
Interest rates: Fed cautious on cuts; BoC more dovish, widening policy divergence.
Economic growth: Canadian economy showing contraction in GDP and weaker labor data, while US growth remains firmer.
Commodity flows: Oil demand remains uncertain, keeping CAD on the defensive.
Geopolitical: Trade tensions and US tariffs add to USD safe-haven appeal, further denting CAD sentiment.
Primary Risk to the Trend
A strong oil rebound or a surprisingly hawkish BoC stance could support CAD and limit upside in USDCAD.
Most Critical Upcoming News/Event
Canada CPI and BoC decision – key for confirming further CAD weakness.
US CPI and Fed communication – will guide whether USD keeps its bid.
Leader/Lagger Dynamics
USDCAD often acts as a lagger to broad USD moves (particularly following EURUSD and DXY). However, it can lead CAD crosses like CADJPY and AUDCAD when oil-driven moves accelerate.
Key Levels
Support Levels: 1.3820, 1.3785
Resistance Levels: 1.3880, 1.3920
Stop Loss (SL): 1.3785 (below structural support)
Take Profit (TP): 1.3920 (major resistance zone)
Summary: Bias and Watchpoints
USDCAD is consolidating with buyers eyeing an upside breakout. The bias remains bullish, with SL at 1.3785 protecting against downside failure and TP at 1.3920 offering a clean upside target. The divergence between a cautious Fed and a dovish BoC, combined with oil weakness, tilts the balance in favor of USD strength. The key watchpoints are Canada’s CPI and BoC policy direction, which could either accelerate the breakout or disrupt the setup.
USD/CAD) Bullish trend analysis Read The captionSMC Trading point update
Technical analysis of USD/CAD in the 4H timeframe. Here’s the behind the analysis:
---
Key Technical Points:
1. FVG (Fair Value Gap):
The yellow box around 1.3820–1.3830 is a fair value gap where price is expected to retrace before continuing upward.
Acts as a short-term demand zone.
2. MSS (Market Structure Shift):
The chart marks a bullish MSS, meaning structure has flipped from bearish to bullish.
Confirms upside continuation bias.
3. EMA 200 (Dynamic Support):
EMA 200 sits around 1.3797, below current price.
Reinforces the bullish bias as long as price stays above it.
4. Target Point:
Upside target is 1.3925, which aligns with previous highs / liquidity zone.
Chart suggests accumulation → retrace → bullish expansion into that level.
---
Trade Idea Summary:
Bias: Bullish
Scenario:
1. Price may retrace into the FVG zone (1.3820–1.3830).
2. Find support there and bounce.
3. Continue higher toward 1.3925 target point.
Entry Idea: Buy near the FVG demand zone (with bullish confirmation).
Target: 1.3925
Stop-Loss: Below the EMA / FVG (~1.3790).
Mr SMC Trading point
---
Conclusion:
This setup favors buying dips into the FVG zone as long as price respects the EMA 200. The target is 1.3925, making this a bullish continuation play after the recent market structure shift.
---
Please support boost 🚀 this analysis

USDCAD Double Top Signals a Potential BreakdownUSDCAD pair is testing a critical resistance area near 1.3830 after a strong rebound. But the price structure is beginning to flash signs of exhaustion. With repeated rejections and a clear double-top pattern forming, the setup favors a bearish move. If momentum turns, we could see a meaningful correction toward the 1.3730 support zone, with deeper downside risk into mid-September.
Current Bias
Bearish rejection at resistance, structure favors downside continuation.
Key Fundamental Drivers
Canada: Weak August jobs report (unemployment 7.1%, wages cooling) raised BoC cut expectations, pressuring CAD. But oil prices (Brent ~$65) limit the downside risk, giving CAD some commodity support.
U.S.: Weaker jobs (+142k NFP, unemployment 4.3%) keeps Fed cuts on the table, capping USD upside. Core PCE sticky at 2.9%, but inflation trend is moderating.
Macro Context
Interest Rates: Fed expected to cut in coming months; BoC markets price ~90% chance of a September cut.
Economic Growth: U.S. slowing but still resilient, Canada contracting (Q2 GDP −0.4% q/q).
Commodities: Oil’s soft rebound provides CAD with some stability.
Geopolitics: Trade tensions (U.S. tariffs, China-Russia bond coordination) keep USD supported as a defensive hedge.
Primary Risk to the Trend
A sharp oil sell-off would weaken CAD and trigger USD/CAD upside.
U.S. CPI surprise to the upside could reprice Fed expectations, boosting USD.
Most Critical Upcoming News/Event
U.S. CPI (this week): Will decide Fed cut timing.
BoC September rate decision: High probability of a cut, market focus on forward guidance.
Leader/Lagger Dynamics
USD/CAD is typically a lagger — following USD direction (via Fed expectations) and CAD flows (via oil). It often mirrors oil price action and diverges from USD/JPY, reflecting risk sentiment shifts.
Key Levels
Support Levels: 1.3732, 1.3585
Resistance Levels: 1.3830, 1.3875
Stop Loss (SL): 1.3875
Take Profit (TP): 1.3732 (first), 1.3585 (extended)
Summary: Bias and Watchpoints
USD/CAD is leaning bearish after failing to break cleanly above 1.3830. Fundamentals point to a tug-of-war between dovish BoC expectations and weaker U.S. data, but the chart structure favors downside into 1.3732 and potentially 1.3585. My stop loss sits above 1.3875 to protect against a breakout. Watch U.S. CPI as the key driver: a hotter print could revive USD strength, while a softer read could accelerate CAD gains. Oil’s stability remains a secondary but important factor for CAD resilience.

USD/CAD – Bulls Eyeing a Bounce from Key Demand ZoneAfter an aggressive correction from the 1.3920 highs, USD/CAD has now landed on a heavy demand zone near 1.3720 – 1.3740. This area has proven to be a launchpad for rallies in recent weeks, and price is once again testing buyers’ conviction. With both technical structure and macro fundamentals in play, this zone could determine the next major swing.
Current Bias
Bullish bias as long as 1.3720 holds, with upside potential toward 1.3818 and 1.3920 supply.
Key Fundamental Drivers
USD: Supported by sticky inflation (Core PCE 2.9% y/y) and resilient consumer spending (+0.5% m/m). Fed rate cut expectations have softened, keeping the dollar supported.
CAD: Weighed down by weaker Canadian GDP (Q2 annualized -1.6%, q/q -0.4%) and slowing momentum in domestic growth. Oil remains weak near $64, offering little support to the loonie.
Macro Context
Rates: The Fed remains cautious with cuts, while the BoC faces pressure from economic contraction. Interest rate divergence favors the USD.
Growth Trends: US growth remains firmer compared to Canada’s slowdown.
Commodities: Oil’s weakness is a drag on CAD, making the currency vulnerable.
Geopolitics: Ongoing tariff disputes and Middle East energy risks keep USD demand steady as a safe haven, further weighing on CAD.
Primary Risk to the Trend
A deeper selloff in USD on unexpected Fed dovishness or a sharp rebound in oil prices (driven by geopolitical shocks or supply cuts) could strengthen CAD and invalidate the bullish setup.
Most Critical Upcoming News/Event
US ISM PMI & NFP (this week): Key drivers for Fed policy path.
Canada Jobs Report (Friday): Critical for CAD sentiment after the weak GDP print.
Leader/Lagger Dynamics
USD/CAD tends to lag oil and broader USD moves. It often follows the dollar’s momentum, while oil price shocks can lead moves on CAD. Currently, the pair is USD-led, making it more reactive to Fed data than Canadian domestic flows.
Key Levels
Support Levels: 1.3720 – 1.3740 (demand zone), 1.3660.
Resistance Levels: 1.3818 (mid-resistance), 1.3918 – 1.3925 (major supply).
Stop Loss (SL): 1.3650 (below demand zone invalidation).
Take Profit (TP): 1.3818 (first target), 1.3920 (extended target).
Summary: Bias and Watchpoints
USD/CAD is sitting at a key demand zone around 1.3720 – 1.3740, where buyers need to defend the trend. The bias remains bullish above this level, with upside targets at 1.3818 and 1.3920. A break below 1.3650 would invalidate the long setup and expose further downside. With US data in focus and CAD weighed down by weak GDP and soft oil prices, the pair is more likely to follow USD momentum in the near term. Traders should watch NFP and Canada’s jobs data closely, as these will dictate whether this bounce carries to new highs or fades into deeper consolidation.

USD/CAD - Bullish Pennant (04.09.2025)The USD/CAD pair on the M30 timeframe presents a Potential Buying Opportunity due to a recent Formation of a Bullish Pennant Breakout Pattern. This suggests a shift in momentum towards the upside and a higher likelihood of further advances in the coming hours.
Possible Long Trade:
Entry: Consider Entering A Long Position around Trendline Of The Pattern.
Target Levels:
1st Resistance – 1.3835
2nd Resistance – 1.3853
🎁 Please hit the like button and
🎁 Leave a comment to support for My Post !
Your likes and comments are incredibly motivating and will encourage me to share more analysis with you.
Best Regards, KABHI_TA_TRADING
Thank you.
Disclosure: I am part of Trade Nation's Influencer program and receive a monthly fee for using their TradingView charts in my analysis.
