USDCAD Bullish PotentialThe bullish continual Flag pattern price breaks the resistance line and closes the price above
Usdcadlong

USDCAD BUY CHANCE FROM THE CURRENT PRICE we see a nice buy chance on USDCAD from the current price .
TP & SL are shown on the chart
use proper risk management

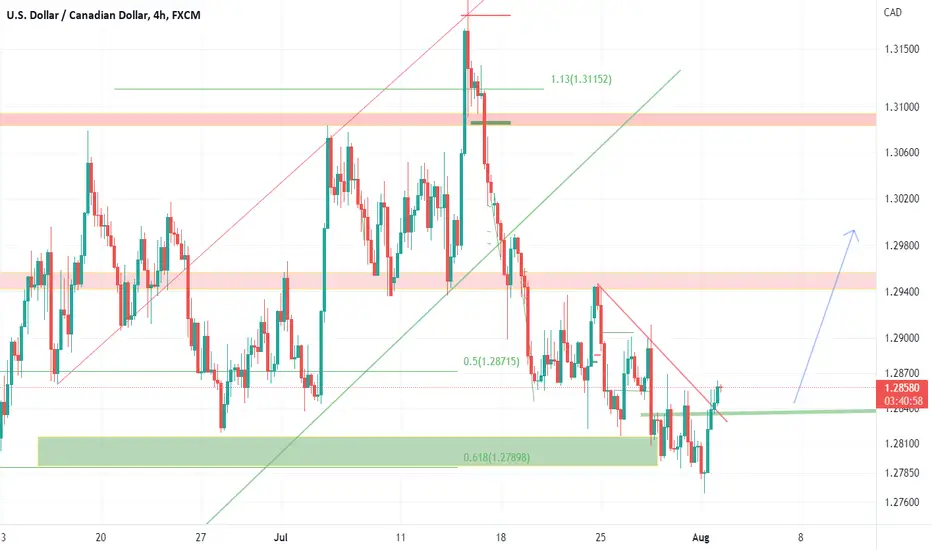
movement of usdcadI think this support is strong and the next move will be up
Of course, it reacts to the upcoming resistances that i show them
USDCAD H4: Bearish outlook seen, reversal below 1.2890On the H4 time frame, prices are approaching the resistance zone at 1.2890, in line with the Fibonacci confluence levels where we could see further downside below this zone to the intermediate support target at 1.2780 which coincides with the graphical support. A break below the 1.2780 intermediate support target could provide the bearish acceleration to the support area at 1.2680. Prices are holding below the Ichimoku cloud indicator as well, supporting the bearish bias.

USDCAD - Daily Trade Idea - 2-Aug-22USDCAD (LONG)- If all the support holds in place.
If we see the Support broken out then we could see the shift in the trend.
I marked the TP 1, TP 2 , TP 3 and EXIT (SL) on the chart.
(THIS IDEAS VALID NEXT 24 HOURS)
Please note this is only the Trade Idea base on S & R and not a signal, the market can react differently during the session and only enter if we have the final confirmation for entry.

2X UCAD 1D Tech. Analysis!Possible falling wedge reversal on USDCAD 4HR/1Day! We will WAIT PATIENTLY for this reversal. USDCAD is coming out of a bearish triangle (WEEKLY) with a fake brakout to the upside to test the (MONTHLY) OB @1.32000 area. It has broken the short-term bull trendline and seems to be creating a HEAD & SHOULDERS pattern on the DAILY! We will play the Right shoulder Buy formation, and then play the Sell of the Right shoulder going down!

USDCAD LONG- Tested LL for the last month
- Not able to break the support
- Bullish candles were formed
- Bullish AB=CD harmonic pattern was formed

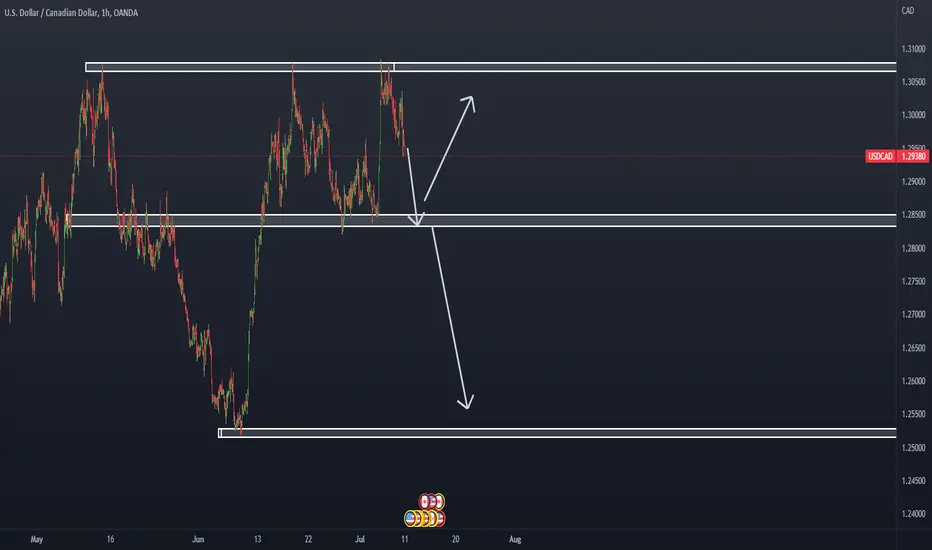
USD/CAD Analysis for next movePrice is expected to fall as already made triple-top, but if the price reverses from the support he it will fail the pattern and still can go up.
USD/CAD Long IdeaHello Traders
USD/CAD is possibly moving up.
Here is why:
1- Price is moving inside of falling wedge(Reversal pattern).
2- We can see RD+ in RSI indicator, showing us a possible trend reversal.
3- Strong support zone in 1.27900 -1.27500.
Invalidation: IF price breaks and stays below 1.275.
If you like it then Support us by Like, follow and share.
Thanks For Reading
Team Fortuna
-RC
(Disclaimer: Published ideas and other Contents on this page are for educational purposes and does not include financial recommendation. Trading is Risky, so before any action do your own research.)

USDCAD Long Trade IdeaThere's been a long trade opportunity on the dollar-loonie trading chart, following the fake breakout of the price below the 1.28194 horizontal support level.
This signals a buy because of the bullish harami candlestick pattern; with the bullish candle closing above the same support level.
You can enter the trade around the 1.28294 price level and set your stop below the fakeout candles. Your profit target can be anywhere between your entry price and the 1.32000 psychological level.
Have fun trading!

USDCAD M30: Bearish outlook seen, potential reversal on pullbackOn the M30 time frame, prices are holding below the descending channel where a pullback to the resistance zone at 1.2870, in line with the 61.8% Fibonacci retracement presents an opportunity to play the drop to the support target at 1.2780. This support zone lines up with the -27.2% Fibonacci retracement and descending channel’s support. Failure to hold below the 1.2780 resistance zone could see prices push higher to test the resistance zone at 1.2910. Prices are holding below the Ichimoku cloud as well, supporting the bearish bias.

Outlook on USDCAD: Bearish play seen On the H4 time frame, prices are facing bearish pressure from its resistance zone at 1.28500 in line with the 61.8% Fibonacci extension and a pullback to this zone presents an opportunity to play a further drop to the next support target at 1.26800. This support target lines up with the 78.6% Fibonacci retracement and 100% Fibonacci extension. Ichimoku cloud is also showing signs of bearish pressure, in line with our bearish bias.
USDCAD - Daily Trade Idea - 27-Jul-22USDCAD (LONG)- If all the support holds in place.
If we see the Support broken out then we could see the shift in the trend.
I marked the TP 1, TP 2 , TP 3 and EXIT (SL) on the chart.
(THIS IDEAS VALID NEXT 24 HOURS)
Please note this is only the Trade Idea base on S & R and not a signal, the market can react differently during the session and only enter if we have the final confirmation for entry.


⁉️ USDCAD - Market AnalysisHello traders!
⁉️This is my analysis on USDCAD .
Here we are in a bullish market structure, so I am looking only for longs. I expect the price to continue the retracement to fill the imbalances and if the price rejects from bullish orderblock + institutional figure 1.26000 I will open a long position.
Like, comment and subscribe to be in touch with my content!

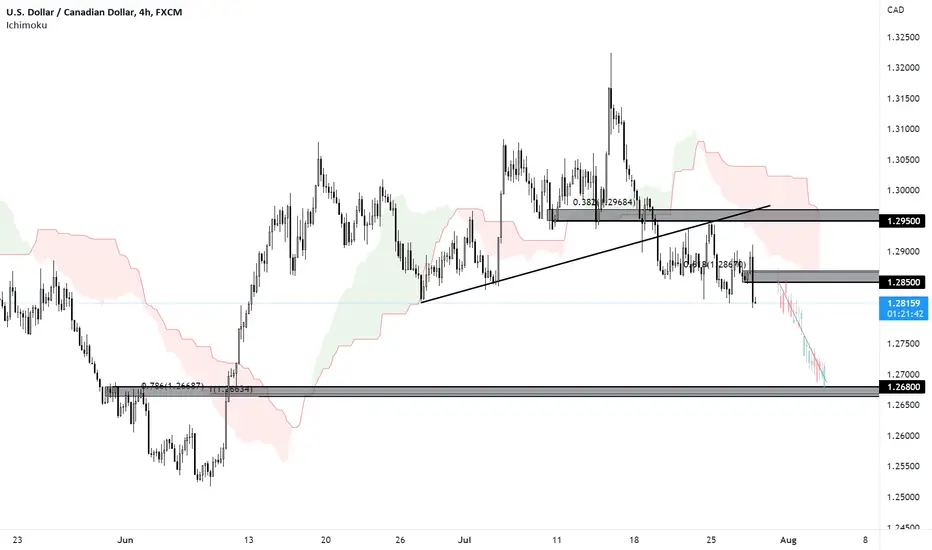
USDCAD H4: Bearish outlook seen, further downside below 1.2820On the H4 time frame, prices are facing bearish pressure from the resistance zone at 1.2950 which coincides with the graphical support-turned-resistance zone and 38.2% Fibonacci retracement with further downside risks seen. A break below the intermediate support level at 1.2820 would provide the bearish acceleration to our support zone at 1.2680. Ichimoku cloud is showing signs of pressure as well supporting the bearish bias.
