USDCAD = BearishHi fellow traders, look for more downside on USDCAD as the correction has completed and oil is ready to move higher. Goodluck!
Usdcadsetup

USDCAD ( IT'S ALL ABOUT SNIPER ENTRY)Break of structure for potential downside movement , worse scenario is when price violates and continue to the upside due to higher tf point of interest above that are likely to be tested { we might extend the sl for the safety just depends on how price will react }


USDCAD SHORT TRADE UPDATESo hopefully some of you guys may be in this trade, as expected price is pushing down and looking like we may see a deeper pull back to go with the overall uptrend or possibly making a reversal for some further downside. Even though I'm not in the trade I will update later in the week.

USDCAD SHORTS TAKENHoping to see another much needed deeper pull back or possible trend change on USDCAD, I've just entered and like I said moving stops to entry point as soon as a few pips in profit as I'm not forgetting the overall 4hr uptrend!


USDCAD STILL HOLDING SHORTS UPDATE!Firstly I apologies for my voice I'm currently trying not to lose it LOL, anyway I've still got my short trade open but moving stops to breakeven, we seen price get a bit choppy Friday and I do expect weakness from the dollar... so a sell off or push down on USDCAD I feel is coming, the hard part is getting the best position with the lest risk. Ill monitor price at the start of the week and if I get stopped at break even I will start to map out next short areas.

USD/CAD 4HR CHART BUY SET UPHi everyone this is my trade set up for the USD/CAD for the new week ahead
USD/CAD i think will push higher i am expecting a pullback to the order block zones and will be looking for a buy trade
look for pullback to zones lined off on chart then if it meets your criteria for a trade then execute
This is my analysis only please trade with caution and risk management in place
good luck for this weeks trading
please like and comment both are welcome

USDCAD SHORT TRADES Looking at catching the pullback move back down to atlest 1.25400, we are still in an overall 4 hr uptrend so make sure if you do enter and go into profit, move those stop losses to breakeven pretty quickly.

USDCAD H1 BUYWe have 4 hours of Hayden Diver positive material. The price is above the uptrend line and the pullback is over Therefore, the price rises to the previous ceiling after crossing the specified line

USD/CAD CHART4HR SELL SET UPHi everyone this is my trade set up for the USD/CAD for the new week ahead
USD/CAD i think will push higher i am expecting a pullback to the order block zones and will be looking for a buy trade
look for pullback to zones lined off on chart then if it meets your criteria for a trade then execute
This is my analysis only please trade with caution and risk management in place
good luck for this weeks trading
please like and comment both are welcome

USDCAD is likely to breakdown!!Hello traders, USDCAD has tested the long-term trend line as resistance and rejected to the downside. This weekly price has opened with a gap and it is highly likely that this instrument may break to the downside.


Is the channel going to hold for the USDCAD?The dollar cad tested the bottom of the channel like we predicted and moved up higher, it has now tested the top of the channel and faced some rejection, are we going to see a break out?
BEAR CASE
Until proven otherwise, our bias is to the downside. We expect to see it test the bottom of the channel once more and if it faces rejection there or before there, we know a major upmove is coming for this pair.
BULL CASE
If a breakout happens, we're targeting 127 to put up some resistance.
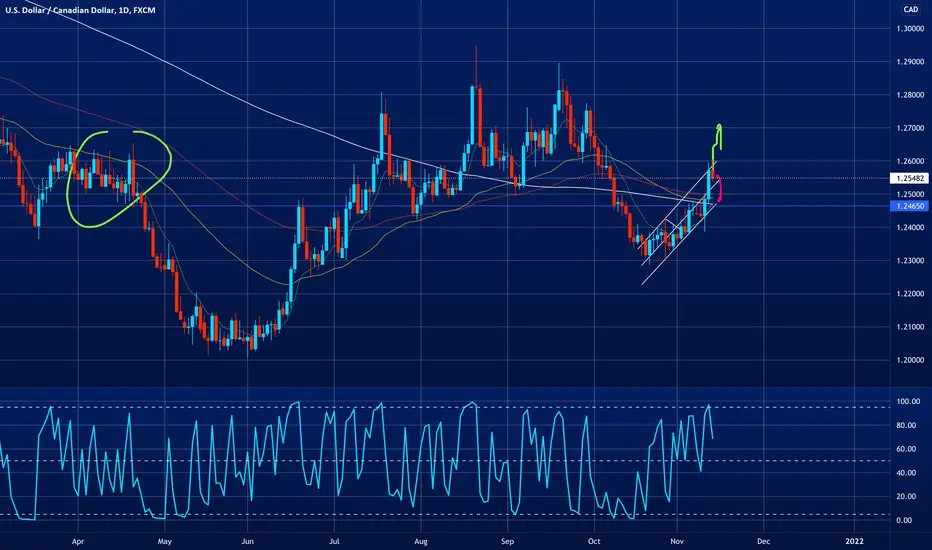

Potential cup and handle formation on daily (USDCAD)Pair: USDCAD
Timeframe: Daily
Position: N/A
Sentiment: Bullish
TLDR: Cup and handle formation on USDCAD. Looking for long above 1.2495 level given proper handle structure to 1.2800 (previous level of supply).
Outlook: Pair has been in a downtrend, but a recent move in the middle of June looked to reverse the trend. Looking back at that move, we can see there appeared to be a cup and handle formation that led to a sizable rally. Using the previous pattern as reference, we can look to the most recent set of daily candles and see a somewhat, albeit smaller, cup-like shape forming. Combine the pattern with relative strength in the general dollar, and the recent selloff of oil and we could either see a strong breakout, therefore creating a short handle and strong move to the upside. Or consolidation creating a proper handle, then a move to the upside.
Things to keep in mind:
- We are still under the 200EMA, which could provide resistance. Price could also drag along to meet with the 200EMA and start forming a handle from there.
- Dollar strength could slow down and oil could have a resurgence thus shifting the power dynamic between USD pairings.
Key numbers:
I'll be looking at using this point or the area around it to establish a long position should the proper handle structure present itself.
This is where I expect the bottom of the handle formation to be. While this is an area of interest that could serve to invalidate the trade, this will not be where I place my stop.
Is where I will most likely place a stop. I want to give the potential handle formation some breathing room. Adjust position size accordingly to account for risk levels.
TP1. I would want to see any successful cup and handle pattern to return to the previous supply areas.
TP2. I don't necessarily think a move to this area would be smooth or quick. But, I would still keep this area in mind should the cup and handle properly form.
Timeframe: This is a longer term trade. Should a successful cup and handle pattern form, it's probable the trade takes anywhere from 20 to 60 days to complete. However, things usually don't go as planned, so it will be more important to simply follow and listen to the price action, volume, patterns, and key areas.
Disclaimer : This content is for informational purposes only, you should not construe any such information or other material as legal, tax, investment, financial, or other advice. Nothing contained in this post constitutes a solicitation, recommendation, endorsement, or offer by cprice253 to buy or sell any securities or other financial instruments in this or in in any other jurisdiction in which such solicitation or offer would be unlawful under the securities laws of such jurisdiction.

USDCAD ready for next upside push??Been a bit of a slow start to the week but we are now starting to shape some possible new moves, one of them been a possible continuation on USDCAD. Ill be waiting for more rejection out of 1.24000 area before taking longs. As always risk manage and keep to that trading plan!!

USD/CAD:PRICE ACTION | NEW BEARISH SETUP READY...The DXY index continues to rise and the USD/CAD pair retreated again after the US Non-Farm Payrolls surpassed expectations and the US dollar rose to daily highs.
Welcome back Traders, Investors, and Community!
Check the Links on BIO and If you LIKE this analysis, Please support our Idea by hitting the LIKE 👍 button
Traders, if you like this idea or have your own opinion about it, please write your own in the comment box . We will be glad for this.
Feel free to request any pair/instrument analysis or ask any questions in the comment section below.
Have a Good Day Trading !

USDCAD Is Heading Lower In Wave (v) of CUSDCAD decline from wave B high is taking the shape of Elliott Wave five-wave impulse pattern.
The corrective sequence within the impulsive decline follows the EW alternation guideline. Wave (ii) was a sharp correction that retraced 61.8% of wave (i) and wave (iv) is a complex correction and has retraced 38.2% of wave (iii).
Price is expected to head lower in wave (v) to complete the five-wave sequence in wave C.
Other Confluences:
- Price is retesting daily bearish order block (supply zone)
- Price is rejecting daily 50 EMA as dynamic support (not shown on chart)
- Doji at the supply zone
What's your view on USDCAD? Let me know in the comment.
Thanks.

why is dollar still falling even though NFP report came out goodwe are going to discuss this in the future. meanwhile, here are the trades im in at the moment.

USDCAD will get choppy!Like I've been explaining I think we will get an upside rally on USDCAD its just a matter of getting a good entry point, as mention there will be some impactful data in under 2 hours so be careful!! ill be taking a look at price over the weekend for setups leading into next week, I never place trades before any uncertain times (news/data events) its a straight gamble and I'm here for the highest probable situations..

USDCAD SHORTS TAKEN!USDCAD I've taken a short position risking ONLY 1%, I'm looking at targeting around 1.23200 where ill be looking for possible long trades depending on price action.
