USDCAD— FRGNT DAILY CHART FORECAST. Q1 | W4 | D29 | Y26📅 Q1 | W4 | D29 | Y26
📊 USDCAD— FRGNT DAILY CHART FORECAST
🔍 Analysis Approach
I’m applying a developed version of Smart Money Concepts, with a structured focus on:
• Identifying Key Points of Interest (POIs) on Higher Time Frames (HTFs) 🕰️
• Using those POIs to define a clear and controlled trading range 📐
• Refining those zones on Lower Time Frames (LTFs) 🔎
• Waiting for a Break of Structure (BoS) as confirmation ✅
This process keeps me precise, disciplined, and aligned with market narrative, rather than reacting emotionally or chasing price.
💡 My Motto
“Capital management, discipline, and consistency in your trading edge.”
A positive risk-to-reward ratio, combined with a high-probability execution model, is the backbone of any sustainable trading plan 📈🔐
⚠️ On Losses
Losses are part of the mathematical reality of trading 🎲
They don’t define you — they are necessary, expected, and managed.
We acknowledge them, learn, and move forward 📊➡️
🙏 I appreciate you taking the time to review my Daily Forecast.
Further context and supporting material can be found in the Links section.
Stay sharp 🧠
Stay consistent 🎯
Protect your capital 🔐
— FRGNT 🚀📈
FX:USDCAD
Usdcadshort

TheGrove | AUDUSD Sell | Idea Trading AnalysisYou can expect a reaction in the direction of selling from the specified Resistance line
USDCAD moving higher as it tests the strong resistance level..
We expect a bearish move from the confluence zone.
Hello Traders, here is the full analysis.
I think we can soon see more fall from this range! GOOD LUCK! Great SELL opportunity USDCAD
I still did my best and this is the most likely count for me at the moment.
-------------------
Traders, if you liked this idea or if you have your own opinion about it, write in the comments. I will be glad 🤝

#USDCAD: +500 Pips Swing Sell Opportunity; One Not To Miss! Dear Traders,
The USDCAD pair is currently in a strong bearish trend and we anticipate a price correction. We expect the price to turn bullish in the short term, filling the liquidity gap it’s left behind. Once filled, the price could reverse and continue selling until it reaches around 1.3200, a 500+ pip move. Currently, there’s only one target, and the stop-loss can be adjusted based on your risk management.
The USD is plummeting, but there’s a chance it could show some bullish momentum. However, the CAD is experiencing a strong, continuous bullish trend, so we expect a correction.
If you enjoy our work, please like and comment. Also, follow us for updates whenever we post ideas.
Team Setupsfx_

USDCAD — FRGNT FUN COUPON FRIDAY Q1 | D23 | W3 | Y26📅 Q1 | D23 | W3 | Y26
📊 USDCAD — FRGNT FUN COUPON FRIDAY DAILY CHART FORECAST
🔍 Analysis Approach
I’m applying a developed version of Smart Money Concepts, with a structured focus on:
• Identifying Key Points of Interest (POIs) on Higher Time Frames (HTFs) 🕰️
• Using those POIs to define a clear and controlled trading range 📐
• Refining those zones on Lower Time Frames (LTFs) 🔎
• Waiting for a Break of Structure (BoS) as confirmation ✅
This process keeps me precise, disciplined, and aligned with market narrative, rather than reacting emotionally or chasing price.
💡 My Motto
“Capital management, discipline, and consistency in your trading edge.”
A positive risk-to-reward ratio, combined with a high-probability execution model, is the backbone of any sustainable trading plan 📈🔐
⚠️ On Losses
Losses are part of the mathematical reality of trading 🎲
They don’t define you — they are necessary, expected, and managed.
We acknowledge them, learn, and move forward 📊➡️
🙏 I appreciate you taking the time to review my Daily Forecast.
Further context and supporting material can be found in the Links section.
Stay sharp 🧠
Stay consistent 🎯
Protect your capital 🔐
— FRGNT 🚀📈
FX:USDCAD

USD/CAD: Elliott Wave Bearish BiasUSD/CAD is showing a bearish Elliott Wave structure on the 4H chart. Price appears to have completed a corrective Wave 2 near the 0.5–0.618 Fibonacci retracement zone, which is a common area for corrections to end. From there, the market has started to turn lower, suggesting the beginning of a new impulsive Wave 3 to the downside, which is usually the strongest bearish wave. As long as price stays below the recent swing high near the retracement zone, the bias remains bearish, with downside targets toward the 1.365–1.360 area. A move above the Wave 2 high would invalidate this count and delay the bearish scenario.
Stay tuned!
@Money_Dictators
Thank you :)

USD/CAD(20260121)Today's AnalysisMarket News:
The Polish central bank has approved a plan to purchase 150 tons of gold, increasing its gold reserves to 700 tons.
Technical Analysis:
Today's Buy/Sell Threshold:
1.3842
Support and Resistance Levels:
1.3906
1.3882
1.3866
1.3817
1.3802
1.3778
Trading Strategy:
Consider buying if the price breaks above 1.3842, with a first target price of 1.3866.
Consider selling if the price breaks below 1.3817, with a first target price of 1.3802.

USDCAD SHORTS - DXY MELTDOWNWe can see USDCAD has slowed down at 1.39196 with multiple failed attempts to break higher.
This coupled with the melting DXY i am anticipating USDCAD to go lower.
TP1: 1.37379
TP 2 : 1.38845

USD/CAD(20260119)Today's AnalysisMarket News:
President Trump vowed last Saturday to impose a series of escalating tariffs on EU member states Denmark, Sweden, France, Germany, the Netherlands, and Finland, as well as the UK and Norway, until the US is authorized to purchase Greenland. On March 17th, Trump announced on social media that a 10% tariff would be imposed on goods imported from Denmark, Norway, Sweden, France, Germany, the UK, the Netherlands, and Finland starting February 1st, and declared that the tariff rate would increase to 25% from June 1st, until the parties reach an agreement on the US's "full and complete purchase of Greenland."
Technical Analysis:
Today's Buy/Sell Threshold:
1.3909
Support and Resistance Levels:
1.3953
1.3936
1.3926
1.3892
1.3881
1.3865
Trading Strategy:
If the price breaks above 1.3926, consider buying with a first target price of 1.3953.
If the price breaks below 1.3909, consider selling with a first target price of 1.3892.


USD/CAD(20260115)Today's AnalysisMarket News:
Daniel Casali, investment strategy partner at UK wealth management firm Evelyn Partners, said on Tuesday that his team is optimistic about both gold and silver. He pointed out that the uncertainty caused by events such as the outbreak of the Russia-Ukraine conflict in 2022 and US President Trump's announcement of so-called "Liberation Day" tariffs last April continues to support gold prices. As major world powers continue to diversify their trade war tactics, Casali stated that an atmosphere of "resource nationalism" is forming, continuously driving the precious metals market higher. In the first week of 2026, the US forcibly took control of Venezuelan strongman Maduro, while the White House hinted at possible military action to control Greenland. These actions exacerbated political risks and further strengthened the uncertainty supporting rising precious metal prices. Casali stated, "The current geopolitical game is complex, but the core conclusion is that resource nationalism will drive up gold and silver prices."
Technical Analysis:
Today's Buy/Sell Threshold:
1.3880
Support and Resistance Levels:
1.3912
1.3900
1.3892
1.3868
1.3861
1.3849
Trading Strategy:
If the price breaks above 1.3880, consider buying, with a first target price of 1.3900.
If the price breaks below 1.3868, consider selling, with a first target price of 1.3849.

USDCAD Short Ideathis pair has formed an ascending channel on H1 timeframe
now we're waiting for a momentum candle to close below the last touch of the channel so we can enter a sell trade
Follow us for more idea or trades

USDCAD — FRGNT FUN COUPON FRIDAY DAILY CHART FORECAST📅 Q1 | D9 | W1 | Y26
📊 USDCAD — FRGNT FUN COUPON FRIDAY DAILY CHART FORECAST
🔍 Analysis Approach
I’m applying a developed version of Smart Money Concepts, with a structured focus on:
• Identifying Key Points of Interest (POIs) on Higher Time Frames (HTFs) 🕰️
• Using those POIs to define a clear and controlled trading range 📐
• Refining those zones on Lower Time Frames (LTFs) 🔎
• Waiting for a Break of Structure (BoS) as confirmation ✅
This process keeps me precise, disciplined, and aligned with market narrative, rather than reacting emotionally or chasing price.
💡 My Motto
“Capital management, discipline, and consistency in your trading edge.”
A positive risk-to-reward ratio, combined with a high-probability execution model, is the backbone of any sustainable trading plan 📈🔐
⚠️ On Losses
Losses are part of the mathematical reality of trading 🎲
They don’t define you — they are necessary, expected, and managed.
We acknowledge them, learn, and move forward 📊➡️
🙏 I appreciate you taking the time to review my Daily Forecast.
Further context and supporting material can be found in the Links section.
Stay sharp 🧠
Stay consistent 🎯
Protect your capital 🔐
— FRGNT 🚀📈
FX:USDCAD

USDCAD SWING TRADE 4H MARKET STRUCTURE Overall bias: 🔴 Bearish
Price was in a clear downtrend
Recent move is a pullback into a key supply / resistance zone

USDCAD📉 OANDA:USDCAD Technical Analysis (4H Timeframe)
The overall trend for USD/CAD has shifted to bearish, as the price is trading below the downward-sloping EMA 200 (black line) and has established a series of lower highs and lower lows 📉. The momentum was notably strong during the descent, characterized by large bearish candle bodies. Currently, the price is in a corrective phase (wave 5 of the recent leg), attempting a pullback toward the EMA 50 (red line). The EMA 50 is currently acting as immediate dynamic resistance. If the price fails to break above the 1.38270 USD level with conviction, we expect a continuation of the primary bearish trend toward the lower liquidity zones 🐻.
🔑 Key Levels to Watch:
Major Resistance Zone: 1.41400 USD (Primary Origin Grey Box) 🚩
Secondary Resistance: 1.39900 USD & 1.39000 USD (Grey Boxes) 🎯
Immediate Pivot Resistance: 1.38270 USD (Current Test Area) 💡
First Downside Target: 1.37320 USD (Recent Support / Grey Box) ⚡
Secondary Support Level: 1.36550 USD (Solid Black Line) 🛡️
Ultimate Demand Target: 1.35850 USD (Dashed Line) 📥

TheGrove | USDCAD buy | Idea Trading AnalysisUSDCAD is moving in an UP trend channel.
The chart broke through the dynamic Support line line
We expect a decline in the channel after testing the current level which suggests that the price will continue to rise
We expect a decline in the channel after testing the current level
Hello Traders, here is the full analysis.
I think we can soon see more fall from this range! GOOD LUCK! Great SELL opportunity USDCAD
I still did my best and this is the most likely count for me at the moment.
-------------------
Traders, if you liked this idea or if you have your own opinion about it, write in the comments. I will be glad ⚜️

USDCAD — FRGNT DAILY CHART FORECAST Q1 | D7 | W1 | Y26
📅 Q1 | D7 | W1 | Y26
📊 USDCAD — FRGNT DAILY CHART FORECAST
🔍 Analysis Approach
I’m applying a developed version of Smart Money Concepts, with a structured focus on:
• Identifying Key Points of Interest (POIs) on Higher Time Frames (HTFs) 🕰️
• Using those POIs to define a clear and controlled trading range 📐
• Refining those zones on Lower Time Frames (LTFs) 🔎
• Waiting for a Break of Structure (BoS) as confirmation ✅
This process keeps me precise, disciplined, and aligned with market narrative, rather than reacting emotionally or chasing price.
💡 My Motto
“Capital management, discipline, and consistency in your trading edge.”
A positive risk-to-reward ratio, combined with a high-probability execution model, is the backbone of any sustainable trading plan 📈🔐
⚠️ On Losses
Losses are part of the mathematical reality of trading 🎲
They don’t define you — they are necessary, expected, and managed.
We acknowledge them, learn, and move forward 📊➡️
🙏 I appreciate you taking the time to review my Daily Forecast.
Further context and supporting material can be found in the Links section.
Stay sharp 🧠
Stay consistent 🎯
Protect your capital 🔐
— FRGNT 🚀📈
FX:USDCAD

USDCADUSDCAD
- Completed " 1234 " Impulsive Waves
- Demand Zone
- Fibonacci Level - 38.20% / 50.00%
- Change of Characteristics
- Order Block

USDCAD, Potential sellWait for breakout below uptrend channel at H4, Price forming bearish flag and retrace fibo 61.8 to 70. key level for bearish reversal.

Q1 | W2 | Y26 USDCAD — FRGNT WEEK AHEAD FORECAST📅 Q1 | W2 | Y26
📊 USDCAD — FRGNT WEEK AHEAD FORECAST
🔍 Analysis Approach
I’m applying a developed version of Smart Money Concepts, with a structured focus on:
• Identifying Key Points of Interest (POIs) on Higher Time Frames (HTFs) 🕰️
• Using those POIs to define a clear and controlled trading range 📐
• Refining those zones on Lower Time Frames (LTFs) 🔎
• Waiting for a Break of Structure (BoS) as confirmation ✅
This process keeps me precise, disciplined, and aligned with market narrative, rather than reacting emotionally or chasing price.
💡 My Motto
“Capital management, discipline, and consistency in your trading edge.”
A positive risk-to-reward ratio, combined with a high-probability execution model, is the backbone of any sustainable trading plan 📈🔐
⚠️ On Losses
Losses are part of the mathematical reality of trading 🎲
They don’t define you — they are necessary, expected, and managed.
We acknowledge them, learn, and move forward 📊➡️
🙏 I appreciate you taking the time to review my Daily Forecast.
Further context and supporting material can be found in the Links section.
Stay sharp 🧠
Stay consistent 🎯
Protect your capital 🔐
— FRGNT MASTERY 🚀📈
FX:USDCAD

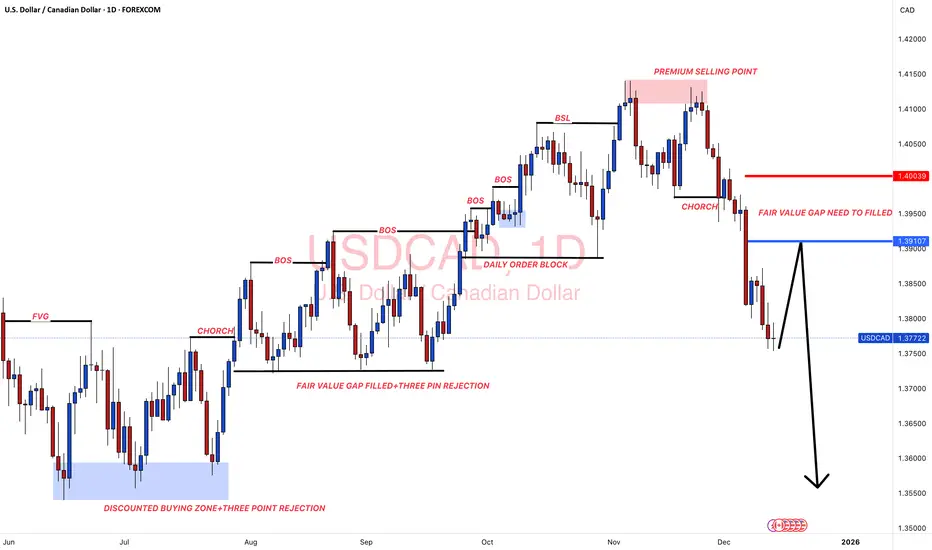
#USDCAD: A Perfect Selling Zone For The Week 15/12/2025Dear Traders,
Overview On USDCAD📈
🔺Price has left a great area of selling zone which need to be filled; we already have given an entry point and an exit point for you to identify the selling zone easily. USD is likely to show some minor bullish behaviour which will push the price of USDCAD to our point of interest.
🔺There is only one swing selling target that we currently have, this is not a long term trade instead or intraday trade.
Entry and Stop Loss Planning📊
🔺You must use your own knowledge to establish trading plan successfully, entry at the area as described in the chart only if it matches your bias.
🔺Use 'Red Line' as a exit point or as a stop loss also trade with accurate lot size based on your account.
🔺Take Profit Set at the 'Black Arrow' Ends.
Support and Encouragement ❤️🏆
If you like our idea then please like and comment which will encourage us to post such more ideas. Also share your views in the comment sections.
Tean Setupsfx_
USDCAD Bearish Breakout!
HI,Traders !
#USDCAD made a bearish
Breakout of the key
Horizontal level of 1.37376
And the breakout is confirmed
So we are bearish biased and
We will be expecting a
Further bearish continuation !
Comment and subscribe to help us grow !

USDCAD: +400 Pips Selling Opportunity!Overview🧠
The USDCAD currency pair has reversed and a potential change in trend is occurring. Confirmation is required before a sell entry can be made. The only take profit is a swing move with a potential gain of approximately 400 pips. The stop loss can be placed above the higher high. Please like and comment for more.
Team Setupsfx

USCAD FRGNT FUN COUPON FRIDAY -Q4 | W51 | D19 | Y25 |📅 Q4 | W51 | D19 | Y25 |
📊 USCAD FRGNT FUN COUPON FRIDAY
🔍 Analysis Approach:
I’m applying Smart Money Concepts, focusing on:
Identifying Points of Interest on the Higher Time Frames (HTFs) 🕰️
Using those POIs to define a clear trading range 📐
Refining those zones on Lower Time Frames (LTFs) 🔎
Waiting for a Break of Structure (BoS) for confirmation ✅
This method allows me to stay precise, disciplined, and aligned with the market narrative, rather than chasing price.
💡 My Motto:
"Capital management, discipline, and consistency in your trading edge."
A positive risk-to-reward ratio, paired with a high win rate, is the backbone of any solid trading plan 📈🔐
⚠️ Losses?
They’re part of the mathematical game of trading 🎲
They don’t define you — they’re necessary, they happen, and we move forward 📊➡️
🙏 I appreciate you taking the time to review my Daily Forecast.
Stay sharp, stay consistent, and protect your capital
— FRNGT 🚀
FX:USDCAD
