USDCAD - Daily Trade Idea - 19-Sep-22USDCAD (SHORT)- If all the resistance holds in place.
If we see the Resistance broken out then we could see the shift in the trend.
I marked the TP 1, TP 2 , TP 3 and EXIT (SL) on the chart.
(THIS IDEAS VALID NEXT 24 HOURS)
Please note this is only the Trade Idea base on S & R and not a signal, the market can react differently during the session and only enter if we have the final confirmation for entry.
Usdcadshort

USDCAD | A BEARISH REVERSAL?USDCAD | BEARISH REVERSAL
USDCAD has formed a short term top at 1.33084 where daily closing gives a rejection candle indicating a bearish reversal sign.
On the shorter timeframe, the USDCAD has shown multiple bearish sign which gives weight for further downside atleast for short term (if not reversal)
1. Formation on Head and Shoulder Pattern
Head n Shoulder is a reversal pattern and is more effective when formed near top resistance after a bullish rally. In our case, we have seen good bullish rally in USDCAD then testing the top and failed to break above it. Since the formation is on lower timeframe the pair can move short term in downward direction.
2. Break of Key Support Trendline.
USDCAD has been respecting the key level of rising support trendline where every time price moves in the direction of trendline, bulls give respect to it and raise the price from there. But recently we have seen a clean break below from trendline indicating the bulls are exhausted and might remain absent from the scene atleast for the shorter term.
3. Appearance of Bearish Divergence on Key Resistance
Divergence has always been a key indicator in catching the bullish/bearish reversal specially after forming on top. This time the divergence has appear on RSI where price is making higher high and indicator is making lower high; a sign of bulls tiredness. We may see a fall once the highlighted support is broken
TRADE PLAN:
One can adopt sell on strength strategy with just 50 pips stoploss from the current level.
First Target is 70 pips below the current level while one can play for further downside if bulls remain absent from the scene.
Let us know what do you think of the idea in comment sections.

USDCAD H4Hi traders, USDCAD is setting up for a downside move watch price action in a lower timeframe and look for short GOOD LUCK.

Potential sell for USDCAD,but be careful as resistance can breakBased on broad-based US Dollar strength, USD/CAD has reached the 1.32 resistance area once again where some
amount of bearish price action has happened.
Based on that, my plan is to sell USDCAD@1.3190-1.3220 with a moderately wide stop loss above the resistance level.
However, the sellers need to be careful because the chance of a price breakout above the resistance level can not
be ruled out.

USDCAD possible top short for 1.30005th-9th September weekly inside bar range confined within in the range of the previous bar. supply zone for short 1.3200-20. stop loss 1.3240, target: 1.3000

USD/CAD Short....USD/CAD Sell... This is not signal... Dont risk more than 3% of your account on any trade...

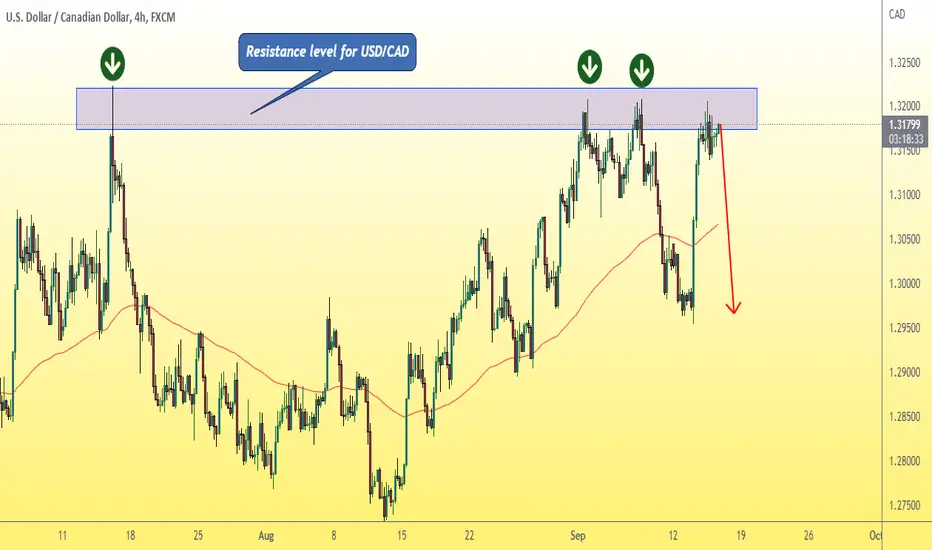
USDCAD DAILY SETUPUSDCAD retreated from the 50% Fibonacci point back to the 0% point and it gives the pair two options, forming a Tripple top both on the 4 hour and the daily time frame falling back to the 61,8% fib point, or breaking the resistance point (purple box) which has been the top for several months now making further moves to the upside.

usdcad shortlets see if this resistance holds for a reversal, down to the beginning of usdcads short term up trend

USDCAD SHORTUsdcad possible sell. 1.31668 there is a possible resistance level that the market can react to. If we look to the left there is a clear fake-out zone as well as our swap zone. I am liking this to sell USDCAD.

SELL USDCADShort USDCAD a 1.3120 ,sl at 1.3175 tp at 1.2909
CAD Interest rates at 3.25% as announced yesterday I expect price to go lower.

USDCAD - Daily Trade Idea - 13-Sep-22USDCAD (SHORT)- If all the resistance holds in place.
If we see the Resistance broken out then we could see the shift in the trend.
I marked the TP 1, TP 2 , TP 3 and EXIT (SL) on the chart.
(THIS IDEAS VALID NEXT 24 HOURS)
Please note this is only the Trade Idea base on S & R and not a signal, the market can react differently during the session and only enter if we have the final confirmation for entry.

USDCAD $USDCAD Initial ShortUSDCAD $USDCAD Initial Short. This is a pure momentum signal just as are every other signal I post. ZERO other factors are considered in producing this signal.
Entry reasons: USDCAD is showing momentum and confluence of mean reversion crossing up the 70 day price mean.
Exits and SL: TP and SL on chart. Move SL on TP. After TP2, trail with 0.5xATR step and 1.5xATR offset.

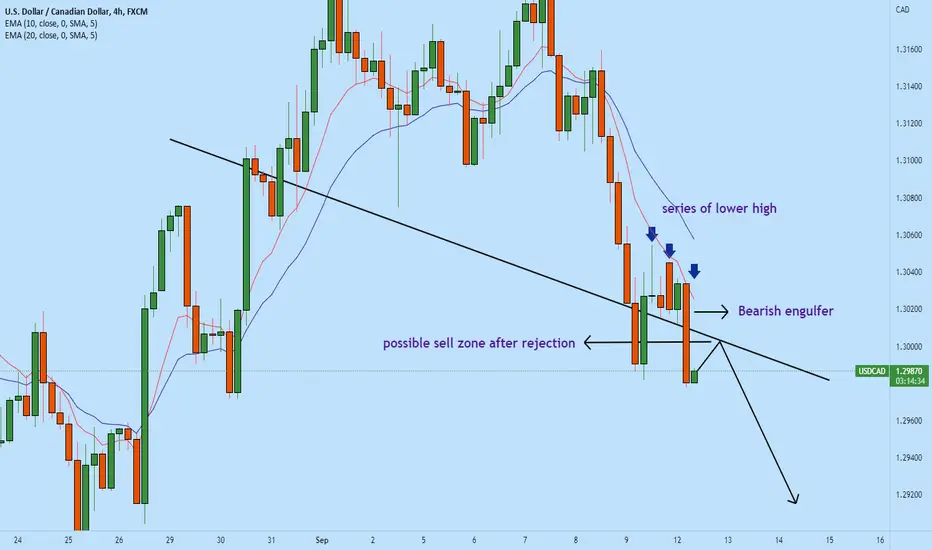
USDCAD possible sell zone!!USDCAD (4h) has formed a strong reversal pattern and the price has broken to the downside with a bearish engulfer. Currently, the price is below weekly support. in the new trading week, the price opened with a gap up with rejection to the downside. On the test of the neckline of the reversal pattern, the price may continue to drop. A sale is a high probability of set up after rejection.
Press the like button if you enjoy this content :)
USDCAD H4Hi traders, USDCAD is setting up for a downside move watch price action and look for short GOOD LUCK.

USDCAD (SHORT) 🔥🔥🔥ENTRY OPPORTUNITY
Risk Disclaimer:
Please be advised that I am not telling anyone how to spend or invest their money. Take all of my analysis as my own opinion, as entertainment, and at your own risk. I assume no responsibility or liability for any errors or omissions in the content of this page, and they are for educational purposes only. Any action you take on the information in this analysis is strictly at your own risk. There is a very high degree of risk involved in trading. Past results are not indicative of future returns. Good luck
