TheGrove | AUDUSD Sell | Idea Trading AnalysisYou can expect a reaction in the direction of selling from the specified Resistance line
USDCAD moving higher as it tests the strong resistance level..
We expect a bearish move from the confluence zone.
Hello Traders, here is the full analysis.
I think we can soon see more fall from this range! GOOD LUCK! Great SELL opportunity USDCAD
I still did my best and this is the most likely count for me at the moment.
-------------------
Traders, if you liked this idea or if you have your own opinion about it, write in the comments. I will be glad 🤝
Usdcadsignal

#USDCAD: +500 Pips Swing Sell Opportunity; One Not To Miss! Dear Traders,
The USDCAD pair is currently in a strong bearish trend and we anticipate a price correction. We expect the price to turn bullish in the short term, filling the liquidity gap it’s left behind. Once filled, the price could reverse and continue selling until it reaches around 1.3200, a 500+ pip move. Currently, there’s only one target, and the stop-loss can be adjusted based on your risk management.
The USD is plummeting, but there’s a chance it could show some bullish momentum. However, the CAD is experiencing a strong, continuous bullish trend, so we expect a correction.
If you enjoy our work, please like and comment. Also, follow us for updates whenever we post ideas.
Team Setupsfx_

USDCAD – Bearish Scenario (Daily Time Frame)As shown on the chart, price is currently trading inside both the daily and weekly bearish FVG, which keeps the higher-timeframe bias bearish.
On Friday, price swept the buy-side liquidity, acting as an external liquidity grab. Following this move, I expect price to seek internal liquidity, which is aligned with the bullish FVG below.
Therefore, my expectation is for continuation to the downside, with the bullish FVG acting as the draw on liquidity.
As always, wait for confirmation on lower time frames for execution.
Cheers 🚀

USD/CAD Closing in on Breakout! Will Bulls Take Control?🔥 USD/CAD "THE LOONIE": Bullish Breakout Play (Swing Trade Setup) | Layer Entry Strategy 🚀
TradingView Description:
🎯 TRADE IDEA: BULLISH SWING ON USD/CAD
🏆 Plan & Thesis:
The Loonie is approaching a critical juncture! 🧐 We are stalking a potential bullish breakout above the strong resistance zone at 1.41400. Our plan is to patiently wait for a confirmed breakout and momentum shift, signaling the next leg up. This is a swing trade opportunity targeting a key resistance area.
⚡ Why This Setup?
Key Resistance Break: A decisive break above 1.41400 indicates buyer strength overpowering sellers.
Trend Continuation: Aligns with the broader bullish structure on the higher timeframes.
Low-Risk, High-Reward Entry: Using the "Thief" layer strategy to optimize our average entry price.
📈 Trade Execution Details:
🎯 Entry Strategy (The "Thief" Layer Method): 🤑
We do not chase the price! We use a strategic layer of Buy Limit orders to enter on any retracement after the breakout is confirmed.
Layer 1: 1.41200
Layer 2: 1.41000
Layer 3: 1.40800
Layer 4: 1.40600
👉 You can adjust the number of layers and levels based on your capital and risk appetite.
🛑 Stop Loss (RISK MANAGEMENT):
A consolidated stop loss is placed below all entry layers at 1.40400.
⚠️ Disclaimer: This is MY stop loss. Please adjust your position size and SL based on YOUR personal risk management strategy. Protect your capital!
🎯 Take Profit Target:
Our primary profit target is set at 1.42100, a zone of strong historical resistance where we anticipate a pullback or overbought conditions.
💡 Pro Tip: Consider taking partial profits on the way up and moving your stop loss to breakeven to secure risk-free trades!
🌐 Market Context & Correlated Pairs to Watch:
Understanding correlations is key to validating this thesis! Keep an eye on these:
OANDA:USDCAD & PEPPERSTONE:USDX (DXY): 👑 DIRECT CORRELATION. A stronger US Dollar Index typically boosts USD/CAD. Watch for DXY strength to confirm our bullish bias.
OANDA:USDCAD & GETTEX:WTIC (Crude Oil): 👑 INVERSE CORRELATION. Canada is a major oil exporter. If Oil prices fall, CAD often weakens, pushing USD/CAD higher (bullish for our trade).
FX:EURUSD & FX:GBPUSD : These major pairs often move inversely to the USD. If they are falling, it can signal broad USD strength, supporting our USD/CAD long.
✅ Key Takeaways:
✅ Wait for a confirmed breakout and close above 1.41400.
✅ Execute entries using the layer method for best average price.
✅ MANAGE YOUR RISK! This is not financial advice. Your risk, your rules.
✅ Watch correlated pairs ( TVC:DXY , TVC:XAU , GETTEX:WTIC ) for confluence.
👑 Let's get this bread, traders! If you found this idea helpful, please give it a LIKE 👍, SHARE it with a fellow trader, and FOLLOW me for more high-quality setups! Your support helps the community grow! 💬 Drop a comment below with your thoughts!

USD/CAD Price Outlook – Trade Setup📊 Technical Structure
OANDA:USDCAD USD/CAD is holding firmly above a well-defined support zone around 1.3855–1.3865, following a strong impulsive advance earlier in the week. Recent price action shows consolidation above support rather than aggressive selling, indicating that downside momentum remains limited.
From a structural perspective, the pair is forming a bullish continuation pattern, with higher lows maintained above the support zone. As long as this area holds, price action favours a renewed upside push toward the 1.3900–1.3915 resistance zone, rather than a deeper corrective pullback.
🎯 Trade Setup (Bullish Bias)
Entry Zone: 1.3855 – 1.3865
Stop Loss: 1.3853
Take Profit 1: 1.3900
Take Profit 2: 1.3915
Risk–Reward Ratio: Approx. 1 : 3.24
📌 Invalidation:
A sustained break and close below 1.3857 would invalidate the bullish setup and signal a deeper correction.
🌐 Macro Background
On the macro side, the U.S. Dollar continues to receive underlying support from resilient U.S. economic data, reinforcing expectations that the Federal Reserve is in no rush to cut interest rates. This backdrop helps maintain a firm USD base in the near term.
Although the Canadian Dollar is supported by relatively stable oil prices, the impact appears contained for now. With no clear bearish catalyst against the USD, USD/CAD remains biased toward consolidation followed by upside continuation, particularly while price holds above key technical support.
🔑 Key Technical Levels
Resistance Zone: 1.3900 – 1.3915
Support Zone: 1.3855 – 1.3865
Bullish Invalidation: Below 1.3853
📌 Trade Summary
USD/CAD is consolidating above a critical support zone after a strong bullish leg. As long as price remains supported above 1.3855, the bias favours a buy-on-dips approach, targeting a retest of the upper resistance band.
⚠️ Disclaimer
This analysis is for reference only and does not constitute trading advice. Financial markets involve significant risk; proper risk and position management are essential.

USD/CAD Bullish Structure Confirmed — Momentum Favors Upside!🚨 USD/CAD "THE LOONIE" FOREX OPPORTUNITY 🇺🇸🇨🇦 | Swing/Day Trade Setup
📊 MARKET OVERVIEW
Asset: USD/CAD (United States Dollar / Canadian Dollar)
Nickname: "The Loonie" 🦆
Market: Forex Major Pair
Trade Style: Swing Trading / Day Trading
Timeframe: Multi-timeframe analysis confirmed
🎯 TRADE PLAN BREAKDOWN
📈 Bias: BULLISH - Moving Average Breakout Confirmed ✅
Price action showing strong momentum above key moving averages with breakout structure validated.
🔵 ENTRY ZONE:
Flexible entry strategy - Multiple price levels available for position building
Current market conditions allow entries at various technical levels
🎯 TARGET LEVEL:
TP: 1.40000 🎯
This psychological level acts as:
Strong resistance zone 💪
Historical price reaction area
Potential overbought territory ⚠️
Watch for bull trap scenarios near target
⚠️ PROFIT MANAGEMENT NOTE:
Fellow traders & market OGs - This is MY target level based on technical analysis. YOU control YOUR money! 💰 Scale out, trail stops, or take profits at YOUR comfort zone. Trade at your own risk and never risk more than you can afford to lose! 🛡️
🔴 STOP LOSS:
SL: 1.38100 🛑
Risk management level positioned below key support structure.
⚠️ RISK MANAGEMENT NOTE:
Dear traders - This SL is based on technical invalidation points. Adjust YOUR stop loss according to YOUR risk tolerance, account size, and trading plan. Never trade without stops! Your capital, your rules! 💼
🔗 CORRELATED PAIRS TO WATCH
📌 US DOLLAR PAIRS:
EUR/USD 💶 - Inverse correlation (USD strength affects both)
GBP/USD 💷 - Similar USD exposure, watch for divergence
DXY (US Dollar Index) 📈 - Primary USD strength indicator
USD/JPY 🇯🇵 - Risk sentiment correlation
📌 COMMODITY CURRENCY PAIRS:
AUD/USD 🇦🇺 - Fellow commodity currency (gold/resources)
NZD/USD 🇳🇿 - Risk appetite correlation with CAD
USD/MXN 🇲🇽 - North American regional correlation
📌 ENERGY-RELATED:
Crude Oil (WTI/Brent) 🛢️ - CRITICAL for CAD (Canada = major oil exporter)
Strong inverse correlation: Oil ⬆️ = CAD ⬆️ (USD/CAD ⬇️)
📰 FUNDAMENTAL & ECONOMIC FACTORS
🇺🇸 US DOLLAR DRIVERS:
✅ Federal Reserve Policy - Monitor FOMC statements & rate decisions
✅ US Economic Data:
Non-Farm Payrolls (NFP) 📊
CPI/Inflation reports 📈
Retail Sales & Consumer Confidence
GDP Growth figures
✅ Treasury Yields - Higher yields = USD strength typically
🇨🇦 CANADIAN DOLLAR DRIVERS:
✅ Bank of Canada (BoC) Policy - Rate decisions & monetary policy stance
✅ Crude Oil Prices 🛢️ - MOST IMPORTANT for CAD strength
✅ Canadian Economic Data:
Employment figures
GDP reports
Manufacturing & Trade Balance
Housing market data
⚡ UPCOMING CATALYSTS TO WATCH:
🔔 Check economic calendar for:
US Fed speeches & minutes
Canadian employment reports
Weekly oil inventory data (EIA reports)
Central bank rate decisions (both Fed & BoC)
Inflation data releases from both nations
Trade balance & current account reports
🌍 GLOBAL RISK FACTORS:
⚠️ Geopolitical tensions affecting oil markets
⚠️ Global economic growth concerns
⚠️ OPEC+ production decisions impacting oil
⚠️ US-China trade relations
⚠️ Energy policy changes in North America
🔑 KEY TECHNICAL POINTS
✨ Moving average breakout structure confirmed
✨ Momentum indicators supporting bullish bias
✨ Watch for resistance cluster around 1.40000
✨ Volume confirmation on upside moves is critical
✨ Multiple timeframe alignment present
⚖️ RISK DISCLAIMER
🚨 TRADING INVOLVES SUBSTANTIAL RISK 🚨
This is NOT financial advice - purely educational technical analysis! 📚
Always use proper risk management (1-2% per trade max) 🛡️
Never trade with money you can't afford to lose 💸
Past performance doesn't guarantee future results 📉📈
Market conditions change rapidly - stay adaptable! 🔄
Trade smart, manage risk, protect your capital! 💪
💬 ENGAGEMENT CALL-TO-ACTION
🔥 Found this analysis helpful?
👍 Smash that LIKE button!
💬 Drop your thoughts in the COMMENTS!
👥 FOLLOW for more forex setups & market insights!
🔔 Turn on notifications so you never miss an update!
Let's make profitable trades together! 🚀💰

USDCAD Short Ideathis pair has formed an ascending channel on H1 timeframe
now we're waiting for a momentum candle to close below the last touch of the channel so we can enter a sell trade
Follow us for more idea or trades

USDCAD Trade Setup: Possible Buy the Dip OpportunityWe are looking at a possible Buy setup on USDCAD! 🇨🇦🇺🇸 The Canadian Dollar is showing significant weakness due to the recent strikes in Venezuela, which have unexpectedly created a supply glut in the energy sector. As Oil prices 🛢️ drop, the CAD takes a hit, while the Greenback (USD) has been gathering strength over the last week.
🚀 The Strategy: Buy Strength, Sell Weakness We are sticking to the golden rule of trend trading. Here is the technical breakdown of what I am watching for:
I am waiting for price to pull back and run sell-side liquidity. 💧
Watch the Weekly Open. I want to see price dip below it to trap shorts, then reclaim that level. A retest of the Weekly Open is our prime Point of Interest (POI). 🎯 Before entry, we need to see a clear Break of Structure (BOS) to the upside. 📈
⚡ Entry Scenarios
Conservative: Wait for the reclaim and retest of the Weekly Open.
Aggressive: Enter on the BOS during the current pullback phase.
🛡️ Place your Stop Loss just below the swing low once the rotation is confirmed. Let the market prove you right!
⚠️ Disclaimer: This analysis is for educational purposes only and does not constitute financial advice. Always do your own due diligence.

USD/CAD Price Outlook – Trade Setup📊 Technical Structure
OANDA:USDCAD USD/CAD has staged a steady recovery from the 1.3680–1.3700 base, forming a sequence of higher lows and pushing back above the 1.3750 support zone, which now acts as a short-term demand area. Price is currently trading near 1.3770, approaching the lower boundary of a broader 1.3807–1.3822 resistance zone.
On the 1-hour chart, momentum remains constructive, but price is entering a known supply region. The structure suggests a potential bullish continuation after a shallow pullback, rather than immediate breakout. As long as price holds above 1.3740, buyers retain short-term control.
🎯 Trade Setup (Bullish Bias)
Entry Zone: 1.3740 – 1.3724
Stop Loss: 1.3719
Take Profit 1: 1.3807
Take Profit 2: 1.3822
Estimated Risk-to-Reward: approx. 1 : 3.42
The bullish setup remains valid as long as price holds above 1.3739 on an hourly closing basis.
🌐 Macro Background (Simplified)
USD/CAD is supported by a firm US Dollar ahead of the ISM Manufacturing PMI, with markets cautious about underestimating US economic resilience. Any upside surprise in ISM data could reinforce expectations that the Federal Reserve may slow the pace of rate cuts, lending near-term support to the USD.
At the same time, rising crude oil prices linked to US–Venezuela tensions may provide intermittent support to the Canadian Dollar, limiting upside momentum and keeping the pair in a grinding, step-by-step advance rather than a breakout rally.
In short, macro drivers are mixed, but near-term price action favours buying pullbacks rather than chasing strength.
🔑 Key Technical Levels
Resistance Zone: 1.3807 – 1.3822
Support Zone: 1.3739 – 1.3719
Bullish Invalidation: Hourly close below 1.3739
📌 Trade Summary
USD/CAD is rebuilding bullish structure after defending the 1.3750 area. While immediate upside may be capped near resistance, the broader setup favours dip-buying toward 1.3739–1.3724, with scope for a move toward 1.3807 and 1.3822 if US data supports the Dollar. The bullish view is invalidated only if price breaks and holds below 1.3739.
⚠️ Disclaimer
This analysis is for reference only and does not constitute trading advice. Financial markets involve significant risk; proper risk and position management are essential.

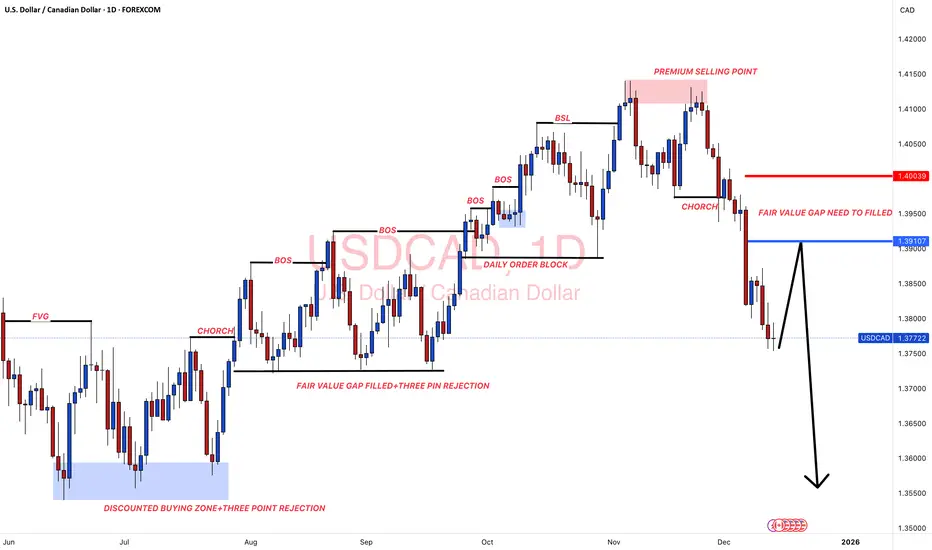
#USDCAD: A Perfect Selling Zone For The Week 15/12/2025Dear Traders,
Overview On USDCAD📈
🔺Price has left a great area of selling zone which need to be filled; we already have given an entry point and an exit point for you to identify the selling zone easily. USD is likely to show some minor bullish behaviour which will push the price of USDCAD to our point of interest.
🔺There is only one swing selling target that we currently have, this is not a long term trade instead or intraday trade.
Entry and Stop Loss Planning📊
🔺You must use your own knowledge to establish trading plan successfully, entry at the area as described in the chart only if it matches your bias.
🔺Use 'Red Line' as a exit point or as a stop loss also trade with accurate lot size based on your account.
🔺Take Profit Set at the 'Black Arrow' Ends.
Support and Encouragement ❤️🏆
If you like our idea then please like and comment which will encourage us to post such more ideas. Also share your views in the comment sections.
Tean Setupsfx_
USDCAD Bearish Breakout!
HI,Traders !
#USDCAD made a bearish
Breakout of the key
Horizontal level of 1.37376
And the breakout is confirmed
So we are bearish biased and
We will be expecting a
Further bearish continuation !
Comment and subscribe to help us grow !

USDCAD: +400 Pips Selling Opportunity!Overview🧠
The USDCAD currency pair has reversed and a potential change in trend is occurring. Confirmation is required before a sell entry can be made. The only take profit is a swing move with a potential gain of approximately 400 pips. The stop loss can be placed above the higher high. Please like and comment for more.
Team Setupsfx

USD/CAD Price Outlook – Trade Setup📊 Technical Structure
USD/CAD found solid support around the 1.3724–1.3740 zone after a sharp decline earlier in the month and has since rebounded steadily. Price is now consolidating below the 1.3807–1.3822 resistance area, which also marks a key supply zone from the previous breakdown.
On the 4-hour chart, the pair remains above a trendline, suggesting that the broader structure is still corrective-to-bullish rather than a trend reversal. As long as price holds above the 1.3724 support, the technical bias favours a buy-on-dip scenario, with upside potential toward the upper resistance band.
A decisive breakdown below the support zone would invalidate the bullish structure and shift the bias back to neutral or bearish.
🎯 Trade Setup (Bullish Bias)
Entry Zone: 1.3740 – 1.3724
Stop Loss: 1.3717
Take Profit 1: 1.3807
Take Profit 2: 1.3822
Estimated Risk-to-Reward: approx. 1 : 2.86
This bullish setup remains valid as long as price holds above 1.3724 on a 4-hour closing basis.
🌐 Macro Background (Simplified)
The Canadian Dollar has come under pressure following weaker-than-expected Canadian Retail Sales, highlighting soft household demand. This has reinforced expectations that the Bank of Canada (BoC) may need to deliver additional rate cuts, which weighs on CAD sentiment.
Meanwhile, the US Dollar remains relatively stable ahead of key US data releases, including preliminary Q3 GDP. Although USD momentum is not aggressive, relative CAD weakness continues to provide underlying support for USD/CAD.
In short, soft Canadian data + rate-cut expectations create a supportive macro backdrop for USD/CAD on dips.
🔑 Key Technical Levels
Resistance Zone: 1.3807 – 1.3822
Support Zone: 1.3740 – 1.3724
Bullish Invalidation: 4-hour close below 1.3724
📌 Trade Summary
USD/CAD is holding above trend support after a corrective pullback, maintaining a constructive bullish structure. As long as 1.3724 remains intact, a continuation move toward 1.3807–1.3822 is favoured. A clear break below support would invalidate this bullish view and require a reassessment of market direction.
⚠️ Disclaimer
This analysis is for educational purposes only and does not constitute investment advice. Trading involves risk; please manage position size and risk appropriately.

USD/CAD Price Outlook – Trade Setup📊 Technical Structure
USD/CAD remains in a short-term consolidation phase but continues to hold above the key support zone around 1.3789–1.3779, indicating that downside pressure is limited. Price action over the past sessions shows repeated defences of this support area, followed by higher lows, suggesting buyers are gradually regaining control.
On the 1-hour chart, the pair is attempting to build a base above the support zone while pressing toward the 1.3820 resistance area. As long as price holds above 1.3779, the technical structure favours a continuation move higher toward the 1.3820–1.3830 resistance zone. A clear breakdown below support would invalidate the bullish continuation scenario.
🎯 Trade Setup (Bullish Bias)
Entry Zone: 1.3789 – 1.3779
Stop Loss: 1.3773
Take Profit 1: 1.3820
Take Profit 2: 1.3830
Estimated Risk-to-Reward: approx. 1 : 2.47
The bullish setup remains valid as long as price holds above 1.3779 on an hourly closing basis.
🌐 Macro Background (Simplified)
The US Dollar has found short-term support after rebounding from softer US CPI data, as markets reassess the pace and timing of future Federal Reserve rate cuts. While inflation has cooled, expectations for aggressive easing remain measured, allowing the USD to stabilize in the near term.
Meanwhile, the Canadian Dollar remains cautious ahead of key domestic data, particularly Canadian Retail Sales, which could influence near-term CAD volatility. With oil prices offering limited directional support and macro uncertainty persisting, USD/CAD remains sensitive to relative data surprises.
In short: macro conditions are neutral-to-supportive for USD in the short term, allowing technical factors to take the lead.
🔑 Key Technical Levels
Resistance Zone: 1.3820 – 1.3830
Support Zone: 1.3789 – 1.3779
Bullish Invalidation: Hourly close below 1.3779
📌 Trade Summary
USD/CAD is consolidating above a well-defined support zone, with price structure suggesting accumulation rather than distribution. As long as 1.3779 support holds, a push higher toward 1.3820–1.3830 is favoured. The bullish view remains intact unless price breaks decisively below support, which would shift the bias back to range-bound or bearish conditions.
⚠️ Disclaimer
This analysis is for educational purposes only and does not constitute investment advice. Trading involves risk; please manage position size and risk appropriately.

Trade Idea on USDCAD on 1HR TFBullish setup on USDCAD on 1HR TF.
Entry: Buy stop at 1.37803
SL: 1.3735 (0.379% loss)
TP: 1.39378 (1.135% profit)
RR: 1:3
Bullish points:
- Falling wedge breakout
- Bullish divergence on 1hr

Smart Money Levels on USD/CAD – What’s Next for the Loonie?“USD/CAD – The LOONIE Profit Playbook (Swing/Day Trade) 🚀💰”
📋 Description:
Dear Ladies & Gentleman (Thief OG’s),
Here’s the plan for our favourite cross, USD/CAD – “The Loonie”:
Plan: Bullish bias (with a setup for a potential bearish flip if you like to dance with the other side)
Entry (Bullish):
Pullback-1: 1.39400
Pullback-2: 1.39000
Enter at a dip into one of those levels, let the market breathe, then ride the wave.
Stop Loss:
This is Thief SL at 1.38800 — place your stop after the pullback level you used.
Target (Bullish):
Our target zone: 1.41000 — watch for strong resistance, overbought signals & a possible trap. Escape with profit when you see the signs.
Entry (Bearish):
If you prefer the short side: you may enter anywhere, but keep sharp eyes on pullback zones and the target levels below.
Bearish Targets: 1.39400 & 1.39000
🔍 More to watch – Related Pairs & Correlations:
OANDA:USDCHF (often moves inversely with USD/CAD)
OANDA:AUDUSD (commodity-linked crosses, relevant when commodities shift)
OANDA:CADJPY (Canadian dollar strength/weakness can show up across CAD pairs)
Watch how CAD strength or USD strength flows across pairs. When CAD weakens, USD/CAD rises — when CAD strengthens, USD/CAD dips.
⚠️ Note:
Dear Ladies & Gentleman (Thief OG’s), I am not recommending you set only my stop-loss or take-profit rules. It’s your own choice — make money, then take money — at your own risk.
✨ Footer:
“If you find value in my analysis, a 👍 and 🚀 boost is much appreciated — it helps me share more setups with the community!”
📌 Disclaimer:
This is Thief style trading strategy just for fun.
#USDCAD #Forex #SwingTrade #DayTrade #Loonie #ForexSetup #ThiefTrader #TradingViewIdeas #ForexAnalysis #CurrencyPairs

Is the USD/CAD Re-Accumulation Zone the Next Bullish Launchpad?💰 USD/CAD “THE LOONIE” — Forex Market Profit Playbook (Swing/Day Trade)
📊 Plan:
BULLISH Bias confirmed by Re-Accumulation Zone (Smart Money activity detected!)
The “Thief Strategy” hunts liquidity smartly — using layered limit buys at key levels to capture institutional footprints without chasing candles.
🎯 Entry Plan (Layering Strategy Style)
The Thief strategy uses multiple buy limit layers — a smart method to scale into a position without full exposure at once.
Buy Limit Layers:
1️⃣ 1.39800
2️⃣ 1.39900
3️⃣ 1.40000
4️⃣ 1.40200
💡 You can adjust or increase the limit layers based on your own trade risk and capital exposure.
🛡️ Stop Loss (SL):
📍 Suggested protective stop: 1.39600
Not financial advice — each trader’s risk tolerance may vary. Manage risk wisely like a pro!
💵 Target (Take Profit Zone):
🎯 1.41300 — The “Police Barricade” (major resistance area).
This zone may act as a strong barrier due to overbought conditions and potential liquidity traps. Take your profits smartly and escape before the cops arrive! 🚓💨
⚠️ Notes to Thief OGs:
Dear Ladies & Gentlemen (Thief OGs) — this isn’t a signal, it’s a playbook idea. You’re free to adjust entries, SLs, and TPs based on your own analysis and money management plan.
Trade smart. Take profits wisely. Risk what you can afford to lose. 🧠💼
🔍 Related Pairs to Watch:
TVC:DXY (US Dollar Index) → USD strength driver, watch for momentum continuation.
BLACKBULL:WTI (Crude Oil) → Strong inverse correlation with CAD; rising oil often boosts CAD (bearish USD/CAD).
FX:USDCNH → USD sentiment barometer — positive correlation with USD/CAD.
OANDA:AUDCAD / OANDA:NZDCAD → Cross-check for CAD sentiment confirmation across commodity pairs.
🧭 Key Catalysts & Correlations:
USD fundamentals: Fed stance, CPI, and bond yields continue to influence direction.
CAD sentiment: Oil price movement and BoC tone will shape the medium-term bias.
Risk sentiment: Strong equity rally = weaker USD; risk-off tone = stronger USD.
✨ “If you find value in my analysis, a 👍 and 🚀 boost is much appreciated — it helps me share more setups with the community!”
📜 Disclaimer: This is a Thief-style trading strategy shared for educational and entertainment purposes only — not financial advice. Trade responsibly and with discipline.
#USDCAD #Forex #SwingTrade #DayTrade #SmartMoney #Reaccumulation #PriceAction #LiquidityHunt #TradingStrategy #MarketPlaybook #FXAnalysis #DollarIndex #ThiefStrategy #TradingViewIdeas #BullishSetup #ForexCommunity

USD/CAD False breakout of 1.3780 sell entry?USD/CAD is following a predictable pattern of false breakout of the swing high and since it starts this down wave.
There is false break 1, then drop
Falose break 2, then another drop
Current price is trending below swing low and there is a higher possility the market to bouce off the swing hihg which is a high probale entry on a falose breakout of the resistance line.

USDCAD BUY | Idea Trading AnalysisUSDCAD is falling towards a support level which is a pullback support and could bounce from this level to our take profit.
We expect a decline in the channel after testing the current level which suggests that the price will continue to rise
Hello Traders, here is the full analysis.
I think we can soon see more fall from this range! GOOD LUCK! Great BUY opportunity USDCAD
I still did my best and this is the most likely count for me at the moment.
-------------------
Traders, if you liked this idea or if you have your own opinion about it, write in the comments. I will be glad 🤝

USDCAD Will Keep Falling!
HI,Traders !
#USDCAD is trading in a
Downtrend and the pair made
A retest of the horizontal
Resistance of 1.39769 from where
We are already seeing a bearish
Move down so we will be
Expecting a further
Bearish move down !
Comment and subscribe to help us grow !

USD/CAD Price Outlook – Trade Setup📊 Technical Structure
OANDA:USDCAD USD/CAD is trading flat around 1.3950, holding below the 1.3966–1.3975 Resistance Zone, where repeated rejections keep the short-term bias tilted to the downside. The pair continues to oscillate within a compressed structure, failing to sustain any break above resistance, while the 1.3928–1.3937 Support Zone remains untested below.
As long as price stays under the resistance band, the structure favours another push lower toward support. A clean hourly close above 1.3975 would invalidate the bearish setup and shift momentum back upward.
🎯 Trade Setup
Entry: 1.3966 – 1.3975
Stop Loss: 1.3980
Take Profit 1: 1.3937
Take Profit 2: 1.3928
Risk–Reward Ratio: Approximately 1 : 2.5
Bearish structure remains valid below 1.3975. A breakout above this level invalidates the setup.
🌐 Macro Background
USD/CAD trades in a tight range ahead of Canada’s November employment report. Markets expect the Unemployment Rate to rise to 7%, signalling slower labour-market conditions and increasing the likelihood that the Bank of Canada (BoC) could extend its easing cycle at next week’s policy meeting. Soft Canadian data would generally weaken the CAD.
Meanwhile, the US Dollar remains subdued as traders firmly price in a 25 bps Fed rate cut at the December 9–10 meeting. According to the CME FedWatch Tool, the probability of a cut stands near 87%. Weakening labour-market indicators in the US and expectations that tariff-driven inflation is non-persistent add to the dovish pressure on the USD.
Overall, both currencies face macro headwinds, but the technical picture for USD/CAD favours a downside continuation toward support unless Canada’s jobs report surprises significantly.
🔑 Key Technical Levels
Resistance Zone: 1.3966 – 1.3975
Support Zone: 1.3928 – 1.3937
Structure Break (Invalidation): 1.3980
Targets: 1.3937 / 1.3928
📌 Trade Summary
USD/CAD remains capped beneath the resistance zone, preserving a short-term bearish structure. The preferred approach is to sell into 1.3966–1.3975, targeting a move back toward 1.3928–1.3937 support. A sustained move above 1.3980 cancels the setup.
⚠️ Disclaimer
This analysis is for reference only and does not constitute trading advice. Trading involves significant risk, and proper risk management is essential.

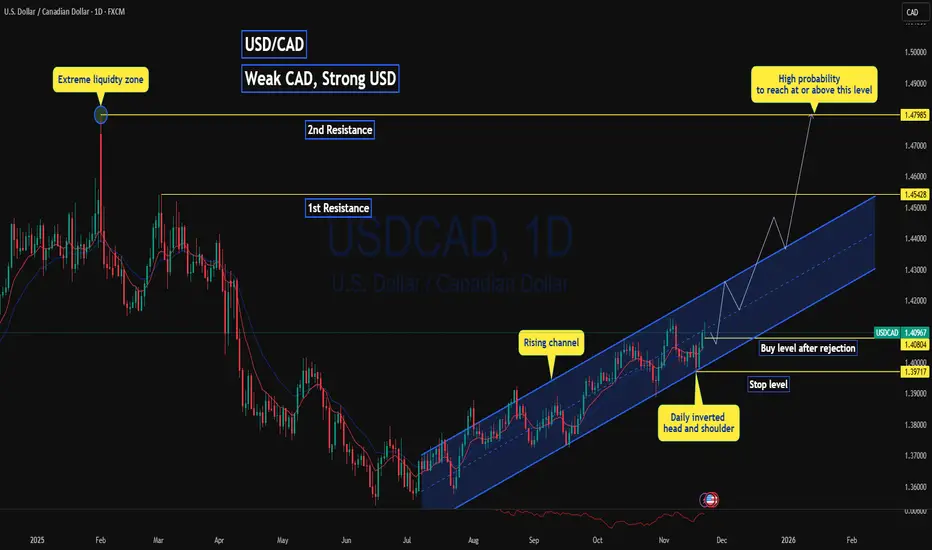
USDCAD is set to go 700 pip up!💹 Trade Setup USD/CAD
USD/CAD has formed a bullish channel with recent formation of inverted head and shoulder on the support level of the rising channel.
Weekly price action is has shown strong rejection from the support level with multiple liquidity grab.
with weaker CPI 2.9% where the forecast is 3.1% on CAD as well as continued bearish trend in Crude Oil ( as CAD is highly influence to WTI price ) putting CAD under pressure, While strong NFP data Non-Farm Employment Change 119k while forecast 53k boosting DXY making USD /CAD one of the strongest USD currency pairs to trade on
📈Trading Idea :
Look for bullish setup after false breakout of daily support at 1.4080 and rejection above
✈️Targets
1st Resistance 1.4543
2nd Resistance: 1.4799
🔴Stop level
at or below 1.3971 as this is the lower shadow of the inverted head and shoulder.
Follow for more ideas and update on this pair and other pairs !
USDCAD Resistance Ahead!
HI,Traders !
#USDCAD keeps going up
And the pair is locally oversold
So after it hits the horizontal
Resistance of 1.40666 we
Will be expecting a local
Bearish correction !
Comment and subscribe to help us grow !
