USDCAD: Important Breakout 🇺🇸🇨🇦
USDCAD broke below 2 major daily structures:
the price violated a rising trend line and a key horizontal
support cluster and closed below them on a daily.
We can expect a bearish movement way lower now.
The next strong support is 1.36
❤️Please, support my work with like, thank you!❤️
I am part of Trade Nation's Influencer program and receive a monthly fee for using their TradingView charts in my analysis.
Usdcadsignals

USDCAD: Bullish Outlook Explained 🇺🇸🇨🇦
USDCAD broke and closed above a resistance line
of a falling parallel channel on a daily.
It suggests a strong buying pressure and an oversold
state of the market.
I will expect a rise next week at least to 1.385 level.
❤️Please, support my work with like, thank you!❤️
I am part of Trade Nation's Influencer program and receive a monthly fee for using their TradingView charts in my analysis.

USDCAD: Bullish Move After Trap 🇺🇸🇨🇦
I see a bearish trap on USDCAD after a test of a key
daily support.
A formation of a bullish CHoCH on a 4h time frame
during the Asian session today suggests a strong buying interest.
I expect a rise to 1.402
❤️Please, support my work with like, thank you!❤️
I am part of Trade Nation's Influencer program and receive a monthly fee for using their TradingView charts in my analysis.

USDCAD starting a massive 2-year rally.The USDCAD pair has been trading within a Channel Up since the May 31 2021 market bottom. In recent weeks it broke above its 1W MA50 (blue trend-line) following a June 16 2025 Higher Low, just above the 1W MA200 (orange trend-line), which has been holding as the natural Support since September 2022.
Given the potential peak on the 1W CCI and the similarities with the previous Higher Low bottom formations, we expect the pair to start the new long-term Bullish Leg. With the previous two Bullish Legs rising by at least +13.00%, we anticipate the price to reach 1.53000 within 2 years time.
---
** Please LIKE 👍, FOLLOW ✅, SHARE 🙌 and COMMENT ✍ if you enjoy this idea! Also share your ideas and charts in the comments section below! This is best way to keep it relevant, support us, keep the content here free and allow the idea to reach as many people as possible. **
---
💸💸💸💸💸💸
👇 👇 👇 👇 👇 👇

USDCAD: Consolidation Continues 🇺🇸🇨🇦
I think that sideways price action will continue on USDCAD.
The price is going to pull back from an intraday support at least
one more time.
Expect a rise at least to 1.4027 level.
❤️Please, support my work with like, thank you!❤️
I am part of Trade Nation's Influencer program and receive a monthly fee for using their TradingView charts in my analysis

USDCAD Rejected on its 1D MA200. Sell signal.Last time we looked at the USDCAD pair (August 21, see chart below), the Channel Up gave us an excellent sell signal right on its top, which easily hit our 1.37715 Target:
The market is currently giving us a strong signal yet again as the price not only hit the top of its Channel Up but also the 1D MA200 (orange trend-line) for the first time since May 13 2025.
That was the time it suffered a brutal rejection to multi-month lows and again upon testing it yesterday, it is being rejected.
With the 1D RSI also hitting its own Resistance Zone, we expect the price to pull-back to at least its 0.5 Fibonacci retracement level, similar to August 07. As a result, our short-term Target is 1.8570.
-------------------------------------------------------------------------------
** Please LIKE 👍, FOLLOW ✅, SHARE 🙌 and COMMENT ✍ if you enjoy this idea! Also share your ideas and charts in the comments section below! This is best way to keep it relevant, support us, keep the content here free and allow the idea to reach as many people as possible. **
-------------------------------------------------------------------------------
💸💸💸💸💸💸
👇 👇 👇 👇 👇 👇

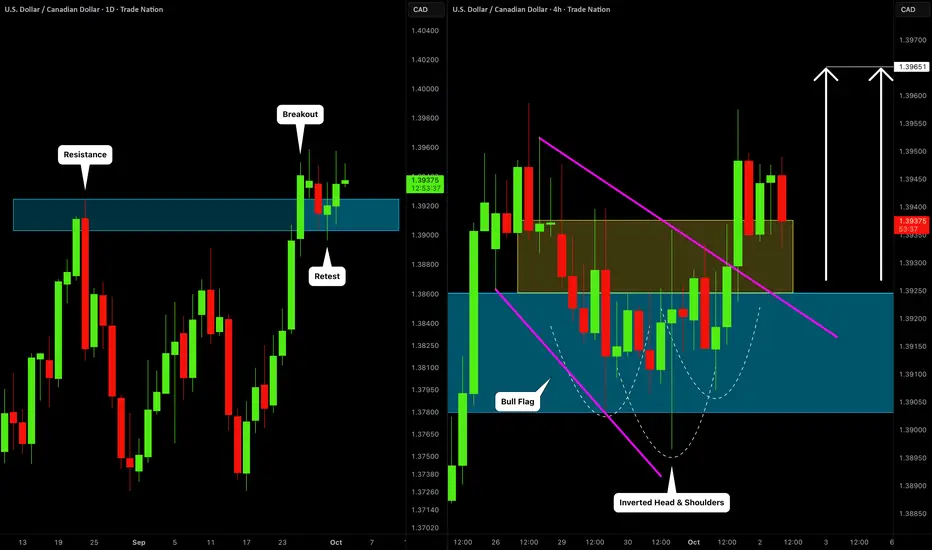
USDCAD: Correction is Over?! 🇺🇸🇨🇦
USDCAD may complete a correctional movement after a confirmed
breakout of a major daily resistance.
A bullish violation of a trend line of a bullish flag pattern and a neckline
of an inverted head & shoulders pattern provides a strong confirmation.
Next goal - 1.3965
❤️Please, support my work with like, thank you!❤️
I am part of Trade Nation's Influencer program and receive a monthly fee for using their TradingView charts in my analysis.
USDCAD: Bullish Move From Demand Zone?! 🇺🇸🇨🇦
There is a high chance that USDCAD will respect
the underlined demand zone and go up from that.
As a confirmation, I spotted an ascending triangle pattern on a 4H
time frame and a formation of a bullish imbalance candle.
Goal - 1.377
❤️Please, support my work with like, thank you!❤️
I am part of Trade Nation's Influencer program and receive a monthly fee for using their TradingView charts in my analysis.

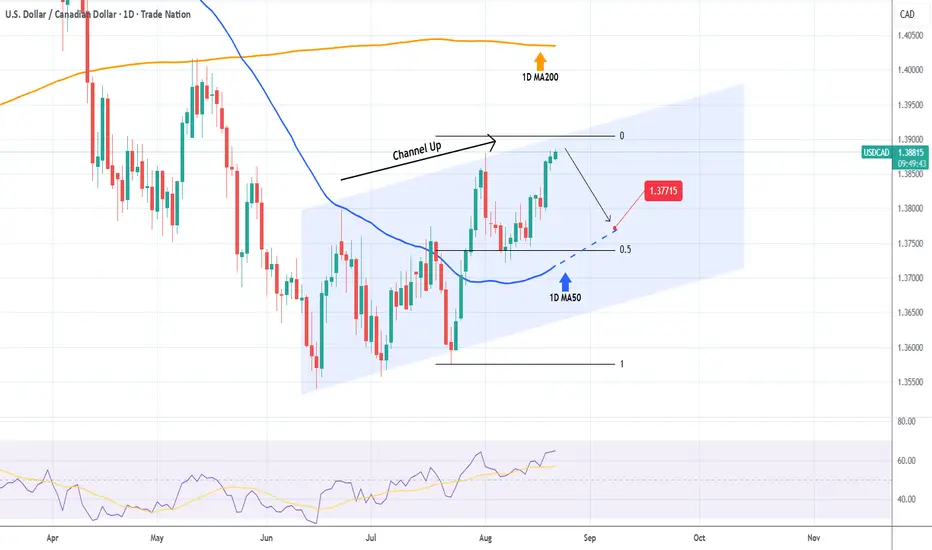
USDCAD Top of the Channel issues short-term sell signal.The USDCAD pair has been trading within a Channel Up since the 1D RSI Bullish Divergence started on the June 16 bottom and right now the price is approaching its top (Higher Highs trend-line) yet again.
With the 1D MA50 (blue trend-line) acting as Support, we expect as short-term pull-back (at least) as long as the 1D candles close within the pattern. Our Target is 1.37715.
-------------------------------------------------------------------------------
** Please LIKE 👍, FOLLOW ✅, SHARE 🙌 and COMMENT ✍ if you enjoy this idea! Also share your ideas and charts in the comments section below! This is best way to keep it relevant, support us, keep the content here free and allow the idea to reach as many people as possible. **
-------------------------------------------------------------------------------
Disclosure: I am part of Trade Nation's Influencer program and receive a monthly fee for using their TradingView charts in my analysis.
💸💸💸💸💸💸
👇 👇 👇 👇 👇 👇
USDCAD: Overbought Market & Pullback 🇺🇸🇨🇦
USDCAD looks overbought after a yesterday's bullish rally.
The price reached a key daily resistance and I see a confirmed
bearish breakout of a support line of a rising channel on an hourly time frame.
I expect a retracement at least to 1.3864 support.
❤️Please, support my work with like, thank you!❤️
I am part of Trade Nation's Influencer program and receive a monthly fee for using their TradingView charts in my analysis.

Liquidity Sweep and Bearish Setup on USD/CADFenzoFx—USD/CAD swept the liquidity above the 1.387 resistance, currently trading below this level. The 4-hour chart shows the pair formed a long wick bearish candlestick pattern.
The immediate support is at 1.386. From a technical perspective, a close with a bearish engulfing candlestick should be considered as a change of character. In this scenario, we expect the price to dip toward the next support level at 1.381.

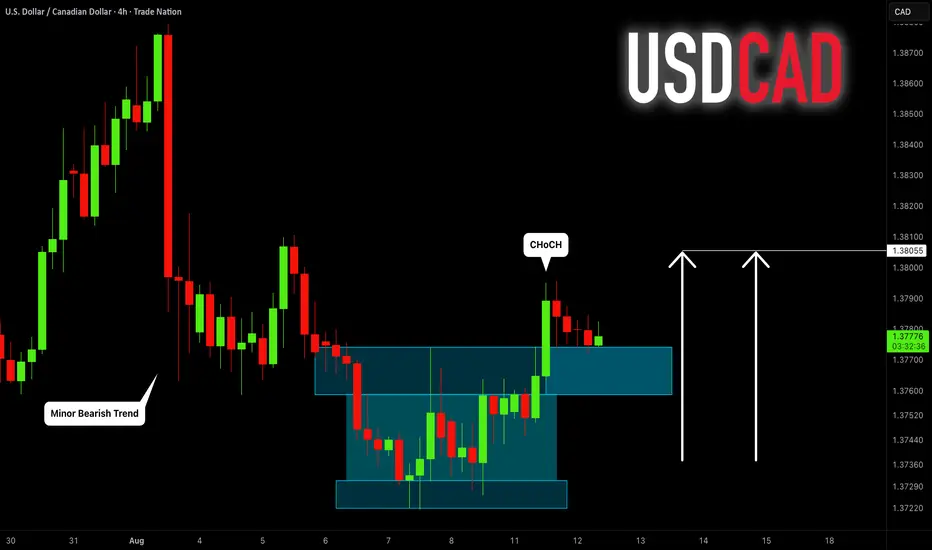
USDCAD: Intraday Bullish Reversal 🇺🇸🇨🇦
USDCAD will likely go up, following a confirmed
bullish Change of Character CHoCH.
Next resistance is 1.3805
❤️Please, support my work with like, thank you!❤️
I am part of Trade Nation's Influencer program and receive a monthly fee for using their TradingView charts in my analysis.
USDCAD ( Weekly CLS Setup) Everything is clear here: a bearish order flow, with signs of manipulation and liquidity grabs above the structure highs. EUR/USD is trending upwards, presenting a good opportunity for a short trade on USD/CAD

USDCAD Strongest long-term Sell in the market right now.At the beginning of the year (January 15, see chart below), we made an unpopular bearish call at the time, hinting that the USDCAD pair was approaching its Resistance Zone, hence a multi-year Top was in order:
As you can see, the moment the price hit that Resistance Zone, it got instantly rejected and a new Bearish Leg started, which has extended up to this day. This time we view this on the 1M time-frame where the Support levels are more clearly illustrated.
More particularly, the 1M MA50 (blue trend-line) poses as the first one, in fact it has been holding since September 2022. Our Target is still located at 1.26000, which is marginally above the 0236 Fibonacci level, which has been the 1st Target during both previous Bearish Legs. Also it is where the 1M MA200 (orange trend-line) is headed to, and there are high chances of a long-term bounce there.
-------------------------------------------------------------------------------
** Please LIKE 👍, FOLLOW ✅, SHARE 🙌 and COMMENT ✍ if you enjoy this idea! Also share your ideas and charts in the comments section below! This is best way to keep it relevant, support us, keep the content here free and allow the idea to reach as many people as possible. **
-------------------------------------------------------------------------------
Disclosure: I am part of Trade Nation's Influencer program and receive a monthly fee for using their TradingView charts in my analysis.
💸💸💸💸💸💸
👇 👇 👇 👇 👇 👇

USDCAD LONG FORECAST Q2 W24 D13 Y25USDCAD LONG FORECAST Q2 W24 D13 Y25
Professional Risk Managers👋
Welcome back to another FRGNT chart update📈
Diving into some Forex setups using predominantly higher time frame order blocks alongside confirmation breaks of structure.
💡Here are some trade confluences📝
✅1H order block
✅HTF 50 EMA
✅Intraday bullish breaks of structure to be identified
✅15’ order block identified
🔑 Remember, to participate in trading comes always with a degree of risk, therefore as professional risk managers it remains vital that we stick to our risk management plan as well as our trading strategies.
📈The rest, we leave to the balance of probabilities.
💡Fail to plan. Plan to fail.
🏆It has always been that simple.
❤️Good luck with your trading journey, I shall see you at the very top.
🎯Trade consistent, FRGNT X
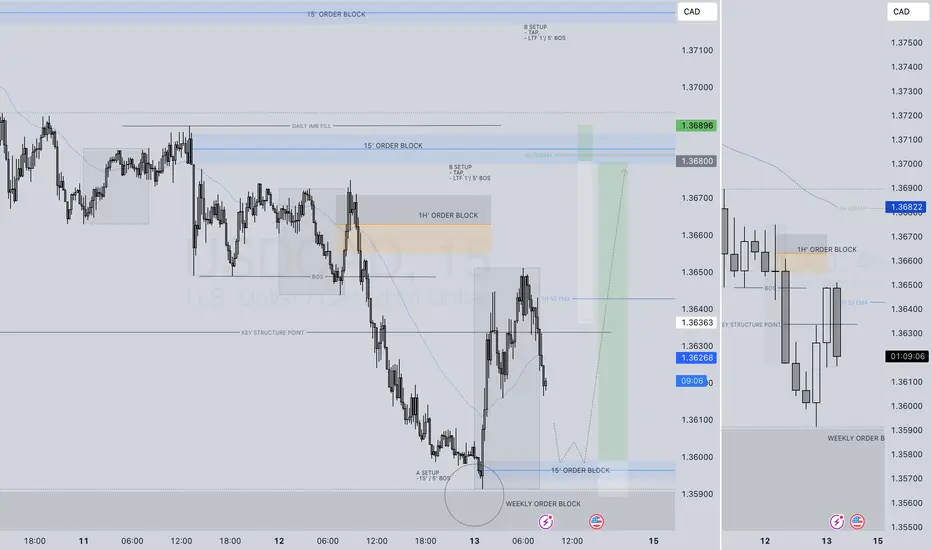
#usdcadYou can enter in two steps and the best entry is in the low-risk zone. The low-risk zone has a reward of 1 to 10, which can also be done risk-free, but I recommend being patient until you reach TP 10.

USDCAD: Breakout & Bearish Continuation 🇺🇸🇨🇦
USDCAD broke and closed below a key intraday/daily horizontal support cluster.
I expect a bearish trend continuation after its retest.
Next goal - 1.376
❤️Please, support my work with like, thank you!❤️
I am part of Trade Nation's Influencer program and receive a monthly fee for using their TradingView charts in my analysis.

USD/CAD "The Loonie" Forex Bank Heist Plan (Swing/Day)🌟Hi! Hola! Ola! Bonjour! Hallo! Marhaba!🌟
Dear Money Makers & Robbers, 🤑💰✈️
Based on 🔥Thief Trading style technical and fundamental analysis🔥, here is our master plan to heist the USD/CAD "The Loonie" Forex Bank. Please adhere to the strategy I've outlined in the chart, which emphasizes short entry. Our aim is the high-risk Green Zone. Risky level, oversold market, consolidation, trend reversal, trap at the level where traders and bullish robbers are stronger. 🏆💸Book Profits Be wealthy and safe trade.💪🏆🎉
Entry 📈 : "The heist is on! Wait for the MA breakout then make your move at (1.41400) - Bearish profits await!"
however I advise to Place sell stop orders above the Moving average (or) after the MA level Breakout Place sell limit orders within a 15 or 30 minute timeframe most NEAREST (or) SWING low or high level.
📌I strongly advise you to set an "alert (Alarm)" on your chart so you can see when the breakout entry occurs.
Stop Loss 🛑: "🔊 Yo, listen up! 🗣️ If you're lookin' to get in on a sell stop order, don't even think about settin' that stop loss till after the breakout 🚀. You feel me? Now, if you're smart, you'll place that stop loss where I told you to 📍, but if you're a rebel, you can put it wherever you like 🤪 - just don't say I didn't warn you ⚠️. You're playin' with fire 🔥, and it's your risk, not mine 👊."
📌Thief SL placed at the nearest/swing High or Low level Using the 1H timeframe (1.42800) Day/Swing trade basis.
📌SL is based on your risk of the trade, lot size and how many multiple orders you have to take.
Target 🎯: 1.40000 (or) Escape Before the Target
🧲Scalpers, take note 👀 : only scalp on the Short side. If you have a lot of money, you can go straight away; if not, you can join swing traders and carry out the robbery plan. Use trailing SL to safeguard your money 💰.
💸💵USD/CAD "The Loonie" Forex Bank Heist Plan (Swing/Day Trade) is currently experiencing a bearishness,., driven by several key factors.👇
📰🗞️Get & Read the Fundamental, Macro, COT Report, Quantitative Analysis, Sentimental Outlook, Intermarket Analysis, Future trend targets.. go ahead to check 👉👉👉🔗
⚠️Trading Alert : News Releases and Position Management 📰 🗞️ 🚫🚏
As a reminder, news releases can have a significant impact on market prices and volatility. To minimize potential losses and protect your running positions,
we recommend the following:
Avoid taking new trades during news releases
Use trailing stop-loss orders to protect your running positions and lock in profits
💖Supporting our robbery plan 💥Hit the Boost Button💥 will enable us to effortlessly make and steal money 💰💵. Boost the strength of our robbery team. Every day in this market make money with ease by using the Thief Trading Style.🏆💪🤝❤️🎉🚀
I'll see you soon with another heist plan, so stay tuned 🤑🐱👤🤗🤩

USDCAD Selling not over yet.Last time we looked at the USDCAD pair (March 21, see chart below), we got the most optimal sell entry that easily hit our 1.4000 Target:
As the price broke below its 1D MA200 (orange trend-line) having made a significant correction since the February 03 High, we believe there is more selling to be made at least on the short-term.
That is because the Higher Lows Zone that started on the May 2021 market bottom, hasn't yet been tested and since December 2023, the market always broke inside it before rebounding.
As a result, we expect a new rejection on the 1D MA200, delivering a 1.38200 Target.
-------------------------------------------------------------------------------
** Please LIKE 👍, FOLLOW ✅, SHARE 🙌 and COMMENT ✍ if you enjoy this idea! Also share your ideas and charts in the comments section below! This is best way to keep it relevant, support us, keep the content here free and allow the idea to reach as many people as possible. **
-------------------------------------------------------------------------------
Disclosure: I am part of Trade Nation's Influencer program and receive a monthly fee for using their TradingView charts in my analysis.
💸💸💸💸💸💸
👇 👇 👇 👇 👇 👇

USD/CAD Bearish Trade Setup – Resistance Rejection & Target ProjUSD/CAD Bearish Trade Setup – Key Resistance & Target Projection
Analysis:
Timeframe: 30-minute chart
Current Price: 1.43248
Indicators:
EMA (200, Blue): 1.43024 (Key Dynamic Support)
EMA (30, Red): 1.43142 (Short-term trend)
Resistance Zone (Supply Area): 1.43300 - 1.43450
Support Level (Rejection Zone): 1.43085 - 1.43024
Trade Setup:
Entry Zone: Around the rejection level near 1.43142
Stop Loss: 1.43435 (Above the resistance zone)
Take Profit Target: 1.42355 (EA Target Point)
Projection:
Price is expected to reject the resistance zone, drop below the 200 EMA, and test the lower target at 1.42355.
If price confirms rejection at resistance, a short (sell) opportunity is valid.
A break above the stop-loss level could invalidate the bearish bias.
Conclusion:
Bearish momentum is anticipated if price respects the resistance zone.
Confirmation from price action (candlestick patterns) will strengthen the trade setup.

USDCAD Channel Down aiming for the 1D MA200.The USDCAD pair has been trading within a Channel Down and is currently around the 1D MA50 (blue trend-line) following its latest Lower High formation.
If the current Bearish Leg is as strong as the previous one, we can expect the price to hit at least the 1D MA200 (orange trend-line) at 1.4000.
-------------------------------------------------------------------------------
** Please LIKE 👍, FOLLOW ✅, SHARE 🙌 and COMMENT ✍ if you enjoy this idea! Also share your ideas and charts in the comments section below! This is best way to keep it relevant, support us, keep the content here free and allow the idea to reach as many people as possible. **
-------------------------------------------------------------------------------
💸💸💸💸💸💸
👇 👇 👇 👇 👇 👇

USD/CAD "The Loonie" Forex Market Money Heist Plan🌟Hi! Hola! Ola! Bonjour! Hallo! Marhaba!🌟
Dear Money Makers & Robbers, 🤑💰🐱👤🐱🏍
Based on 🔥Thief Trading style technical and fundamental analysis🔥, here is our master plan to heist the USD/CAD "The Loonie" Forex market. Please adhere to the strategy I've outlined in the chart, which emphasizes short entry. Our aim is the high-risk Green Zone. Risky level, oversold market, consolidation, trend reversal, trap at the level where traders and bullish robbers are stronger. 🏆💸Book Profits Be wealthy and safe trade.💪🏆🎉
Entry 📈 : "The vault is wide open! Swipe the Bearish loot at any price - the heist is on!
however I advise to Place buy limit orders within a 15 or 30 minute timeframe most recent or swing, low or high level. I Highly recommended you to put alert in your chart.
Stop Loss 🛑:
Thief SL placed at the recent / swing low level Using the 4H timeframe (1.44500) swing trade basis.
SL is based on your risk of the trade, lot size and how many multiple orders you have to take.
Target 🎯: 1.39500 (or) Escape Before the Target
🧲Scalpers, take note 👀 : only scalp on the Long side. If you have a lot of money, you can go straight away; if not, you can join swing traders and carry out the robbery plan. Use trailing SL to safeguard your money 💰.
📰🗞️Read the Fundamental, Macro, COT Report, Quantitative Analysis, Intermarket Analysis, Sentimental Outlook before start the plan.
USD/CAD "The Loonie" Forex Market is currently experiencing a bearish trend,., driven by several key factors.
1. Fundamental Analysis
Fundamental analysis evaluates the economic indicators of the United States and Canada that directly impact the USD/CAD exchange rate.
United States Economic Indicators:
GDP Growth: Forecasted at 2.0% to 2.5% for 2025, suggesting steady but slowing economic expansion.
Inflation: Stable at approximately 2.5% to 3.0%, with recent data showing no significant surprises.
Interest Rates: Currently at 4.50%, with the Federal Reserve potentially considering cuts later in 2025 if economic growth weakens.
Trade Balance: The US maintains a persistent trade deficit, though it remains manageable given the broader economic context.
Canada Economic Indicators:
GDP Growth: Projected at 1.0% to 1.5% for 2025, indicating moderate growth heavily tied to commodity exports.
Inflation: Around 2.0%, stable but sensitive to fluctuations in energy prices.
Interest Rates: Set at 3.0%, with the Bank of Canada (BoC) likely to hold steady or adjust slightly based on incoming economic data.
Trade Balance: Mixed, with oil exports being a critical driver of the Canadian Dollar (CAD).
Key Insight: The interest rate differential (4.50% in the US vs. 3.0% in Canada) currently supports the USD. However, declining oil prices—a key factor for Canada—and potential Fed rate cuts introduce uncertainty into the fundamental picture.
2. Macroeconomic Factors
Macroeconomic conditions provide a broader context for currency movements, encompassing global and country-specific trends.
Global GDP Growth: Expected to range between 3.0% and 3.3% in 2025, reflecting moderate global economic expansion.
US Economy: Exhibits signs of slowing growth, with the Federal Reserve adopting a cautious stance, potentially leading to rate cuts if economic conditions deteriorate.
Canadian Economy: Strongly influenced by commodity prices, especially oil, which has faced volatility due to global supply and demand dynamics.
Central Bank Policies: The Fed is in a wait-and-see mode, while the BoC remains data-dependent, with possible rate adjustments if inflation or growth shifts significantly.
Geopolitical Events: Trade tensions, including US-imposed tariffs, could pressure Canada’s economy, potentially weakening the CAD.
Key Insight: Macroeconomic factors present a mixed outlook. Moderate global growth supports risk assets, but trade tensions and central bank caution create uncertainty for USD/CAD.
3. Global Market Analysis
Global market conditions influence currency pairs through risk sentiment and economic interdependencies.
Equity Markets: US and global equity indices are range-bound, reflecting uncertainty and mixed economic signals.
Commodity Prices: Oil prices are under pressure, a bearish factor for the CAD given Canada’s role as a major oil exporter.
Currency Markets: The USD shows strength against some currencies but weakness against others, lacking a dominant trend.
Key Insight: Weak oil prices act as a headwind for the CAD, potentially pushing USD/CAD higher, though broader market uncertainty moderates this effect.
4. Commitment of Traders (COT) Data
COT data offers insights into the positioning of large traders, shedding light on market sentiment.
Large Speculators: Recent trends indicate a net short position on USD/CAD, suggesting bearish sentiment among big players.
Commercial Traders: Positioning is mixed, with some hedging activity reflecting uncertainty in the market.
Market Implications: The net short stance among speculators points to a bearish outlook, but it also raises the possibility of a crowded trade, increasing the risk of a short squeeze if the pair rallies.
Key Insight: Bearish sentiment prevails among large traders, aligning with technical signals, though the concentration of shorts could lead to volatility.
5. Intermarket Analysis
Intermarket analysis examines correlations between USD/CAD and other asset classes.
Oil Prices: A strong inverse correlation exists between USD/CAD and oil prices. Falling oil prices typically strengthen USD/CAD by weakening the CAD.
Commodity Currencies: USD/CAD often aligns with movements in other commodity-linked currencies like AUD/USD and NZD/USD.
Equity Markets: A risk-on environment (rising equities) can pressure the USD downward, while risk-off sentiment bolsters it.
Key Insight: Declining oil prices provide a bullish tilt for USD/CAD, but this is tempered by mixed risk sentiment across global markets.
6. Quantitative Analysis
Quantitative analysis employs technical indicators to assess price trends and momentum.
Moving Averages: The pair is trading below its 50-day and 200-day moving averages, signaling a bearish trend.
RSI (Relative Strength Index): At 45, the RSI is neutral but approaching oversold territory, hinting at potential downside exhaustion.
MACD (Moving Average Convergence Divergence): Positioned in negative territory, indicating bearish momentum.
Chart Patterns: A bear flag pattern has been noted, with a potential downside target near 1.3164, suggesting further declines.
Key Insight: Technical indicators predominantly point to a bearish trend, with the possibility of additional downside if key support levels are breached.
7. Market Sentiment Analysis
Market sentiment reflects the collective psychology of traders and investors.
Trader Sentiment: Surveys and positioning data indicate a bearish bias, with traders anticipating further declines in USD/CAD.
Expert Opinions: Analysts largely recommend selling the pair, citing both technical and fundamental weaknesses.
Social Media Trends: Discussions on platforms like X reveal mixed views, with some predicting a drop to 1.4000 and others warning of potential reversals.
Key Insight: Sentiment leans bearish, consistent with technical indicators and COT data, reinforcing expectations of a downward move.
8. Positioning
Positioning reveals how traders are aligned in the market, influencing potential price dynamics.
Speculative Positions: Likely net short, based on COT data and sentiment surveys, indicating widespread bearish bets.
Institutional Positioning: Mixed, with some institutions hedging against possible USD weakness.
Market Impact: The heavy short positioning could trigger volatility if the pair moves against the consensus, such as in a short squeeze scenario.
Key Insight: Bearish positioning dominates, heightening the risk of a sharp reversal if positive USD catalysts emerge.
9. Next Trend Move
The next likely price movement is derived from current data and market conditions.
Direction: Downward pressure is favored, driven by technical sell signals and bearish sentiment.
Key Levels:
Support: 1.4150; a break below could target 1.4000 or lower.
Resistance: 1.4500; a move above could signal a trend reversal.
Triggers: Upcoming economic data releases, central bank statements, or shifts in oil prices could catalyze the next move.
Key Insight: The next trend move is likely to test lower support levels, potentially reaching 1.39500 if bearish momentum continues.
10. Overall Summary Outlook
Overview: On March 6, 2025, with USD/CAD at 1.43000, the pair exhibits a bearish outlook. Technical indicators, bearish trader positioning, and market sentiment suggest downside risks. However, fundamental factors—such as declining oil prices and potential trade tensions—could provide some support for the pair. The market is at a pivotal point, with price action near key support levels likely to dictate the next direction.
Future Prediction
Trend: Bearish (Short-Term), with Potential for Reversal
Details:
Short-Term: The pair is poised to test support at 1.41500, with a possible decline to 1.39000 if this level breaks. This outlook is driven by technical weakness and bearish sentiment.
Risks: A reversal could occur if oil prices rebound or if US economic data exceeds expectations, potentially pushing the pair toward 1.39000.
Conclusion: The short-term forecast favors a bearish trend, supported by prevailing technical and sentiment signals. However, fundamental factors like oil prices and trade policies could cap downside or trigger a reversal, warranting close monitoring of upcoming data and events.
📌Keep in mind that these factors can change rapidly, and it's essential to stay up-to-date with market developments and adjust your analysis accordingly.
⚠️Trading Alert : News Releases and Position Management 📰 🗞️ 🚫🚏
As a reminder, news releases can have a significant impact on market prices and volatility. To minimize potential losses and protect your running positions,
we recommend the following:
Avoid taking new trades during news releases
Use trailing stop-loss orders to protect your running positions and lock in profits
💖Supporting our robbery plan 💥Hit the Boost Button💥 will enable us to effortlessly make and steal money 💰💵. Boost the strength of our robbery team. Every day in this market make money with ease by using the Thief Trading Style.🏆💪🤝❤️🎉🚀
I'll see you soon with another heist plan, so stay tuned 🤑🐱👤🤗🤩

USDCAD Strong Bearish Breakout!
HI,Traders !
USD-CAD keeps going down
After the strong bearish
Breakout of the key horizontal
Level of 1.42823 which is
Now a resistance and as
We are bearish biased we will
Be expecting a further
Bearish move down!
Comment and subscribe to help us grow !
