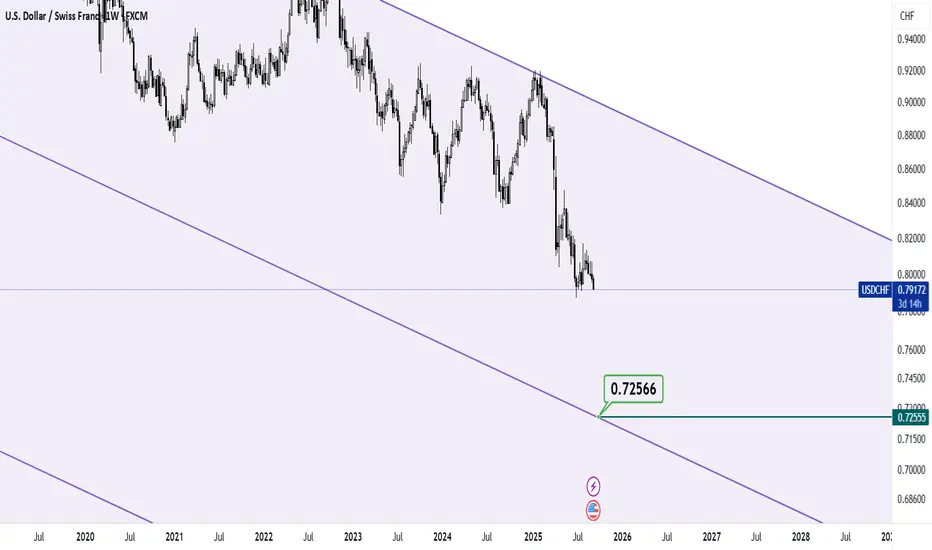
USD/CHF BEARS WILL DOMINATE THE MARKET|SHORT
Hello, Friends!
It makes sense for us to go short on USD/CHF right now from the resistance line above with the target of 0.761 because of the confluence of the two strong factors which are the general downtrend on the previous 1W candle and the overbought situation on the lower TF determined by it’s proximity to the upper BB band.
Disclosure: I am part of Trade Nation's Influencer program and receive a monthly fee for using their TradingView charts in my analysis.
✅LIKE AND COMMENT MY IDEAS✅
Usdchf!

USDCHF H1 | Bullish Bounce Off Key SupportMomentum: Bullish
Price is currently above the ichimoku cloud.
Buy entry: 0.77518
- Pullback support
- 38.2% Fib retracement
- 78.6% Fib projection
Stop Loss: 0.77192
- Overlap support
Take Profit: 0.77899
- Swing high resistance
High Risk Investment Warning
Stratos Markets Limited (fxcm.com/uk), Stratos Europe Ltd (fxcm.com/eu):
CFDs are complex instruments and come with a high risk of losing money rapidly due to leverage. 69% of retail investor accounts lose money when trading CFDs with this provider. You should consider whether you understand how CFDs work and whether you can afford to take the high risk of losing your money.
Stratos Global LLC (fxcm.com/en): Losses can exceed deposits.
Please be advised that the information presented on TradingView is provided to FXCM (‘Company’, ‘we’) by a third-party provider (‘TFA Global Pte Ltd’). Please be reminded that you are solely responsible for the trading decisions on your account. Any information and/or content is intended entirely for research, educational and informational purposes only and does not constitute investment or consultation advice or investment strategy. The information is not tailored to the investment needs of any specific person and therefore does not involve a consideration of any of the investment objectives, financial situation or needs of any viewer that may receive it. Past performance is not a reliable indicator of future results. Actual results may differ materially from those anticipated in forward-looking or past performance statements. We assume no liability as to the accuracy or completeness of any of the information and/or content provided herein and the Company cannot be held responsible for any omission, mistake nor for any loss or damage including without limitation to any loss of profit which may arise from reliance on any information supplied by TFA Global Pte Ltd.
Stratos Trading Pty. Limited (fxcm.com/au):
Trading FX/CFDs carries significant risks. FXCM AU (AFSL 309763), please read the Financial Services Guide, Product Disclosure Statement, Target Market Determination and Terms of Business at fxcm.com/au

USD-CHF Will Grow! Buy!
Hello,Traders!
USDCHF taps a well-defined horizontal demand and shows strong bullish reaction with clean displacement. Selling pressure weakens, hinting at smart money accumulation and a push toward higher liquidity pools. Time Frame 3H.
Buy!
Comment and subscribe to help us grow!
Check out other forecasts below too!
Disclosure: I am part of Trade Nation's Influencer program and receive a monthly fee for using their TradingView charts in my analysis.


USDCHF H4 | Bullish Bounce SetupThe price is falling towards our buy entry level at 0.7693, which is a pullback support that is slightly below the 50% Fibonacci retracement.
Our stop loss is set at 0.7608, which is a swing low support.
Our take profit is set at 0.7861, which is a pullback resistance that aligns with the 61.8% Fibonacci retracement.
High Risk Investment Warning
Stratos Markets Limited fxcm.com Stratos Europe Ltd fxcm.com
CFDs are complex instruments and come with a high risk of losing money rapidly due to leverage. 69% of retail investor accounts lose money when trading CFDs with this provider. You should consider whether you understand how CFDs work and whether you can afford to take the high risk of losing your money.
Stratos Global LLC fxcm.com Losses can exceed deposits.
Please be advised that the information presented on TradingView is provided to FXCM (‘Company’, ‘we’) by a third-party provider (‘TFA Global Pte Ltd’). Please be reminded that you are solely responsible for the trading decisions on your account. Any information and/or content is intended entirely for research, educational and informational purposes only and does not constitute investment or consultation advice or investment strategy. The information is not tailored to the investment needs of any specific person and therefore does not involve a consideration of any of the investment objectives, financial situation or needs of any viewer that may receive it. Past performance is not a reliable indicator of future results. Actual results may differ materially from those anticipated in forward-looking or past performance statements. We assume no liability as to the accuracy or completeness of any of the information and/or content provided herein and the Company cannot be held responsible for any omission, mistake nor for any loss or damage including without limitation to any loss of profit which may arise from reliance on any information supplied by TFA Global Pte Ltd.
Stratos Trading Pty. Limited fxcm.com
Trading FX/CFDs carries significant risks. FXCM AU (AFSL 309763), please read the Financial Services Guide, Product Disclosure Statement, Target Market Determination and Terms of Business at fxcm.com

Bullish reversal setup?USD/CHF is falling towards the support level, which is a pullback support that aligns with the 61.8% Fibonacci retracement and could bounce from this level to our take profit.
Entry: 0.7696
Why we like it:
There is a pullback support level that aligns with the 61.8% Fibonacci retracement.
Stop loss: 0.7599
Why we like it:
There is a swing low support level.
Take profit: 0.7828
Why we like it:
There is a pullback resistance that aligns with the 50% FIbonacci retracement.
Enjoying your TradingView experience? Review us!
Please be advised that the information presented on TradingView is provided to Vantage (‘Vantage Global Limited’, ‘we’) by a third-party provider (‘Everest Fortune Group’). Please be reminded that you are solely responsible for the trading decisions on your account. There is a very high degree of risk involved in trading. Any information and/or content is intended entirely for research, educational and informational purposes only and does not constitute investment or consultation advice or investment strategy. The information is not tailored to the investment needs of any specific person and therefore does not involve a consideration of any of the investment objectives, financial situation or needs of any viewer that may receive it. Kindly also note that past performance is not a reliable indicator of future results. Actual results may differ materially from those anticipated in forward-looking or past performance statements. We assume no liability as to the accuracy or completeness of any of the information and/or content provided herein and the Company cannot be held responsible for any omission, mistake nor for any loss or damage including without limitation to any loss of profit which may arise from reliance on any information supplied by Everest Fortune Group.

USDCHFUSDCHF
- Exp Fiat as an corrective pattern in Short Time Frame
- Fibonacci Level - 61.80%
- Fair Value Gap
- Completed " 123 " Impulsive Waves
- Order Block

XAUUSD: rejection at 5,100🛠 Technical Analysis: On the H4 timeframe, Gold remains in a broader bullish trend, but the latest move shows a sharp reversal from the major 5,600 resistance zone, followed by a heavy bearish impulse. Price has rebounded back into the 5,050–5,100 area, where the chart marks a key resistance/supply zone that is now acting as a selling pivot. This looks like a classic retest after a breakdown: if buyers fail to reclaim and hold above the zone, the correction is likely to resume. The moving averages are still stacked bullishly (SMA50 above SMA100 above SMA200), but price is currently below the SMA50, signaling a corrective phase within the larger uptrend. The projected scenario expects reverse near 5,000–5,100 and then continuation lower toward the next structural support at 4,573.95. If bearish pressure accelerates, the lower support zone around 4,300 becomes the extended downside objective. A clean recovery and sustained hold back above the 5,100 resistance would weaken the sell idea and favor stabilization.
———————————————
❗️ Trade Parameters (SELL)
———————————————
➡️ Entry Point: Sell on rejection from the 5,050–5,100 (more conservative ~4981.32)
🎯 Take Profit: 4,573.95 (extended target: 4,300)
🔴 Stop Loss: 5,252.90
⚠️ Disclaimer: This is a potential trade idea based on current analysis; market conditions and price direction are subject to change based on news factors and volatility.

USDCHF previous support - new resistance The USDCHF currency pair continues to display a bearish outlook, in line with the prevailing downward trend. Recent price action suggests a corrective pullback, potentially setting up for another move lower if resistance holds.
Key Level: 0.7870
This zone, previously a consolidation area, now acts as a significant resistance level.
Bearish Scenario (rejection at 0.7870):
A failed test and rejection at 0.7870 would likely resume the bearish momentum.
Downside targets include:
0.7600 – Initial support
0.7550 – Intermediate support
0.7480 – Longer-term support level
Bullish Scenario (breakout above 0.7870):
A confirmed breakout and daily close above 0.7870 would invalidate the bearish setup.
In that case, potential upside resistance levels are:
0.7890 – First resistance
0.7910 – Further upside target
Conclusion
USDCHF remains under bearish pressure, with the 0.7870 level acting as a key inflection point. As long as price remains below this level, the bias favors further downside. Traders should watch for price confirmation around that level to assess the next move.
This communication is for informational purposes only and should not be viewed as any form of recommendation as to a particular course of action or as investment advice. It is not intended as an offer or solicitation for the purchase or sale of any financial instrument or as an official confirmation of any transaction. Opinions, estimates and assumptions expressed herein are made as of the date of this communication and are subject to change without notice. This communication has been prepared based upon information, including market prices, data and other information, believed to be reliable; however, Trade Nation does not warrant its completeness or accuracy. All market prices and market data contained in or attached to this communication are indicative and subject to change without notice.

USDCHF Sell OANDA:USDCHF
sell reason strong trend line touch
and 1 day retracment for golde zone
100% sell time full margin wait and see

Pullback resistance ahead?Swissie (USD/CHF) is rising towards the pivot, which has been identified as a pullback resistance that aligns with the 61.8% Fibonacci retracement and could reverse to the 1st support.
Pivot: 0.7862
1st Support: 0.7696
1st Resistance: 0.956
Disclaimer:
The opinions given above constitute general market commentary and do not constitute the opinion or advice of IC Markets or any form of personal or investment advice.
Any opinions, news, research, analyses, prices, other information, or links to third-party sites contained on this website are provided on an "as-is" basis, are intended to be informative only, and are not advice, a recommendation, research, a record of our trading prices, an offer of, or solicitation for, a transaction in any financial instrument and thus should not be treated as such. The information provided does not involve any specific investment objectives, financial situation, or needs of any specific person who may receive it. Please be aware that past performance is not a reliable indicator of future performance and/or results. Past performance or forward-looking scenarios based upon the reasonable beliefs of the third-party provider are not a guarantee of future performance. Actual results may differ materially from those anticipated in forward-looking or past performance statements. IC Markets makes no representation or warranty and assumes no liability as to the accuracy or completeness of the information provided, nor any loss arising from any investment based on a recommendation, forecast, or any information supplied by any third party

USDCHF - Anticipating the Price to Bounce off Weekly SupportThe image provided displays a technical analysis chart for the USD/CHF (US Dollar/Swiss Franc) currency pair on a weekly timeframe, showing price consolidation within a triangle pattern.
Chart Analysis and Trading Strategy 📊
The chart indicates the following key technical elements and a potential trading bias:
Currency Pair: USD/CHF. 💴
Pattern: The price action is consolidating within a "Triangle" or symmetrical triangle pattern, characterized by converging trendlines (lower highs and higher lows). This generally indicates a period of market indecision before a potential breakout.
Key Levels: 🎯
Weekly Resistance: A resistance zone is marked near the upper boundary of the triangle. A breakout above the resistance area (around 0.8145 according to recent analysis) would confirm a strong upward movement.
Weekly Support: A support area is indicated near the lower boundary of the triangle (around 0.7865). A break below this support would invalidate the bullish scenario and suggest further decline.
Indicated Bias: The annotation "LOOK FOR LONGS" suggests a bullish bias, anticipating that the price will bounce off the lower trendline/support and eventually break out to the upside. Other recent analyses on the pair also suggest a potential for recovery after testing key support levels. ⬆️

USDCHF: retest 0.76000🛠 Technical Analysis: On the H4 timeframe, USDCHF remains in a clear bearish structure after the “global bearish signal,” with price continuing to trade below the key moving-average cluster. The rebound into the highlighted resistance area (around 0.7755–0.7790) looks like a classic retest after the breakdown, where sellers may defend and resume the downtrend. Price is currently below the SMA 50 and well below the SMA 100/200, confirming that rallies are still corrective. The upper resistance zone near 0.7890 remains the larger supply ceiling and aligns with the higher MA resistance. If price gets rejected from the current resistance band, the next bearish leg is projected toward the marked support at 0.7594. A sustained break and hold above 0.7830–0.7850 would weaken the bearish setup and shift focus to the higher resistance zone.
———————————————
❗️ Trade Parameters (SELL)
———————————————
➡️ Entry Point: Sell on rejection from 0.7755–0.7790 (around 0.77355)
🎯 Take Profit: 0.75942
🔴 Stop Loss: 0.78299
⚠️ Disclaimer: This is a potential trade idea based on current analysis; market conditions and price direction are subject to change based on news factors and volatility.

USDCHF DAILY CHART LONGUSDCHF is currently trading within a clear buy zone, having completed a 100% measured move from the previous downside breakout. This suggests a full exhaustion of the short-side move, making it an ideal area for profit-taking by sellers and potential long entries on the trendline. Additionally, long positions benefit from positive swap, providing a yield advantage while holding the trade.

USDCHF Set To Grow! BUY!
My dear friends,
USDCHF looks like it will make a good move, and here are the details:
The market is trading on 0.7750 pivot level.
Bias - Bullish
Technical Indicators: Supper Trend generates a clear long signal while Pivot Point HL is currently determining the overall Bullish trend of the market.
Goal - 0.7781
Recommended Stop Loss - 0.7733
About Used Indicators:
Pivot points are a great way to identify areas of support and resistance, but they work best when combined with other kinds of technical analysis
Disclosure: I am part of Trade Nation's Influencer program and receive a monthly fee for using their TradingView charts in my analysis.
———————————
WISH YOU ALL LUCK

Is the USDCHF still rising?
Hi my dears
It looks like we are in an opening pattern where there is still room for the dollar to rise and I think we should look for long positions.
What do you think, buddy? Do you agree with me?

USD/CHF – Triangle Breakout Confirmed (30.01.2026)📝 Description🔍 Setup FX:USDCHF
USD/CHF formed a clear Triangle consolidation after a strong bearish move, showing lower highs and higher lows — compression before expansion.
Price has now broken above the descending trendline and is holding structure with a breakout & retest near the support zone.
EMA + Ichimoku support adds confluence for bullish continuation.
📍 Support & Resistance
🟥 Support Zone: 0.7635 – 0.7655
🟢 1st Resistance: 0.7817
🟢 2nd Resistance: 0.7870 – 0.7873
⚠️ Disclaimer
This analysis is for educational purposes only.
Forex trading involves risk — always use proper risk management and trade your plan.
💬 Support the Idea👍 Like if you’re bullish on USD/CHF
💬 Comment: Clean breakout or fake move?🔁 Share with traders watching CHF pairs
#USDCHF #ForexTrading #TriangleBreakout #PriceAction #TechnicalAnalysis #FXTrading #TradingView #Kabhi_TA_Trading

USDCHF oversold bounce towards 0.7870 resistance The USDCHF currency pair continues to display a bearish outlook, in line with the prevailing downward trend. Recent price action suggests a corrective pullback, potentially setting up for another move lower if resistance holds.
Key Level: 0.7870
This zone, previously a consolidation area, now acts as a significant resistance level.
Bearish Scenario (rejection at 0.7870):
A failed test and rejection at 0.7870 would likely resume the bearish momentum.
Downside targets include:
0.7600 – Initial support
0.7550 – Intermediate support
0.7480 – Longer-term support level
Bullish Scenario (breakout above 0.7870):
A confirmed breakout and daily close above 0.7870 would invalidate the bearish setup.
In that case, potential upside resistance levels are:
0.7890 – First resistance
0.7910 – Further upside target
Conclusion
USDCHF remains under bearish pressure, with the 0.7870 level acting as a key inflection point. As long as price remains below this level, the bias favors further downside. Traders should watch for price confirmation around that level to assess the next move.
This communication is for informational purposes only and should not be viewed as any form of recommendation as to a particular course of action or as investment advice. It is not intended as an offer or solicitation for the purchase or sale of any financial instrument or as an official confirmation of any transaction. Opinions, estimates and assumptions expressed herein are made as of the date of this communication and are subject to change without notice. This communication has been prepared based upon information, including market prices, data and other information, believed to be reliable; however, Trade Nation does not warrant its completeness or accuracy. All market prices and market data contained in or attached to this communication are indicative and subject to change without notice.

USDCHF H4 | Bullish ReversalThe price could fall towards our buy entry level at 0.7694, which is a pullback support.
Our stop loss is set at 0.7604, which is a swing low support.
Our take profit is set at 0.7861, which is a pullback resistance that is slightly below the 61.8% Fibonacci retracement.
High Risk Investment Warning
Stratos Markets Limited fxcm.com Stratos Europe Ltd fxcm.com
CFDs are complex instruments and come with a high risk of losing money rapidly due to leverage. 69% of retail investor accounts lose money when trading CFDs with this provider. You should consider whether you understand how CFDs work and whether you can afford to take the high risk of losing your money.
Stratos Global LLC fxcm.com Losses can exceed deposits.
Please be advised that the information presented on TradingView is provided to FXCM (‘Company’, ‘we’) by a third-party provider (‘TFA Global Pte Ltd’). Please be reminded that you are solely responsible for the trading decisions on your account. Any information and/or content is intended entirely for research, educational and informational purposes only and does not constitute investment or consultation advice or investment strategy. The information is not tailored to the investment needs of any specific person and therefore does not involve a consideration of any of the investment objectives, financial situation or needs of any viewer that may receive it. Past performance is not a reliable indicator of future results. Actual results may differ materially from those anticipated in forward-looking or past performance statements. We assume no liability as to the accuracy or completeness of any of the information and/or content provided herein and the Company cannot be held responsible for any omission, mistake nor for any loss or damage including without limitation to any loss of profit which may arise from reliance on any information supplied by TFA Global Pte Ltd.
Stratos Trading Pty. Limited fxcm.com
Trading FX/CFDs carries significant risks. FXCM AU (AFSL 309763), please read the Financial Services Guide, Product Disclosure Statement, Target Market Determination and Terms of Business at fxcm.com

Bearish continuation setup?Swissie (USD/CHF) is rising towards the pivot, which acts as a pullback resistance and could reverse to the 1st support.
Pivot: 0.7899
1st Support: 0.7607
1st Resistance: 0.8145
Disclaimer:
The opinions given above constitute general market commentary and do not constitute the opinion or advice of IC Markets or any form of personal or investment advice.
Any opinions, news, research, analyses, prices, other information, or links to third-party sites contained on this website are provided on an "as-is" basis, are intended to be informative only, and are not advice, a recommendation, research, a record of our trading prices, an offer of, or solicitation for, a transaction in any financial instrument and thus should not be treated as such. The information provided does not involve any specific investment objectives, financial situation, or needs of any specific person who may receive it. Please be aware that past performance is not a reliable indicator of future performance and/or results. Past performance or forward-looking scenarios based upon the reasonable beliefs of the third-party provider are not a guarantee of future performance. Actual results may differ materially from those anticipated in forward-looking or past performance statements. IC Markets makes no representation or warranty and assumes no liability as to the accuracy or completeness of the information provided, nor any loss arising from any investment based on a recommendation, forecast, or any information supplied by any third party

I have an interesting question: Will USDCHF go back to 2011?USDCHF continues to persist in its long-term downward trend since 1970, and any bullish break in this chart has been a good opportunity to sell this symbol, and it seems that the price range formed in 2011 can be considered as a price target in the future.
Potential bullish rise?USD/CHF could fall towards the support level, which is a pullback support, and could bounce from this level to our take profit.
Entry: 0.7696
Why we like it:
There is a pullback support level.
Stop loss: 0.7599
Why we like it:
There is a swing low support level.
Take profit: 0.7828
Why we like it:
There is a pullback resistance level that aligns with the 50% Fibonacci retracement.
Enjoying your TradingView experience? Review us!
Please be advised that the information presented on TradingView is provided to Vantage (‘Vantage Global Limited’, ‘we’) by a third-party provider (‘Everest Fortune Group’). Please be reminded that you are solely responsible for the trading decisions on your account. There is a very high degree of risk involved in trading. Any information and/or content is intended entirely for research, educational and informational purposes only and does not constitute investment or consultation advice or investment strategy. The information is not tailored to the investment needs of any specific person and therefore does not involve a consideration of any of the investment objectives, financial situation or needs of any viewer that may receive it. Kindly also note that past performance is not a reliable indicator of future results. Actual results may differ materially from those anticipated in forward-looking or past performance statements. We assume no liability as to the accuracy or completeness of any of the information and/or content provided herein and the Company cannot be held responsible for any omission, mistake nor for any loss or damage including without limitation to any loss of profit which may arise from reliance on any information supplied by Everest Fortune Group.

USDCHF FREE SIGNAL|SHORT|
✅USDCHF taps premium supply after buy-side liquidity run. Bearish displacement and rejection from the zone suggest mitigation in play, favoring a downside move toward resting sell-side liquidity.
—————————
Entry: 0.7732
Stop Loss: 0.7751
Take Profit: 0.7704
Time Frame: 2H
—————————
SHORT🔥
✅Like and subscribe to never miss a new idea!✅
