Bearish reversal off key resistance?USD/CHF is rising towards the resistance level, which is an overlap resistance that aligns with the 38.2% Fibonacci retracement and could reverse from this level to our take profit.
Entry: 0.7991
Why we like it:
There is an overlap resistance level that aligns with the 38.2% Fibonacci retracement.
Stop loss: 0.8023
Why we like it:
There is a pullback resistance level that lines up with the 61.8% Fibonacci retracement.
Take profit: 0.7932
Why we like it:
There is a pullback support level.
Enjoying your TradingView experience? Review us!
Please be advised that the information presented on TradingView is provided to Vantage (‘Vantage Global Limited’, ‘we’) by a third-party provider (‘Everest Fortune Group’). Please be reminded that you are solely responsible for the trading decisions on your account. There is a very high degree of risk involved in trading. Any information and/or content is intended entirely for research, educational and informational purposes only and does not constitute investment or consultation advice or investment strategy. The information is not tailored to the investment needs of any specific person and therefore does not involve a consideration of any of the investment objectives, financial situation or needs of any viewer that may receive it. Kindly also note that past performance is not a reliable indicator of future results. Actual results may differ materially from those anticipated in forward-looking or past performance statements. We assume no liability as to the accuracy or completeness of any of the information and/or content provided herein and the Company cannot be held responsible for any omission, mistake nor for any loss or damage including without limitation to any loss of profit which may arise from reliance on any information supplied by Everest Fortune Group.
Usdchf!

Will USD/CHF Sustain Its Bullish Structure with Layered Entries?🎯 USD/CHF "THE SWISSY" - BULLISH SWING SETUP | Multi-Layer Entry Strategy 💰
📊 MARKET OVERVIEW
Pair: USD/CHF (The Swissy)
Trade Type: Swing Trade - Bullish Bias
Strategy: Thief's Multi-Layer Entry Method 🎭
🔥 THE SETUP
💎 ENTRY STRATEGY - LAYER METHOD
Using Multiple Buy Limit Orders (Layering Style):
Layer 1: 0.79000 🎯
Layer 2: 0.79200 🎯
Layer 3: 0.79400 🎯
📝 Note: You can add MORE layers based on YOUR capital & risk appetite. This averaging-down approach works when trend aligns with your direction!
🛡️ RISK MANAGEMENT
Thief's Stop Loss: 0.78600 ⚠️
⚠️ IMPORTANT: Ladies & Gentlemen (Thief OG's) - This is MY stop loss level. You MUST adjust YOUR stop loss based on:
Your own risk tolerance
Your account size
Your trading strategy
Your psychology
I'm NOT recommending you copy my SL blindly. Trade at YOUR OWN RISK! 🎲
🎯 PROFIT TARGET
Primary Target: 0.81000 🚀
📍 Why This Level?
Moving Average acting as STRONG resistance zone
Overbought conditions expected
Potential bull trap zone - ESCAPE with profits here!
⚠️ DISCLAIMER: Ladies & Gentlemen (Thief OG's) - This is MY take profit level. You can exit earlier/later based on YOUR strategy. Make money, TAKE money at YOUR OWN RISK! 💪
🔗 CORRELATED PAIRS TO WATCH
📈 POSITIVE CORRELATION (Move Together):
EUR/CHF - Swiss Franc weakness benefits both
GBP/CHF - CHF weakness across the board
DXY (US Dollar Index) - USD strength drives USD/CHF up
📉 INVERSE CORRELATION (Move Opposite):
EUR/USD - When USD strengthens, EUR/USD typically falls
XAU/USD (Gold) - Gold often drops when USD gains
CHF/JPY - Inverse CHF movement
🎯 KEY CORRELATION INSIGHTS:
DXY above 106.00 = Bullish fuel for USD/CHF 🔥
Swiss National Bank dovish = CHF weakness expected
US Treasury Yields rising = USD strength catalyst
Risk-ON sentiment = CHF (safe haven) typically weakens
📊 KEY TECHNICAL FACTORS
✅ Bullish Catalysts:
Multiple support levels holding
USD showing relative strength
CHF facing headwinds from SNB policy
Layer entry allows better average price
⚠️ Watch Out For:
Strong resistance at 0.81000 zone
Potential overbought conditions near target
Risk-OFF events trigger CHF safe-haven demand
SNB surprise interventions
💡 THIEF'S FINAL WORDS
"The market is a device for transferring money from the impatient to the patient."
This is a SWING trade - not a sprint! 🏃♂️
Layer your entries, manage your risk, and let the trade breathe.
Remember:
✅ YOUR money = YOUR rules
✅ YOUR risk = YOUR decision
✅ YOUR profit = YOUR timing
Trade smart, not hard! See you at 0.81000! 🎯💰
#USDCHF #ForexTrading #SwingTrade #TheSwissy #LayeringStrategy #RiskManagement #TradingView #ForexIdeas #PriceAction #TechnicalAnalysis 📈💪🔥
Drop a 🚀 if you're watching this pair! Drop a 💬 with your TP level!

USD/CHF BUYERS WILL DOMINATE THE MARKET|LONG
Hello, Friends!
The BB lower band is nearby so USD-CHF is in the oversold territory. Thus, despite the downtrend on the 1W timeframe I think that we will see a bullish reaction from the support line below and a move up towards the target at around 0.801.
Disclosure: I am part of Trade Nation's Influencer program and receive a monthly fee for using their TradingView charts in my analysis.
✅LIKE AND COMMENT MY IDEAS✅

USDCHF H4 | Bearish Drop In PlayMomentum: Bullish
The price has reacted off the sell entry and is trading below the descending trendline and the Ichimoku cloud.
Sell entry: 0.8026
Pullback resistance.
Stop loss: 0.8063
Pullback resistance.
Take profit: 0.7970
Pullback support
Slightly above the 61.8% Fibonacci retracement.
High Risk Investment Warning
Stratos Markets Limited (tradu.com ), Stratos Europe Ltd (tradu.com ):
CFDs are complex instruments and come with a high risk of losing money rapidly due to leverage. 70% of retail investor accounts lose money when trading CFDs with this provider. You should consider whether you understand how CFDs work and whether you can afford to take the high risk of losing your money.
Stratos Global LLC (tradu.com ): Losses can exceed deposits.
Please be advised that the information presented on TradingView is provided to Tradu (‘Company’, ‘we’) by a third-party provider (‘TFA Global Pte Ltd’). Please be reminded that you are solely responsible for the trading decisions on your account. Any information and/or content is intended entirely for research, educational and informational purposes only and does not constitute investment or consultation advice or investment strategy. The information is not tailored to the investment needs of any specific person and therefore does not involve a consideration of any of the investment objectives, financial situation or needs of any viewer that may receive it. Past performance is not a reliable indicator of future results. Actual results may differ materially from those anticipated in forward-looking or past performance statements. We assume no liability as to the accuracy or completeness of any of the information and/or content provided herein and the Company cannot be held responsible for any omission, mistake nor for any loss or damage including without limitation to any loss of profit which may arise from reliance on any information supplied by TFA Global Pte Ltd.
Update idea
Add note
Tradu
Disclaimer
The information and publications are not meant to be, and do not constitute, financial, investment, trading, or other types of advice or recommendations supplied or endorsed by

USDCHF H4 | Bearish Reversal Off 50% Fibonacci ResistanceMomentum: Bearish
Price has rejected the sell entry, which aligns with the 50% Fibonacci retracement level.
Sell Entry: 0.8043
Pullback resistance
50% Fibonacci retracement
Stop Loss: 0.8063
Pullback resistance
61.8% Fibonacci retracement
Take Profit: 0.7990
Pullback support
High Risk Investment Warning
Stratos Markets Limited (tradu.com), Stratos Europe Ltd (tradu.com ):
CFDs are complex instruments and come with a high risk of losing money rapidly due to leverage. 70% of retail investor accounts lose money when trading CFDs with this provider. You should consider whether you understand how CFDs work and whether you can afford to take the high risk of losing your money.
Stratos Global LLC (tradu.com ): Losses can exceed deposits.
Please be advised that the information presented on TradingView is provided to Tradu (‘Company’, ‘we’) by a third-party provider (‘TFA Global Pte Ltd’). Please be reminded that you are solely responsible for the trading decisions on your account. Any information and/or content is intended entirely for research, educational and informational purposes only and does not constitute investment or consultation advice or investment strategy. The information is not tailored to the investment needs of any specific person and therefore does not involve a consideration of any of the investment objectives, financial situation or needs of any viewer that may receive it. Past performance is not a reliable indicator of future results. Actual results may differ materially from those anticipated in forward-looking or past performance statements. We assume no liability as to the accuracy or completeness of any of the information and/or content provided herein and the Company cannot be held responsible for any omission, mistake nor for any loss or damage including without limitation to any loss of profit which may arise from reliance on any information supplied by TFA Global Pte Ltd.

USDCHF H1 | Falling Towards Pullback SupportMomentum: Bullish
The price is falling towards the buy entry which aligns with the 50% Fibonacci retracement and also trading above the Ichimoku cloud.
Buy entry: 0.8038
Pullback support
50% Fibonacci retracement
Stop loss: 0.8021
Pullback support
Slightly below the 61.8% Fibonacci retracement
Take profit: 0.8068
Pullback resistance
High Risk Investment Warning
Stratos Markets Limited (tradu.com ), Stratos Europe Ltd (tradu.com ):
CFDs are complex instruments and come with a high risk of losing money rapidly due to leverage. 70% of retail investor accounts lose money when trading CFDs with this provider. You should consider whether you understand how CFDs work and whether you can afford to take the high risk of losing your money.
Stratos Global LLC (tradu.com ): Losses can exceed deposits.
Please be advised that the information presented on TradingView is provided to Tradu (‘Company’, ‘we’) by a third-party provider (‘TFA Global Pte Ltd’). Please be reminded that you are solely responsible for the trading decisions on your account. Any information and/or content is intended entirely for research, educational and informational purposes only and does not constitute investment or consultation advice or investment strategy. The information is not tailored to the investment needs of any specific person and therefore does not involve a consideration of any of the investment objectives, financial situation or needs of any viewer that may receive it. Past performance is not a reliable indicator of future results. Actual results may differ materially from those anticipated in forward-looking or past performance statements. We assume no liability as to the accuracy or completeness of any of the information and/or content provided herein and the Company cannot be held responsible for any omission, mistake nor for any loss or damage including without limitation to any loss of profit which may arise from reliance on any information supplied by TFA Global Pte Ltd.

USDCHF H1 | Bearish Reversal SetupMomentum: Bullish
The price has rejected off the sell entry which acts as a pullback resistance.
Sell entry: 0.8069
Pullback resistance
Stop loss: 0.8090
Pullback resistance
Take profit: 0.8037
Pullback support
50% Fibonacci retracement
High Risk Investment Warning
Stratos Markets Limited (tradu.com ), Stratos Europe Ltd (tradu.com ):
CFDs are complex instruments and come with a high risk of losing money rapidly due to leverage. 70% of retail investor accounts lose money when trading CFDs with this provider. You should consider whether you understand how CFDs work and whether you can afford to take the high risk of losing your money.
Stratos Global LLC (tradu.com ): Losses can exceed deposits.
Please be advised that the information presented on TradingView is provided to Tradu (‘Company’, ‘we’) by a third-party provider (‘TFA Global Pte Ltd’). Please be reminded that you are solely responsible for the trading decisions on your account. Any information and/or content is intended entirely for research, educational and informational purposes only and does not constitute investment or consultation advice or investment strategy. The information is not tailored to the investment needs of any specific person and therefore does not involve a consideration of any of the investment objectives, financial situation or needs of any viewer that may receive it. Past performance is not a reliable indicator of future results. Actual results may differ materially from those anticipated in forward-looking or past performance statements. We assume no liability as to the accuracy or completeness of any of the information and/or content provided herein and the Company cannot be held responsible for any omission, mistake nor for any loss or damage including without limitation to any loss of profit which may arise from reliance on any information supplied by TFA Global Pte Ltd.

USDCHF H4 | Bullish Bounce Off Pullbak SupportMomentum: Bearish
The price has bounced off the buy entry which aligns with the 161.8% FIbonacci extension.
Buy entry: 0.7927
Pullback suport
161.8% Fibonacci extneion
Stop loss: 0.7892
Pullback support
Take profit: 0.8005
Pullback resistance
50% FIbonacci reracement
High Risk Investment Warning
Stratos Markets Limited (tradu.com ), Stratos Europe Ltd (tradu.com ):
CFDs are complex instruments and come with a high risk of losing money rapidly due to leverage. 70% of retail investor accounts lose money when trading CFDs with this provider. You should consider whether you understand how CFDs work and whether you can afford to take the high risk of losing your money.
Stratos Global LLC (tradu.com ): Losses can exceed deposits.
Please be advised that the information presented on TradingView is provided to Tradu (‘Company’, ‘we’) by a third-party provider (‘TFA Global Pte Ltd’). Please be reminded that you are solely responsible for the trading decisions on your account. Any information and/or content is intended entirely for research, educational and informational purposes only and does not constitute investment or consultation advice or investment strategy. The information is not tailored to the investment needs of any specific person and therefore does not involve a consideration of any of the investment objectives, financial situation or needs of any viewer that may receive it. Past performance is not a reliable indicator of future results. Actual results may differ materially from those anticipated in forward-looking or past performance statements. We assume no liability as to the accuracy or completeness of any of the information and/or content provided herein and the Company cannot be held responsible for any omission, mistake nor for any loss or damage including without limitation to any loss of profit which may arise from reliance on any information supplied by TFA Global Pte Ltd.

The franc strengthens its position: pressure on the dollarAfter recent strengthening, USDCHF has shifted into a declining phase. The chart shows that upward impulses are losing momentum, while the movement is gradually transitioning into a bearish structure. Sellers are beginning to dominate, limiting growth attempts and pushing the price lower.
Fundamental factors add pressure to the pair. Dollar weakness is linked to expectations of a dovish Federal Reserve policy and the decline of the DXY index, which is losing ground amid weak U.S. economic data. At the same time, the Swiss franc gains support as a safe-haven asset, especially under conditions of geopolitical uncertainty.
An additional signal favoring the downside comes from the technical picture: the breakdown of key levels and the price holding within a bearish channel confirm seller interest.
Thus, USDCHF remains under pressure, and the market’s next steps will determine whether the current decline develops into a sustained downtrend.

USDCHF#USDCHF 1hr timeframe showing some break of trendline structure so i will wait 1 more hour to retest trendline again for the upside movement.

Could we see a bullish reversal from here?USD/CHF has bounced off the support level, which is a pullback support, and could potentially rise from this level to our take profit.
Entry: 0.7925
Why we like it:
There is a pullback support level.
Stop loss: 0.7892
Why we like it:
There is a swing low support level.
Take profit: 0.7991
Why we like it:
There is an overlap resistance that is slightly above the 38.2% Fibonacci retracement.
Enjoying your TradingView experience? Review us!
Please be advised that the information presented on TradingView is provided to Vantage (‘Vantage Global Limited’, ‘we’) by a third-party provider (‘Everest Fortune Group’). Please be reminded that you are solely responsible for the trading decisions on your account. There is a very high degree of risk involved in trading. Any information and/or content is intended entirely for research, educational and informational purposes only and does not constitute investment or consultation advice or investment strategy. The information is not tailored to the investment needs of any specific person and therefore does not involve a consideration of any of the investment objectives, financial situation or needs of any viewer that may receive it. Kindly also note that past performance is not a reliable indicator of future results. Actual results may differ materially from those anticipated in forward-looking or past performance statements. We assume no liability as to the accuracy or completeness of any of the information and/or content provided herein and the Company cannot be held responsible for any omission, mistake nor for any loss or damage including without limitation to any loss of profit which may arise from reliance on any information supplied by Everest Fortune Group.

USDCHF Remains Range-Bound as Momentum WeakensUSDCHF continues to oscillate within a clearly defined horizontal range that has contained price action since mid-summer. The pair is once again pressing into the lower portion of this consolidation zone, following a sharp downswing that reflects renewed bearish pressure within the structure.
The broader trend context remains downward, with price trading below both the 50-day SMA and the 200-day SMA. The 50-day average has acted as dynamic resistance through most of the range, and the 200-day SMA continues to slope lower, reinforcing the longer-term bearish bias even as price fluctuates sideways in the near term.
Momentum indicators align with this softness. The MACD hovers near the zero line, showing weak directional conviction and minimal trend acceleration. The RSI has slipped toward the lower half of its range, suggesting that downside momentum is increasing but not yet stretched into oversold territory. Combined, these readings imply a lack of upward momentum as the pair tests the lower boundary of its multi-month box.
Overall, USDCHF remains in a neutral-to-bearish posture while contained inside its established range. How the market responds around the lower edge of this structure may determine whether consolidation continues or broader trend forces reassert themselves.
-MW

USDCHF | Long IdeaUSDCHF tapped into Previous Weekly Low and showed a reaction.
I am bullish on this so these are the POI's I look for to make entry.
If price closes under this level, I will be looking for lower POI's to find a new entry points.
Let me know what you think.
Stay safe out there and do your own due diligence, this is not investment advise!

Bearish momentum to continue?Swissie (USD/CHF) is rising towards the pivot and could reverse to the 1st support, which aligns with the 127.2% Fibonacci extension.
Pivot: 0.8011
1st Suport: 0.7961
1st Resistance: 0.8036
Disclaimer:
The opinions given above constitute general market commentary and do not constitute the opinion or advice of IC Markets or any form of personal or investment advice.
Any opinions, news, research, analyses, prices, other information, or links to third-party sites contained on this website are provided on an "as-is" basis, are intended to be informative only, and are not advice, a recommendation, research, a record of our trading prices, an offer of, or solicitation for, a transaction in any financial instrument and thus should not be treated as such. The information provided does not involve any specific investment objectives, financial situation, or needs of any specific person who may receive it. Please be aware that past performance is not a reliable indicator of future performance and/or results. Past performance or forward-looking scenarios based upon the reasonable beliefs of the third-party provider are not a guarantee of future performance. Actual results may differ materially from those anticipated in forward-looking or past performance statements. IC Markets makes no representation or warranty and assumes no liability as to the accuracy or completeness of the information provided, nor any loss arising from any investment based on a recommendation, forecast, or any information supplied by any third party

USDCHF - MASTERING THE TRADETeam, it’s been about 7–8 months since we started trading USDCHF together. The first few months were a bit tough — I got stuck at some points — but I kept pushing, spent more time learning about risk, and worked hard to master it.
I’ve mainly been focusing on fundamentals:
Digging into the US economy and the Treasury market
Researching macro trends, especially how overseas demand for the USD plays out
This week, with the US rate cut on the horizon, I called for us to exit USDCHF two days ago — and that decision paid off. We’ve traded really well over these past months, and I’m proud of how far we’ve come.
Here’s the plan moving forward:
Current price: 0.7999 → adding a small portion
More entries planned at 0.7960 and 0.7920
Targets:
🎯 Target 1: 0.8045–0.8065
🎯 Target 2: 0.8078–0.8096
🎯 Target 3: 0.8115–0.8130
We’ve built this strategy step by step, and now it’s time to execute with confidence. Let’s keep the momentum going — LETS GO! 🚀

USDCHF On The Rise! BUY!
My dear followers,
This is my opinion on the USDCHF next move:
The asset is approaching an important pivot point 0.8025
Bias - Bullish
Technical Indicators: Supper Trend generates a clear long signal while Pivot Point HL is currently determining the overall Bullish trend of the market.
Goal - 0.8045
About Used Indicators:
For more efficient signals, super-trend is used in combination with other indicators like Pivot Points.
Disclosure: I am part of Trade Nation's Influencer program and receive a monthly fee for using their TradingView charts in my analysis.
———————————
WISH YOU ALL LUCK

USDCHF pullback ahead of Fed rate decision The USDCHF remains in a bullish trend, with recent price action showing signs of a breakout within the broader uptrend.
Support Zone: 0.7980 – a key level from previous consolidation. Price is currently testing or approaching this level.
A bullish rebound from 0.7980 would confirm ongoing upside momentum, with potential targets at:
0.8060 – initial resistance
0.8070 – psychological and structural level
0.8090 – extended resistance on the longer-term chart
Bearish Scenario:
A confirmed break and daily close below 0.7980 would weaken the bullish outlook and suggest deeper downside risk toward:
0.7960 – minor support
0.7935 – stronger support and potential demand zone
Outlook:
Bullish bias remains intact while the USDCHF holds above 0.7980 A sustained break below this level could shift momentum to the downside in the short term.
This communication is for informational purposes only and should not be viewed as any form of recommendation as to a particular course of action or as investment advice. It is not intended as an offer or solicitation for the purchase or sale of any financial instrument or as an official confirmation of any transaction. Opinions, estimates and assumptions expressed herein are made as of the date of this communication and are subject to change without notice. This communication has been prepared based upon information, including market prices, data and other information, believed to be reliable; however, Trade Nation does not warrant its completeness or accuracy. All market prices and market data contained in or attached to this communication are indicative and subject to change without notice.

A compressed spring on the chart: readiness for a breakoutOn the four-hour chart, USDCHF is forming a “symmetrical triangle” pattern. After a period of consolidation, the price is gradually narrowing its range, indicating energy accumulation ahead of a new impulse.
The triangle is a model of uncertainty, but its completion often leads to a strong move. In the current structure, it is evident that buyers are holding the asset above key levels, which increases the probability of an upward breakout.
Trading tactics for this formation are usually based on waiting for a breakout of the triangle’s boundaries. A close above the upper line opens the scenario for continued growth, while a break below suggests a decline. However, given the overall bias toward dollar strength, the upward breakout remains the priority scenario.
Thus, USDCHF is in a phase of preparation for an impulse, and the upcoming breakout of the triangle will be the key signal for opening positions.

Bullish momentum to extend?USD/CHF has bounced off the pullback support, which could potentially drive it higher to our take profit.
Entry: 0.8047
Why we like it:
There is a pullback support level.
Stop loss: 0.8008
Why we like it:
There is a pullback support level.
Take profit: 0.8110
Why we like it:
There is a swing high resistance level.
Enjoying your TradingView experience? Review us!
Please be advised that the information presented on TradingView is provided to Vantage (‘Vantage Global Limited’, ‘we’) by a third-party provider (‘Everest Fortune Group’). Please be reminded that you are solely responsible for the trading decisions on your account. There is a very high degree of risk involved in trading. Any information and/or content is intended entirely for research, educational and informational purposes only and does not constitute investment or consultation advice or investment strategy. The information is not tailored to the investment needs of any specific person and therefore does not involve a consideration of any of the investment objectives, financial situation or needs of any viewer that may receive it. Kindly also note that past performance is not a reliable indicator of future results. Actual results may differ materially from those anticipated in forward-looking or past performance statements. We assume no liability as to the accuracy or completeness of any of the information and/or content provided herein and the Company cannot be held responsible for any omission, mistake nor for any loss or damage including without limitation to any loss of profit which may arise from reliance on any information supplied by Everest Fortune Group.

Stabilization before a new impulse USDCHF shows signs of strengthening after a period of consolidation. The pair is gradually shifting upward, with impulses becoming more confident, indicating buyer dominance.
Corrective pullbacks remain limited, while upward segments retain stability. This dynamic suggests that the market is building a foundation for continued upward movement.
An additional factor is the demand for the dollar, which supports interest in the asset and increases the likelihood of a new impulsive wave. Thus, USDCHF is in a strengthening phase, where the next steps may define the scale of the bullish trend.

USDCHF: bullish breakout🛠 Technical Analysis: On the 4-hour timeframe, USDCHF triggered a "Global bullish signal" with the completion of a SMA lines (100 and 200), confirming a shift in momentum. The price has successfully broken out of a local descending correction channel and is currently stabilizing above the significant SMA cluster support. The technical setup projects a continuation of the rally towards the immediate resistance at 0.81115, with a potential growth to the 0.8200 handle.
———————————————
❗️ Trade Parameters (BUY)
———————————————
➡️ Entry Point: Approx. 0.8050
🎯 Take Profit: 0.81115 (Resistance), medium-term target at 0.8200
🔴 Stop Loss: Below the recent consolidation structure and SMA cluster (approx. 0.80200)
⚠️ Disclaimer: This is a potential trade idea based on current analysis; market conditions and price direction are subject to change based on news factors and volatility.

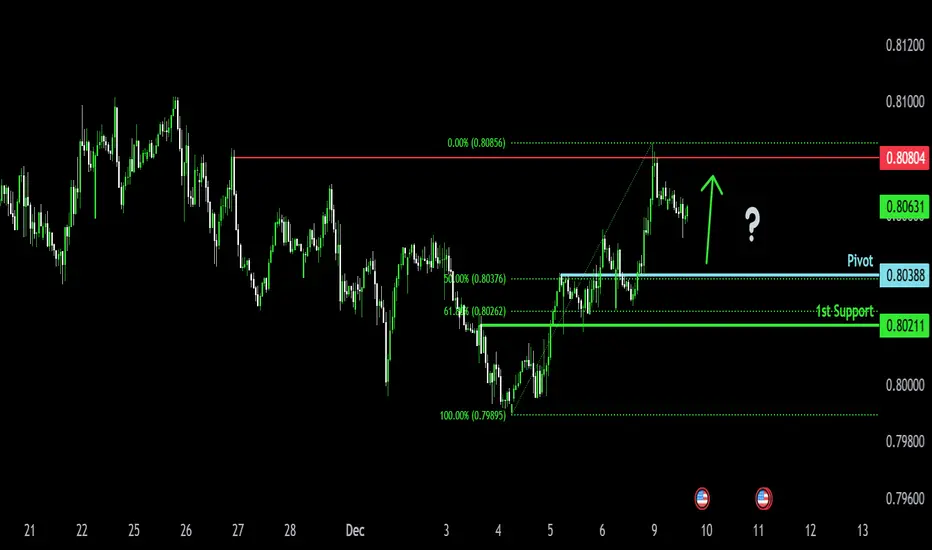
Falling towards 50% Fib support?Swissie (USD/CHF) is falling towards the pivot which has been identiifed as a pullback support and could bounce to the 1st resistance.
Pivot: 0.8038
1st Support: 0.8021
1st Resistance: 0.8080
Disclaimer:
The opinions given above constitute general market commentary and do not constitute the opinion or advice of IC Markets or any form of personal or investment advice.
Any opinions, news, research, analyses, prices, other information, or links to third-party sites contained on this website are provided on an "as-is" basis, are intended to be informative only, and are not advice, a recommendation, research, a record of our trading prices, an offer of, or solicitation for, a transaction in any financial instrument and thus should not be treated as such. The information provided does not involve any specific investment objectives, financial situation, or needs of any specific person who may receive it. Please be aware that past performance is not a reliable indicator of future performance and/or results. Past performance or forward-looking scenarios based upon the reasonable beliefs of the third-party provider are not a guarantee of future performance. Actual results may differ materially from those anticipated in forward-looking or past performance statements. IC Markets makes no representation or warranty and assumes no liability as to the accuracy or completeness of the information provided, nor any loss arising from any investment based on a recommendation, forecast, or any information supplied by any third party
Swissie Breakout Retest: Are Buyers Preparing a Major Push?USD/CHF BULLISH SETUP | HMA Pullback + TMA Breakout Retest (Swing/Day Trade) 🚀
📈 Asset: USD/CHF - "The Swissie"
⏰ Timeframe: 4H & Daily (Swing) / 1H & 15M (Day Entry)
🔄 Style: Bullish Continuation | Pullback & Breakout Retest
⚡ Strategy: "Thief Method" - Layered Limit Order Entry
✨ Executive Summary
A technically sound bullish opportunity is forming on USD/CHF! We are identifying a high-probability pullback to a confluence zone, confirmed by the adaptive Hull Moving Average (HMA) and awaiting a decisive breakout & retest of the Triangular Moving Average (TMA). This plan uses a strategic, risk-managed entry method.
📊 Technical Rationale & Confirmation
✅ Trend Filter: Price above the key Hull Moving Average (HMA) on the 4H chart confirms the primary bullish structure. The current move is treated as a healthy pullback within the uptrend.
🔺 Key Signal: We are watching for a breakout and bullish retest of the Triangular Moving Average (TMA), which often acts as dynamic support in a trend. A successful hold here is our confirmation trigger.
🎯 Precision Entry Zone: The confluence area between 0.8000 - 0.8040 provides a high-value zone for action.
⚔️ Trade Plan: "The Thief" Layered Entry Strategy
This plan uses multiple limit orders to "steal" the best average entry price, scaling into the position.
🟢 ENTRY (Layered Limit Orders):
Layer 1: 0.8040
Layer 2: 0.8020
Layer 3: 0.8000
🔹 Pro Tip: You can adjust the number of layers and prices based on your capital & risk appetite.
⛔ STOP LOSS (Risk Management):
Initial/Thief SL: 0.7970 (Below the entry zone and key structure).
📢 IMPORTANT NOTE, THIEF CREW: I provide a framework, not financial advice. YOU MUST adjust your SL based on your personal risk tolerance and strategy. Protect your capital first! 💰
🎯 TAKE PROFIT Target:
Primary Target: 0.8150 (A strong resistance and potential overbought/trap zone).
Tactical Exit: Consider partial profits on the way up. "Escape with profits" when momentum wanes.
📢 REMINDER: This is MY target based on my analysis. YOU are responsible for your own exits. Take money at your own risk and comfort level.
🌍 Related Pairs & Key Correlations (Must Watch!)
Monitoring correlated pairs increases context and confidence.
FX:EURUSD : NEGATIVE Correlation. If USD/CHF is bullish (USD strong), EURUSD is often bearish. Watch for USD strength confirmation here.
OANDA:EURCHF : POSITIVE Correlation. Often moves in tandem with USD/CHF. A strong Euro can also support CHF pairs. Confirm trend alignment.
FX:GBPUSD : NEGATIVE Correlation. Another major USD pair. Broad USD strength (helping USD/CHF) should pressure GBPUSD lower.
OANDA:XAUUSD (Gold): INVERSE Correlation to USD. A falling Gold price ( OANDA:XAUUSD ) typically signals USD strength, which could support this USD/CHF bullish thesis.
🔑 Key Point: For this USD/CHF bullish idea to thrive, we want to see broad USD strength (DXY ⬆️) and/or CHF weakness against other majors. Watch TVC:DXY for the clearest USD direction clue.
📌 Final Notes & Disclaimer
This is a STRATEGY GUIDE, not a signal.
The "Thief" method smooths your entry but requires discipline.
Always use proper risk management (<1-2% per trade).
Like 👍 and Follow if you find this detailed breakdown useful! It helps the algorithm and keeps more content coming!
Comment below! What's your take on this setup? Are you watching the same correlations?
🚀 Trade Safe, Thief Crew! Let's get those pips!
#Forex #USDCHF #Swissie #TradingView #TradingIdea #SwingTrading #DayTrading #TechnicalAnalysis #HMA #TMA #Breakout #ForexStrategy #RiskManagement
