USDCHF - Looking To Sell Pullbacks In The Short TermH1 - Strong bearish move.
No opposite signs.
Expecting bearish continuation until the two Fibonacci resistance zones hold.
If you enjoy this idea, don’t forget to LIKE 👍, FOLLOW ✅, SHARE 🙌, and COMMENT ✍! Drop your thoughts and charts below to keep the discussion going. Your support helps keep this content free and reach more people! 🚀
-------------------------------------------------------------------------------------------------------------------
Usdchf!

Stop!Loss|Market View: USDCHF🙌 Stop!Loss team welcomes you❗️
In this post, we're going to talk about the near-term outlook for the USDCHF currency pair☝️
Potential trade setup:
🔔Entry level: 0.79540
💰TP: 0.81119
⛔️SL: 0.79070
"Market View" - a brief analysis of trading instruments, covering the most important aspects of the FOREX market.
👇 In the comments 👇 you can type the trading instrument you'd like to analyze, and we'll talk about it in our next posts.
💬 Description: The franc, like most major currency pairs, is looked for a potential buy against the USD. However, its movements in favor of the USD are likely to be more modest than, for example, AUDUSD, NZDUSD, or USDCAD. Nevertheless, there is still buy priority for this pair, and based on current prices, potential long positions can be considered with a target of 0.81120. As an alternative scenario, it's better to look for possible long positions near the support level at 0.78870, but only if an entry point forms (for example, a false breakout).
Thanks for your support 🚀
Profits for all ✅
❗️ Updates on this idea can be found below 👇

Bullish reversal off 61.8% Fibonacci support?USD/CHF is reacting off a support level, which serves as a pullback support aligning with the 61.8% Fibonacci retracement. The pair could potentially rise from this level toward our take-profit target.
Entry: 0.7969
Why we like it:
There is a pullback support that aligns with the 61.8% Fibonacci retracement level.
Stop Loss: 0.7925
There is a swing-low support that aligns with the 78.6% Fibonacci retracement level.
Take Profit: 0.8046
Why we like it:
There is a pullback resistance that aligns with the 50% Fibonacci retracement level.
Enjoying your TradingView experience? Review us!
Please be advised that the information presented on TradingView is provided to Vantage (‘Vantage Global Limited’, ‘we’) by a third-party provider (‘Everest Fortune Group’). Please be reminded that you are solely responsible for the trading decisions on your account. There is a very high degree of risk involved in trading. Any information and/or content is intended entirely for research, educational and informational purposes only and does not constitute investment or consultation advice or investment strategy. The information is not tailored to the investment needs of any specific person and therefore does not involve a consideration of any of the investment objectives, financial situation or needs of any viewer that may receive it. Kindly also note that past performance is not a reliable indicator of future results. Actual results may differ materially from those anticipated in forward-looking or past performance statements. We assume no liability as to the accuracy or completeness of any of the information and/or content provided herein and the Company cannot be held responsible for any omission, mistake nor for any loss or damage including without limitation to any loss of profit which may arise from reliance on any information supplied by Everest Fortune Group.

USDCHF H4 | Bullish Bounce off Key Support USDCHF is currently at our buy entry at 0.8046, which is a pullback support level that aligns with the 38.2% Fibonacci retracement level.
The stop loss is at 0.8019, which is slightly below the 50% Fibonacci retracement level. While the take profit is at 0.8083, which is an overlap resistance level.
We should wait for price to close above our buy entry on the H1 timeframe, before entering buys.
Stratos Markets Limited (tradu.com/uk ):
CFDs are complex instruments and come with a high risk of losing money rapidly due to leverage. 68% of retail investor accounts lose money when trading CFDs with this provider. You should consider whether you understand how CFDs work and whether you can afford to take the high risk of losing your money.
Stratos Europe Ltd (tradu.com/eu ):
CFDs are complex instruments and come with a high risk of losing money rapidly due to leverage. 70% of retail investor accounts lose money when trading CFDs with this provider. You should consider whether you understand how CFDs work and whether you can afford to take the high risk of losing your money.

USDCHF H1 | Bullish Reversal off Key SupportMomentum: Bullish
Price is currently above the ichimoku cloud on the H4 timeframe. Looking to trade off the reversal.
Buy entry: 0.8007
- Strong overlap support
- 61.8% Fib retracement
- 161.8% FIb extension
Stop Loss: 0.7975
- Overlap support
Take Profit: 0.8036
- Pullback resistance
Stratos Markets Limited (tradu.com/uk ):
CFDs are complex instruments and come with a high risk of losing money rapidly due to leverage. 68% of retail investor accounts lose money when trading CFDs with this provider. You should consider whether you understand how CFDs work and whether you can afford to take the high risk of losing your money.
Stratos Europe Ltd (tradu.com/eu ):
CFDs are complex instruments and come with a high risk of losing money rapidly due to leverage. 70% of retail investor accounts lose money when trading CFDs with this provider. You should consider whether you understand how CFDs work and whether you can afford to take the high risk of losing your money.

USD/CHF BULLISH BIAS RIGHT NOW| LONG
Hello, Friends!
We are targeting the 0.804 level area with our long trade on USD/CHF which is based on the fact that the pair is oversold on the BB band scale and is also approaching a support line below thus going us a good entry option.
Disclosure: I am part of Trade Nation's Influencer program and receive a monthly fee for using their TradingView charts in my analysis.
✅LIKE AND COMMENT MY IDEAS✅

USD/CHF: Bearish Drop to 0.7988?FX:USDCHF is showing bearish potential on the 4-hour chart , with price testing a downward trendline as resistance, converging near a good entry point and resistance zone, setting up for a possible downside continuation if sellers regain control amid recent consolidation. This alignment suggests weakening upside momentum in the safe-haven pair.
Entry zone between 0.8051-0.8061 for a short position. Target at 0.7988 near the support zone, providing a risk-reward ratio of approximately 1:2 . Set a stop loss on a close above 0.8084 to safeguard against a reversal. 🌟 Watch for confirmation via a rejection at the entry with increasing volume, driven by USD dynamics against CHF.
Fundamentally , today we have the US PCE annual and monthly indices , released on October 31, 2025, at 12:30 UTC, which could influence USD strength. Additionally, on November 3, 2025, Switzerland's Consumer Price Index will be published, potentially creating volatility in this pair. 💡
📝 Trade Plan:
🎯 Entry Zone: 0.8051 – 0.8061 (short setup near resistance & trendline)
❌ Stop Loss: Close above 0.8084
✅ Target: 0.7988 (support / take profit zone)
💎 Risk-to-Reward: Approximately 1:2, ideal for a clean technical play.
What's your take on this setup? Share below! 👇

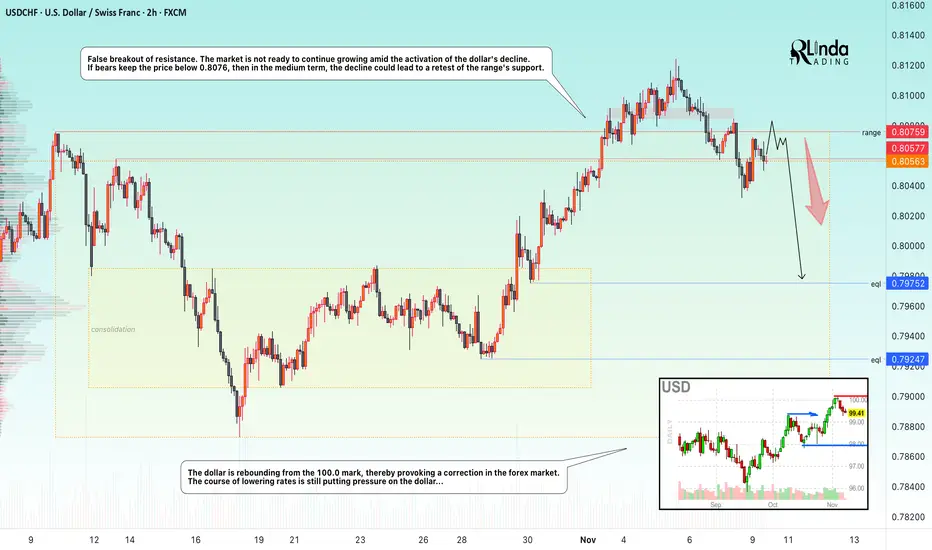
USDCHF → Manipulation? False breakout of resistance FX:USDCHF attempted to take advantage of the trend reversal opportunity after breaking out of a descending wedge, but the weak dollar hindered the rally...
The currency pair is facing resistance at 0.8076. There is no continuation of the momentum towards a breakout, and bearish pressure, which is intensifying as the dollar index declines, is negatively affecting the currency pair. The price has returned to the trading range, with an emphasis on 0.8057 - 0.8076. If the bears keep the price below this zone, this move could trigger further sell-offs.
Resistance levels: 0.8057, 0.8076
Support levels: 0.7957, 0.7925
The false breakout confirms that sellers currently have the upper hand and buyers lack the strength to push the price higher. Accordingly, consolidation below the key level could trigger a further decline towards the zone of interest at 0.7975.
Best regards, R. Linda!
USD/CHF Bulls Charge Forward – Key Breakout Setup Unfolding🎯 USD/CHF "THE SWISSY" - FOREX PROFIT PATHWAY SETUP
Bullish Momentum | Day Trade | Moving Average Breakout Confirmed
📊 TRADE SETUP OVERVIEW
🔔 Asset: USD/CHF (The Swiss Franc Pair)
📈 Bias: BULLISH ✅
⏱️ Timeframe: Intraday (Day Trade)
🎲 Strategy: Moving Average Breakout + Layered Entry System
💡 ANALYSIS BREAKDOWN
The USD/CHF has successfully confirmed a bullish breakout above key Moving Average resistance levels. Price structure indicates a strong push higher with multiple confluence zones supporting upward momentum. The setup respects recent market structure and provides a clean risk-to-reward opportunity for tactical intraday traders.
🎪 ENTRY STRATEGY - "The Thief Method" 💼
Layered Buy Limit Entry System (Multiple Order Placement):
🔹 Layer 1: Buy Limit @ 0.80000
🔹 Layer 2: Buy Limit @ 0.80250
🔹 Layer 3: Buy Limit @ 0.80500
🔹 Layer 4: Buy Limit @ 0.80750
💡 Pro Tip: Adjust layers based on your risk tolerance and account size. Scale into positions rather than going all-in.
🛑 STOP LOSS - "The Thief's Insurance" 🎯
Stop Loss Level: 0.79500
Reasoning: Previous market structure | Nearest Lower Low | Candle Wick consideration
This SL respects mechanical support and provides defined risk parameters.
🚨 TAKE PROFIT - "Police Barricade Zone" 💰
Target Level: 0.81900
Resistance Indicators:
Strong Historical Resistance 📍
Overbought Zone Alert ⚠️
Profit Taking Trap Zone 🎣
⚡ Recommendation: Consider taking partial profits at 0.81900 to secure gains before potential pullback.
📌 RELATED PAIRS TO MONITOR 🌍
Correlated Pairs & Key Levels:
💵
EURCHF
- Watch for inverse correlation; if USD/CHF rallies, EUR/CHF often consolidates. Key level: 0.94500
📊
GBPCHF
- Similar dynamics; acts as confirmation. Watch resistance near 1.08200
🎲
USDJPY
- Risk sentiment indicator; strong risk-on when USD/CHF pushes higher. Level: 155.500
🔗 CHF Crosses Generally - When USD strengthens, all CHF pairs weaken; observe overall CHF weakness
🧠 KEY TECHNICAL POINTS
✅ Moving Average Alignment - Price above key MA(s) = bullish continuation signal
✅ Breakout Confirmation - Clear resistance break with momentum
✅ Risk/Reward Ratio - Favorable setup with defined entry zones
✅ Layering Advantage - Multiple entries reduce average cost and emotional decision-making
✅ Structure Respect - SL places at logical market structure levels
⚠️ IMPORTANT DISCLAIMERS & NOTES
🎪 "Thief Style" Trading Strategy - This is a tactical, fun-oriented approach to forex trading. NOT financial advice.
Risk Warning:
🔴 Past performance ≠ Future results
🔴 Forex trading involves substantial risk of loss
🔴 Position sizing is YOUR responsibility
🔴 Stop losses and take profits are RECOMMENDATIONS, not guarantees
🔴 Only risk capital you can afford to lose
Your Trading Journey:
YOUR entry decisions = YOUR profits/losses
YOUR stop loss placement = YOUR risk management
YOUR take profit timing = YOUR discipline
Manage your own risk. Make your own choices. Own your results.
🌐 CORRELATION & WATCHLIST
Monitor these instruments for USD/CHF confirmation:
🇺🇸 DXY (US Dollar Index) - Strength confirmation
🇨🇭 SNB Policy - Swiss National Bank decisions = CHF mover
📊 Interest Rate Differentials - USD vs CHF rate spreads
🎯 Risk Sentiment - Risk-on favors USD, risk-off favors CHF
✨ If you find value in my analysis, a 👍 and 🚀 boost is much appreciated — it helps me share more setups with the community!
#USDCHF #ForexTrading #DayTrading #TechnicalAnalysis #BullishSetup #MovingAverage #Breakout #ThiefStyle #SwissFranc #TradingCommunity #FXTrading #RiskManagement #TradingPlan #ProfitPathway

USD-CHF Bullish Rebound! Buy!
Hello,Traders!
USDCHF is showing reaction off a key demand reaccumulation block after a strong displacement move, hinting at potential short-term retracement toward the inefficiency above. Time Frame 4H.
Buy!
Comment and subscribe to help us grow!
Check out other forecasts below too!
Disclosure: I am part of Trade Nation's Influencer program and receive a monthly fee for using their TradingView charts in my analysis.

USD/CHF - Trendline Rejection (10.11.2025)📊 Setup Overview : FX:USDCHF
USD/CHF continues to respect the descending trendline and Ichimoku cloud resistance, signaling potential downside pressure. Price is currently retesting the resistance zone (0.8070–0.8085) — a strong supply area that has rejected multiple times.As long as this zone holds, we expect a move toward the next support zones.
🧭 Trade Plan
Bias: 🔻 Sell / Short-term Bearish
Entry Zone: 0.8060 – 0.8080 (wait for confirmation candle or rejection)
Target 1 (1st Support): 0.8015
Target 2 (2nd Support): 0.7995
Invalidation: Break and close above 0.8085 (Resistance Zone)
⚡ Fundamental Updates
1️⃣ U.S. Treasury yields eased slightly as consumer confidence declined.
2️⃣ Markets now price a 66% chance of a rate cut in December, according to CME’s FedWatch Tool.
3️⃣ U.S. government shutdown concerns keep the dollar under mild pressure as investors watch debt issuance risk.
💬 Summary
A clear trendline rejection combined with fundamental USD weakness supports a short bias.
Wait for confirmation before entering — patience protects capital.
⚠️ Disclaimer
This analysis is for educational purposes only and not financial advice.
Always do your own research and manage risk wisely.
📢 Support My Work
💚 Like, Comment & Share this idea to motivate more chart updates!
🧠 “Charts Don’t Lie, Traders Don’t Quit.”
#USDCHF #ForexAnalysis #TradingView #PriceAction #Trendline #Ichimoku #TechnicalAnalysis #ForexTrader #Fundamentals #SwingTrading #KABHI_TA_TRADING

USDCHF Is Very Bullish! Buy!
Here is our detailed technical review for USDCHF.
Time Frame: 4h
Current Trend: Bullish
Sentiment: Oversold (based on 7-period RSI)
Forecast: Bullish
The market is on a crucial zone of demand 0.803.
The oversold market condition in a combination with key structure gives us a relatively strong bullish signal with goal 0.807 level.
P.S
The term oversold refers to a condition where an asset has traded lower in price and has the potential for a price bounce.
Overbought refers to market scenarios where the instrument is traded considerably higher than its fair value. Overvaluation is caused by market sentiments when there is positive news.
Like and subscribe and comment my ideas if you enjoy them!

USDCHFUSDCHF
- Bearish Channel as an corrective pattern in Short Time Frame
- Support Level
- RSI - Divergence
- Double Bottom in Long Time Frame
- Completed " 12345 " Impulsive Waves and " ABC " Corrective Waves

USDCHF What Next? BUY!
My dear followers,
I analysed this chart on USDCHF and concluded the following:
The market is trading on 0.8037 pivot level.
Bias - Bullish
Technical Indicators: Both Super Trend & Pivot HL indicate a highly probable Bullish continuation.
Target - 0.8048
Safe Stop Loss - 0.8031
About Used Indicators:
A super-trend indicator is plotted on either above or below the closing price to signal a buy or sell. The indicator changes color, based on whether or not you should be buying. If the super-trend indicator moves below the closing price, the indicator turns green, and it signals an entry point or points to buy.
Disclosure: I am part of Trade Nation's Influencer program and receive a monthly fee for using their TradingView charts in my analysis.
———————————
WISH YOU ALL LUCK

Bearish drop off?Swissie (USD/CHF) has rejected off the pivot, which acts as a pullback resistance and could drop to the 1st support.
Pivot: 0.8076
1st Support: 0.8009
1st Resistance: 0.8127
Disclaimer:
The above opinions given constitute general market commentary, and do not constitute the opinion or advice of IC Markets or any form of personal or investment advice.
Any opinions, news, research, analyses, prices, other information, or links to third-party sites contained on this website are provided on an "as-is" basis, are intended only to be informative, is not an advice nor a recommendation, nor research, or a record of our trading prices, or an offer of, or solicitation for a transaction in any financial instrument and thus should not be treated as such. The information provided does not involve any specific investment objectives, financial situation and needs of any specific person who may receive it. Please be aware, that past performance is not a reliable indicator of future performance and/or results. Past Performance or Forward-looking scenarios based upon the reasonable beliefs of the third-party provider are not a guarantee of future performance. Actual results may differ materially from those anticipated in forward-looking or past performance statements. IC Markets makes no representation or warranty and assumes no liability as to the accuracy or completeness of the information provided, nor any loss arising from any investment based on a recommendation, forecast or any information supplied by any third-party.

USD-CHF Free Signal! Sell!
Hello,Traders!
USDCHF is retracing from a horizontal supply area after internal liquidity sweep. Smart money traders may look for a bearish continuation toward 0.8017 as liquidity below equal lows gets targeted.
---------------------
Stop Loss: 0.8077
Take Profit: 0.8017
Entry: 0.8048
Time Frame: 5H
---------------------
Sell!
Comment and subscribe to help us grow!
Check out other forecasts below too!
Disclosure: I am part of Trade Nation's Influencer program and receive a monthly fee for using their TradingView charts in my analysis.

Evening Doji Star Sets On USDCHF, Price To FollowOn Wednesday, November 5th, Price on OANDA:USDCHF rose and tested the Resistance Level that's been overhead since August. Today with the decline in price on the Daily, suggests that we are looking at a very strong 3 Candlestick Pattern, the Evening Star Doji!
The Evening Star Doji is a Bearish Reversal Candlestick Pattern consisting of 3 candles: first being a large Bullish candle, second is a Doji candle representing the indecision between Bulls and Bears then followed by the 3rd candle being a large Bearish Candle, meaning Bears have overcome the Bulls.
Now if Price really is to reverse, the following candle after this pattern is formed should be a Bearish one, considering the Confirmation candle will confirm the reversal in price and continue to fall!

USDCHF uptrend continuation supported at 0.8026The USDChf remains in a bullish trend, with recent price action indicating a potential breakout rally within the broader uptrend.
Support Zone: 0.8026 – a key level from previous consolidation. Price is currently testing or approaching this level.
A bullish rebound from 0.8026 would confirm ongoing upside momentum, with potential targets at:
0.8085 – initial resistance
0.8105 – psychological and structural level
0.8125 – extended resistance on the longer-term chart
Bearish Scenario:
A confirmed break and daily close below 0.8026 would weaken the bullish outlook and suggest deeper downside risk toward:
0.8010 – minor support
0.7990 – stronger support and potential demand zone
Outlook:
Bullish bias remains intact while the USDCHF holds above 0.8026. A sustained break below this level could shift momentum to the downside in the short term.
This communication is for informational purposes only and should not be viewed as any form of recommendation as to a particular course of action or as investment advice. It is not intended as an offer or solicitation for the purchase or sale of any financial instrument or as an official confirmation of any transaction. Opinions, estimates and assumptions expressed herein are made as of the date of this communication and are subject to change without notice. This communication has been prepared based upon information, including market prices, data and other information, believed to be reliable; however, Trade Nation does not warrant its completeness or accuracy. All market prices and market data contained in or attached to this communication are indicative and subject to change without notice.

USDCHF H4 | Bearish Reversal Off Pullback ResistanceMomentum: Bearish
Price is currently reacting to a sell entry at a pullback resistance level that aligns with the 38.2% Fibonacci retracement.
Sell Entry: 0.8068 (Pullback resistance, 38.2% Fibonacci retracement
Stop Loss: 0.8125
Swing high resistance
Take Profit: 0.8007
Overlap support, slightly above the 50% Fibonacci retracement.
Stratos Markets Limited (tradu.com ):
CFDs are complex instruments and come with a high risk of losing money rapidly due to leverage. 68% of retail investor accounts lose money when trading CFDs with this provider. You should consider whether you understand how CFDs work and whether you can afford to take the high risk of losing your money.
Stratos Europe Ltd (tradu.com ):
CFDs are complex instruments and come with a high risk of losing money rapidly due to leverage. 70% of retail investor accounts lose money when trading CFDs with this provider. You should consider whether you understand how CFDs work and whether you can afford to take the high risk of losing your money.

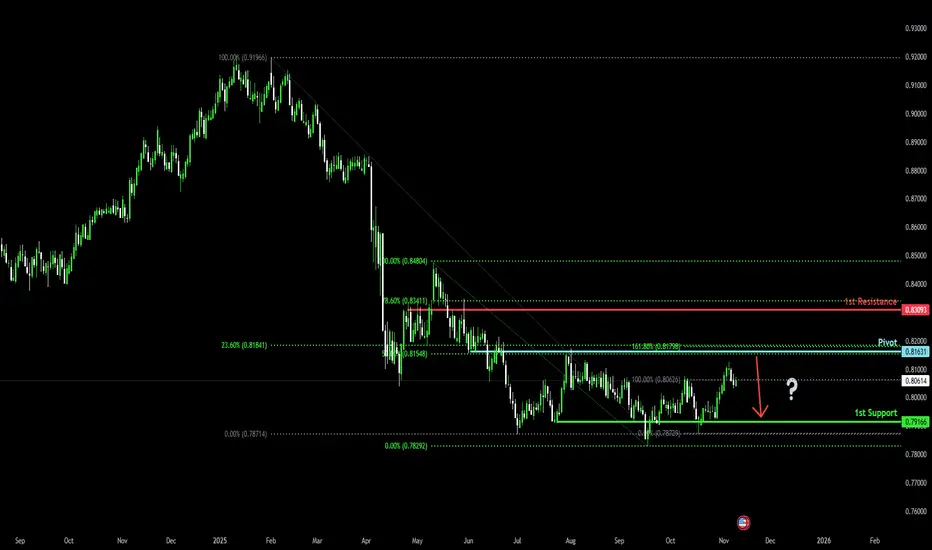
Bearish reversal off Fibonacci confluence?USD/CHF (Swissie) is rising toward the pivot level, which serves as an overlap resistance. A reversal from this area could see the pair decline toward the 1st support, which acts as a pullback support.
Pivot: 0.8163
1st Support: 0.7916
1st Resistance: 0.8309
Disclaimer:
The above opinions given constitute general market commentary, and do not constitute the opinion or advice of IC Markets or any form of personal or investment advice.
Any opinions, news, research, analyses, prices, other information, or links to third-party sites contained on this website are provided on an "as-is" basis, are intended only to be informative, is not an advice nor a recommendation, nor research, or a record of our trading prices, or an offer of, or solicitation for a transaction in any financial instrument and thus should not be treated as such. The information provided does not involve any specific investment objectives, financial situation and needs of any specific person who may receive it. Please be aware, that past performance is not a reliable indicator of future performance and/or results. Past Performance or Forward-looking scenarios based upon the reasonable beliefs of the third-party provider are not a guarantee of future performance. Actual results may differ materially from those anticipated in forward-looking or past performance statements. IC Markets makes no representation or warranty and assumes no liability as to the accuracy or completeness of the information provided, nor any loss arising from any investment based on a recommendation, forecast or any information supplied by any third-party.
USDCHF | Sell limit at cpr levelsa nice trade, needs attention to risk but it is quite beautiful
If the limit opens, I'll wait a bit to raise the BE.

USDCHF 4H: CRTH to CRTL—The Bearish FVG TrapThe USDCHF 4-hour chart is presenting a high-probability sell setup that aligns perfectly with the Candle 3 (Distribution) phase of the CRT model. Price has aggressively broken down after reaching a local high, a move that is characteristic of a smart money reversal. This initial break left behind a clear Fair Value Gap (FVG), marking our ideal re-entry zone before the major downside expansion. We are positioning to join the move from a premium price.
The Bearish Trade Thesis: Selling the Retracement
The core of this strategy is to sell into the expected price retracement to the FVG, securing a premium entry price. The market is anticipated to pull back and fill the imbalance in the FVG box (roughly 0.80514 to 0.80800). This move back up is the final Manipulation phase (Candle 2) designed to trap late buyers. We will monitor the price action for a clear rejection within this zone, confirming the entry for the massive downward push.
Risk Management and Targets
Our risk is strictly defined by the structural high of the move, aligning with the concept of using the Trend Start (TS) for the Stop Loss. The CRTH-TS at 0.80514 defines the low end of the invalidation zone. A clean close above the upper boundary of the FVG would suggest the bearish intent is temporarily paused or invalidated, serving as our Stop Loss (SL). The target for this trade is the swing low CRTL (Control Low) at 0.79238. This level represents a critical low-liquidity objective where the smart money is expected to take profit, offering an outstanding risk-reward opportunity.
Greetings,
MrYounity

Bearish drop off pullback resistance?USD/CHF is rising towards the resistance level, which is a pullback resistance and could drop from this level to our take profit.
Entry: 0.8065
Why we like it:
There is a pullback resistance level.
Stop loss: 0.8122
Why we like it:
There is a swing high resistance level.
Take profit: 0.8003
Why we like it:
There is an overlap support that aligns with the 50% Fibonacci retracement.
Enjoying your TradingView experience? Review us!
Please be advised that the information presented on TradingView is provided to Vantage (‘Vantage Global Limited’, ‘we’) by a third-party provider (‘Everest Fortune Group’). Please be reminded that you are solely responsible for the trading decisions on your account. There is a very high degree of risk involved in trading. Any information and/or content is intended entirely for research, educational and informational purposes only and does not constitute investment or consultation advice or investment strategy. The information is not tailored to the investment needs of any specific person and therefore does not involve a consideration of any of the investment objectives, financial situation or needs of any viewer that may receive it. Kindly also note that past performance is not a reliable indicator of future results. Actual results may differ materially from those anticipated in forward-looking or past performance statements. We assume no liability as to the accuracy or completeness of any of the information and/or content provided herein and the Company cannot be held responsible for any omission, mistake nor for any loss or damage including without limitation to any loss of profit which may arise from reliance on any information supplied by Everest Fortune Group.
