“EUR/USD 15m Outlook | Bullish Bias from Demand ZonePrice is currently balancing between the demand zone (buyers at 1.1607 – 1.1635) and the supply zone (1.1680 – 1.1720).
📌 If demand holds → Expect liquidity grab → retest → bullish continuation into supply.
📌 If supply reacts → Watch for rejection → intraday shorts possible before next rally.
This setup is not about guessing direction — it’s about hacking the structure: let price tell the story, then follow the flow.
USDCHF

USDCHF Will Go Higher From Support! Long!
Please, check our technical outlook for USDCHF.
Time Frame: 9h
Current Trend: Bullish
Sentiment: Oversold (based on 7-period RSI)
Forecast: Bullish
The market is approaching a significant support area 0.805.
The underlined horizontal cluster clearly indicates a highly probable bullish movement with target 0.810 level.
P.S
The term oversold refers to a condition where an asset has traded lower in price and has the potential for a price bounce.
Overbought refers to market scenarios where the instrument is traded considerably higher than its fair value. Overvaluation is caused by market sentiments when there is positive news.
Disclosure: I am part of Trade Nation's Influencer program and receive a monthly fee for using their TradingView charts in my analysis.
Like and subscribe and comment my ideas if you enjoy them!

Key Level for USDCHF: 0.8125USDCHF has been trending down since late 2021 and is currently near the lower end of its trend channel. Low inflation and a weak dollar index have contributed to the downward pressure seen in 2025. The Swiss National Bank (SNB) has avoided reintroducing negative rates, and the latest inflation data may support keeping rates at zero. Yearly CPI remains at 0.2 percent, still in positive territory, but barely. According to SNB Vice Chair Antoine Martin, they do not see any risk of deflation at the moment, and forecasts suggest an uptick in inflation in the coming quarters.
Still, the 39 percent US tariff poses a significant problem for Switzerland, which counts the US as its largest single-country trading partner, or second if Europe is considered as a whole. This year’s weak dollar index, combined with very high tariffs, may create challenges for exporters. The saving grace is the exemption of gold and pharmaceuticals, which are by far Switzerland’s largest exports. According to the Financial Times, the effective average tariff is slightly above 12 percent. When combined with the Swiss franc’s 11 percent gain against the dollar, the burden on exporters remains heavy.
Following the tariff shock, services PMI collapsed while manufacturing PMI held relatively steady. In Monday’s update, both manufacturing and services showed signs of recovery, although services PMI still indicated a rapid contraction. The data supports expectations for the SNB to hold rates at the September meeting.
USDCHF bounced more than 2 percent from the lower boundary of the channel, breaking above the 2025 downward trendline before retesting it multiple times. The chart suggests USDCHF is attempting an upward reaction. If the SNB maintains its stance despite low inflation, that would be bullish for the franc, but a possible hawkish Fed rate cut at the September meeting are likely to have a larger effect on the currency and could trigger a breakout. The biggest obstacle is the 76.4 percent parallel of the trendline, currently at 0.8125, which may become the key resistance level to watch for USDCHF bulls.

Bullish bounce off?The Swissie (USD/CHF) has bounced off the pivot which acts as a pullback support and could potentially rise to the 1st resistance.
Pivot: 0.8024
1st Support: 0.7981
1st Resistance: 0.8088
Risk Warning:
Trading Forex and CFDs carries a high level of risk to your capital and you should only trade with money you can afford to lose. Trading Forex and CFDs may not be suitable for all investors, so please ensure that you fully understand the risks involved and seek independent advice if necessary.
Disclaimer:
The above opinions given constitute general market commentary, and do not constitute the opinion or advice of IC Markets or any form of personal or investment advice.
Any opinions, news, research, analyses, prices, other information, or links to third-party sites contained on this website are provided on an "as-is" basis, are intended only to be informative, is not an advice nor a recommendation, nor research, or a record of our trading prices, or an offer of, or solicitation for a transaction in any financial instrument and thus should not be treated as such. The information provided does not involve any specific investment objectives, financial situation and needs of any specific person who may receive it. Please be aware, that past performance is not a reliable indicator of future performance and/or results. Past Performance or Forward-looking scenarios based upon the reasonable beliefs of the third-party provider are not a guarantee of future performance. Actual results may differ materially from those anticipated in forward-looking or past performance statements. IC Markets makes no representation or warranty and assumes no liability as to the accuracy or completeness of the information provided, nor any loss arising from any investment based on a recommendation, forecast or any information supplied by any third-party.

USDCHF Long Selling IdeaHello Traders
In This Chart USDCHF HOURLY Forex Forecast By FOREX PLANET
today USDCHF analysis 👆
🟢This Chart includes_ (USDCHF market update)
🟢What is The Next Opportunity on USDCHF Market
🟢how to Enter to the Valid Entry With Assurance Profit
This CHART is For Trader's that Want to Improve Their Technical Analysis Skills and Their Trading By Understanding How To Analyze The Market Using Multiple Timeframes and Understanding The Bigger Picture on the Chart

Supply and Demand Game ...Both Parabolic Sar and Stochastic indicators show bear investors are interested in the market. Now market in down trend lets see who wins bears or Bulls

Market Analysis: USD/CHF Targets Fresh UpsideMarket Analysis: USD/CHF Targets Fresh Upside
USD/CHF is rising and might aim for a move toward 0.8100.
Important Takeaways for USD/CHF Analysis Today
- USD/CHF is showing positive signs above the 0.8020 zone.
- There was a break above a connecting bearish trend line with resistance at 0.8000 on the hourly chart.
USD/CHF Technical Analysis
On the hourly chart of USD/CHF, the pair declined from the 0.8075 barrier and tested the 0.7985 zone. The US Dollar traded as low as 0.7983 and recently started a fresh increase against the Swiss Franc.
The pair climbed above 0.8020 and the 50-hour simple moving average. There was a break above the 50% Fib retracement level of the downward move from the 0.8076 swing high to the 0.7983 low. Besides, there was a break above a connecting bearish trend line with resistance at 0.8000.
The bulls are now facing hurdles near the 76.4% Fib retracement at 0.8055. The next major area of interest could be 0.8075. The main sell region could be near 0.8100.
If there is a clear break above 0.8100 and the RSI remains above 50, the pair could start another increase. In the stated case, it could test 0.8150.
If there is another decline, the pair might test the 50-hour simple moving average at 0.8020. The first major support on the USD/CHF chart is near 0.8000. A downside break below 0.8000 might spark bearish moves. The next major support is 0.7880. Any more losses may possibly open the doors for a move toward 0.7840 in the near term.
This article represents the opinion of the Companies operating under the FXOpen brand only. It is not to be construed as an offer, solicitation, or recommendation with respect to products and services provided by the Companies operating under the FXOpen brand, nor is it to be considered financial advice.

USDCHF H4 | Bullish bounce underwayBased on the H4 chart analysis, we could see the price fall to the buy entry, which his a pullback support that aligns with the 50% Fibonacci retracement and could bounce from this level to the upside.
Buy entry is at 0.8024, which is a pullback support that lines up with the 50% Fibonacci retracement.
Stop loss is at 0.7983, which is a pullback support.
Take profit is at 0.8104, which is a swing high resistance.
High Risk Investment Warning
Trading Forex/CFDs on margin carries a high level of risk and may not be suitable for all investors. Leverage can work against you.
Stratos Markets Limited (tradu.com ):
CFDs are complex instruments and come with a high risk of losing money rapidly due to leverage. 65% of retail investor accounts lose money when trading CFDs with this provider. You should consider whether you understand how CFDs work and whether you can afford to take the high risk of losing your money.
Stratos Europe Ltd (tradu.com ):
CFDs are complex instruments and come with a high risk of losing money rapidly due to leverage. 66% of retail investor accounts lose money when trading CFDs with this provider. You should consider whether you understand how CFDs work and whether you can afford to take the high risk of losing your money.
Stratos Global LLC (tradu.com ):
Losses can exceed deposits.
Please be advised that the information presented on TradingView is provided to Tradu (‘Company’, ‘we’) by a third-party provider (‘TFA Global Pte Ltd’). Please be reminded that you are solely responsible for the trading decisions on your account. There is a very high degree of risk involved in trading. Any information and/or content is intended entirely for research, educational and informational purposes only and does not constitute investment or consultation advice or investment strategy. The information is not tailored to the investment needs of any specific person and therefore does not involve a consideration of any of the investment objectives, financial situation or needs of any viewer that may receive it. Kindly also note that past performance is not a reliable indicator of future results. Actual results may differ materially from those anticipated in forward-looking or past performance statements. We assume no liability as to the accuracy or completeness of any of the information and/or content provided herein and the Company cannot be held responsible for any omission, mistake nor for any loss or damage including without limitation to any loss of profit which may arise from reliance on any information supplied by TFA Global Pte Ltd.
The speaker(s) is neither an employee, agent nor representative of Tradu and is therefore acting independently. The opinions given are their own, constitute general market commentary, and do not constitute the opinion or advice of Tradu or any form of personal or investment advice. Tradu neither endorses nor guarantees offerings of third-party speakers, nor is Tradu responsible for the content, veracity or opinions of third-party speakers, presenters or participants.

USD_CHF WILL GROW|LONG|
✅USD_CHF made a retest
Of the demand level below
At 0.8030 from where we
Are already seeing a bullish
Rebound so we will be expecting
A further bullish move up
LONG🚀
✅Like and subscribe to never miss a new idea!✅

Bullish bounce off?USD/CHF has bounced off the support level which is a pullback support and could rise from this level to our take profit.
Entry: 0.8024
Why we like it:
There is a pullback support level.
Stop loss: 0.7982
Why we like it:
There is a pullback support level.
Take profit: 0.8103
Why we like it:
There is a swing high resistance level.
Enjoying your TradingView experience? Review us!
Please be advised that the information presented on TradingView is provided to Vantage (‘Vantage Global Limited’, ‘we’) by a third-party provider (‘Everest Fortune Group’). Please be reminded that you are solely responsible for the trading decisions on your account. There is a very high degree of risk involved in trading. Any information and/or content is intended entirely for research, educational and informational purposes only and does not constitute investment or consultation advice or investment strategy. The information is not tailored to the investment needs of any specific person and therefore does not involve a consideration of any of the investment objectives, financial situation or needs of any viewer that may receive it. Kindly also note that past performance is not a reliable indicator of future results. Actual results may differ materially from those anticipated in forward-looking or past performance statements. We assume no liability as to the accuracy or completeness of any of the information and/or content provided herein and the Company cannot be held responsible for any omission, mistake nor for any loss or damage including without limitation to any loss of profit which may arise from reliance on any information supplied by Everest Fortune Group.
Take profit: 0.8103
Why we like it:
There is a swing high resistance.

USDCHF: Bearish Forecast & Outlook
The charts are full of distraction, disturbance and are a graveyard of fear and greed which shall not cloud our judgement on the current state of affairs in the USDCHF pair price action which suggests a high likelihood of a coming move down.
Disclosure: I am part of Trade Nation's Influencer program and receive a monthly fee for using their TradingView charts in my analysis.
❤️ Please, support our work with like & comment! ❤️

USDCHF Will Go Higher From Support! Long!
Please, check our technical outlook for USDCHF.
Time Frame: 12h
Current Trend: Bullish
Sentiment: Oversold (based on 7-period RSI)
Forecast: Bullish
The market is trading around a solid horizontal structure 0.804.
The above observations make me that the market will inevitably achieve 0.810 level.
P.S
We determine oversold/overbought condition with RSI indicator.
When it drops below 30 - the market is considered to be oversold.
When it bounces above 70 - the market is considered to be overbought.
Disclosure: I am part of Trade Nation's Influencer program and receive a monthly fee for using their TradingView charts in my analysis.
Like and subscribe and comment my ideas if you enjoy them!

USD/CHF - Wedge Breakout (02.09.2025)The USD/CHF pair on the M30 timeframe presents a Potential Buying Opportunity due to a recent Formation of a Wedge Breakout Pattern. This suggests a shift in momentum towards the upside and a higher likelihood of further advances in the coming hours.
Possible Long Trade:
Entry: Consider Entering A Long Position around Trendline Of The Pattern.
Target Levels:
1st Resistance – 0.8048
2nd Resistance – 0.8067
🎁 Please hit the like button and
🎁 Leave a comment to support for My Post !
Your likes and comments are incredibly motivating and will encourage me to share more analysis with you.
Best Regards, KABHI_TA_TRADING
Thank you.
Disclosure: I am part of Trade Nation's Influencer program and receive a monthly fee for using their TradingView charts in my analysis.

Bullish bounce off key support?The Swissie (USD/CHF) has bounced off the pivot and could rise to the 1st resistance.
Pivot: 0.7989
1st Support: 0.7942
1st Resistance: 0.8068
Risk Warning:
Trading Forex and CFDs carries a high level of risk to your capital and you should only trade with money you can afford to lose. Trading Forex and CFDs may not be suitable for all investors, so please ensure that you fully understand the risks involved and seek independent advice if necessary.
Disclaimer:
The above opinions given constitute general market commentary, and do not constitute the opinion or advice of IC Markets or any form of personal or investment advice.
Any opinions, news, research, analyses, prices, other information, or links to third-party sites contained on this website are provided on an "as-is" basis, are intended only to be informative, is not an advice nor a recommendation, nor research, or a record of our trading prices, or an offer of, or solicitation for a transaction in any financial instrument and thus should not be treated as such. The information provided does not involve any specific investment objectives, financial situation and needs of any specific person who may receive it. Please be aware, that past performance is not a reliable indicator of future performance and/or results. Past Performance or Forward-looking scenarios based upon the reasonable beliefs of the third-party provider are not a guarantee of future performance. Actual results may differ materially from those anticipated in forward-looking or past performance statements. IC Markets makes no representation or warranty and assumes no liability as to the accuracy or completeness of the information provided, nor any loss arising from any investment based on a recommendation, forecast or any information supplied by any third-party.

USDCHF - Demand Zone Meets Falling Wedge!USDCHF is approaching a key demand zone while trading inside a falling wedge pattern.
The price is now retesting the intersection of support and structure, a high-probability area where buyers may step in.
As long as this zone holds, I’ll be looking for long opportunities targeting a potential bounce back toward the upper boundary of the wedge.
⚠️ A break below the demand zone would invalidate this bullish setup and open the door for lower levels.
📚 Always follow your trading plan regarding entry, risk management, and trade management.
Good luck!
All Strategies Are Good; If Managed Properly!
~Richard Nasr

USD/CHF BEARS ARE GAINING STRENGTH|SHORT
USD/CHF SIGNAL
Trade Direction: short
Entry Level: 0.804
Target Level: 0.799
Stop Loss: 0.807
RISK PROFILE
Risk level: medium
Suggested risk: 1%
Timeframe: 2h
Disclosure: I am part of Trade Nation's Influencer program and receive a monthly fee for using their TradingView charts in my analysis.
✅LIKE AND COMMENT MY IDEAS✅

USDCHF H4 |Bearish Continuation Setting UpThe Swissie (USD/CHF) has rejected off the sell entry, which acts as an overlap resistance and could potentially drop from this lvle ot the downside.
Sell entry is at 0.8018, which is an overlap resistance.
Stop loss is at 0.8103, which is a swing high resistance.
Take profit is at 0.7924, which is a multi swing low support.
High Risk Investment Warning
Trading Forex/CFDs on margin carries a high level of risk and may not be suitable for all investors. Leverage can work against you.
Stratos Markets Limited (tradu.com ):
CFDs are complex instruments and come with a high risk of losing money rapidly due to leverage. 65% of retail investor accounts lose money when trading CFDs with this provider. You should consider whether you understand how CFDs work and whether you can afford to take the high risk of losing your money.
Stratos Europe Ltd (tradu.com ):
CFDs are complex instruments and come with a high risk of losing money rapidly due to leverage. 66% of retail investor accounts lose money when trading CFDs with this provider. You should consider whether you understand how CFDs work and whether you can afford to take the high risk of losing your money.
Stratos Global LLC (tradu.com):
Losses can exceed deposits.
Please be advised that the information presented on TradingView is provided to Tradu (‘Company’, ‘we’) by a third-party provider (‘TFA Global Pte Ltd’). Please be reminded that you are solely responsible for the trading decisions on your account. There is a very high degree of risk involved in trading. Any information and/or content is intended entirely for research, educational and informational purposes only and does not constitute investment or consultation advice or investment strategy. The information is not tailored to the investment needs of any specific person and therefore does not involve a consideration of any of the investment objectives, financial situation or needs of any viewer that may receive it. Kindly also note that past performance is not a reliable indicator of future results. Actual results may differ materially from those anticipated in forward-looking or past performance statements. We assume no liability as to the accuracy or completeness of any of the information and/or content provided herein and the Company cannot be held responsible for any omission, mistake nor for any loss or damage including without limitation to any loss of profit which may arise from reliance on any information supplied by TFA Global Pte Ltd.
The speaker(s) is neither an employee, agent nor representative of Tradu and is therefore acting independently. The opinions given are their own, constitute general market commentary, and do not constitute the opinion or advice of Tradu or any form of personal or investment advice. Tradu neither endorses nor guarantees offerings of third-party speakers, nor is Tradu responsible for the content, veracity or opinions of third-party speakers, presenters or participants.

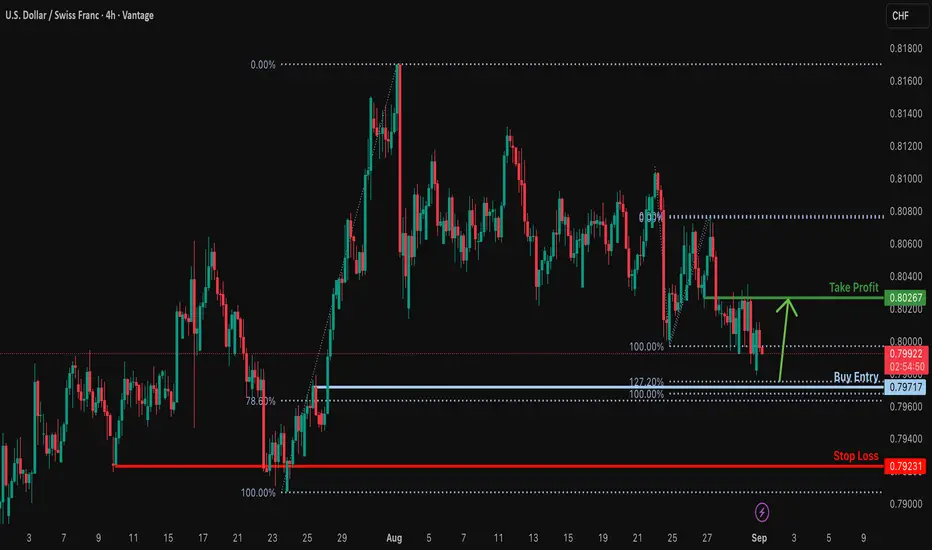
Falling towards Fibonacci confluence?USD/CHF is falling towards the support level which is a pullback suport that lines up with the 127.2% Fibonacci extension, 100% Fibonacci projection and the 78.6% Fibonacci retracement and could bounce from this levle to our take profit.
Entry: 0.7971
Why we like it:
There is a pullback support that lines up with the 127.2% Fibonacci extension, 100% Fibonacci projection and the 78.6% Fibonacci retracement.
Stop loss: 0.7923
Why we like it:
There is a multi-swing low support.
Take profit: 0.8026
Why we like it:
There is a pullback resistance.
Enjoying your TradingView experience? Review us!
Please be advised that the information presented on TradingView is provided to Vantage (‘Vantage Global Limited’, ‘we’) by a third-party provider (‘Everest Fortune Group’). Please be reminded that you are solely responsible for the trading decisions on your account. There is a very high degree of risk involved in trading. Any information and/or content is intended entirely for research, educational and informational purposes only and does not constitute investment or consultation advice or investment strategy. The information is not tailored to the investment needs of any specific person and therefore does not involve a consideration of any of the investment objectives, financial situation or needs of any viewer that may receive it. Kindly also note that past performance is not a reliable indicator of future results. Actual results may differ materially from those anticipated in forward-looking or past performance statements. We assume no liability as to the accuracy or completeness of any of the information and/or content provided herein and the Company cannot be held responsible for any omission, mistake nor for any loss or damage including without limitation to any loss of profit which may arise from reliance on any information supplied by Everest Fortune Group.
Bearish continuation in play?The Swissie (USD/CHF) has rejected off the pivot, which acts as an overlap resistance and could potentially drop to the 1st support.
Pivot: 0.8084
1st Support: 0.7894
1st Resistance: 0.8198
Risk Warning:
Trading Forex and CFDs carries a high level of risk to your capital and you should only trade with money you can afford to lose. Trading Forex and CFDs may not be suitable for all investors, so please ensure that you fully understand the risks involved and seek independent advice if necessary.
Disclaimer:
The above opinions given constitute general market commentary, and do not constitute the opinion or advice of IC Markets or any form of personal or investment advice.
Any opinions, news, research, analyses, prices, other information, or links to third-party sites contained on this website are provided on an "as-is" basis, are intended only to be informative, is not an advice nor a recommendation, nor research, or a record of our trading prices, or an offer of, or solicitation for a transaction in any financial instrument and thus should not be treated as such. The information provided does not involve any specific investment objectives, financial situation and needs of any specific person who may receive it. Please be aware, that past performance is not a reliable indicator of future performance and/or results. Past Performance or Forward-looking scenarios based upon the reasonable beliefs of the third-party provider are not a guarantee of future performance. Actual results may differ materially from those anticipated in forward-looking or past performance statements. IC Markets makes no representation or warranty and assumes no liability as to the accuracy or completeness of the information provided, nor any loss arising from any investment based on a recommendation, forecast or any information supplied by any third-party.

USDCHF H4 | Possible Bearish Reversal IncomingThe Swissie (USD/CHF) is reacting off the sell entry, which is a pullback resistance that aligns with the 38.2% Fibonacci retracement and could reverse from this level to the downside.
Sell entry is at 0.8030, which is a pullback resistance that lines up with the 38.2% Fibonacci retracement.
Stop loss is at 0.8103, which is a swing high resistance that aligns with the 127.2% Fibonacci extension.
Take profit is at 0.7945, which is a pullback support that lines up with the 161.8% Fibonacci extension.
High Risk Investment Warning
Trading Forex/CFDs on margin carries a high level of risk and may not be suitable for all investors. Leverage can work against you.
Stratos Markets Limited (tradu.com ):
CFDs are complex instruments and come with a high risk of losing money rapidly due to leverage. 65% of retail investor accounts lose money when trading CFDs with this provider. You should consider whether you understand how CFDs work and whether you can afford to take the high risk of losing your money.
Stratos Europe Ltd (tradu.com ):
CFDs are complex instruments and come with a high risk of losing money rapidly due to leverage. 66% of retail investor accounts lose money when trading CFDs with this provider. You should consider whether you understand how CFDs work and whether you can afford to take the high risk of losing your money.
Stratos Global LLC (tradu.com ):
Losses can exceed deposits.
Please be advised that the information presented on TradingView is provided to Tradu (‘Company’, ‘we’) by a third-party provider (‘TFA Global Pte Ltd’). Please be reminded that you are solely responsible for the trading decisions on your account. There is a very high degree of risk involved in trading. Any information and/or content is intended entirely for research, educational and informational purposes only and does not constitute investment or consultation advice or investment strategy. The information is not tailored to the investment needs of any specific person and therefore does not involve a consideration of any of the investment objectives, financial situation or needs of any viewer that may receive it. Kindly also note that past performance is not a reliable indicator of future results. Actual results may differ materially from those anticipated in forward-looking or past performance statements. We assume no liability as to the accuracy or completeness of any of the information and/or content provided herein and the Company cannot be held responsible for any omission, mistake nor for any loss or damage including without limitation to any loss of profit which may arise from reliance on any information supplied by TFA Global Pte Ltd.
The speaker(s) is neither an employee, agent nor representative of Tradu and is therefore acting independently. The opinions given are their own, constitute general market commentary, and do not constitute the opinion or advice of Tradu or any form of personal or investment advice. Tradu neither endorses nor guarantees offerings of third-party speakers, nor is Tradu responsible for the content, veracity or opinions of third-party speakers, presenters or participants.

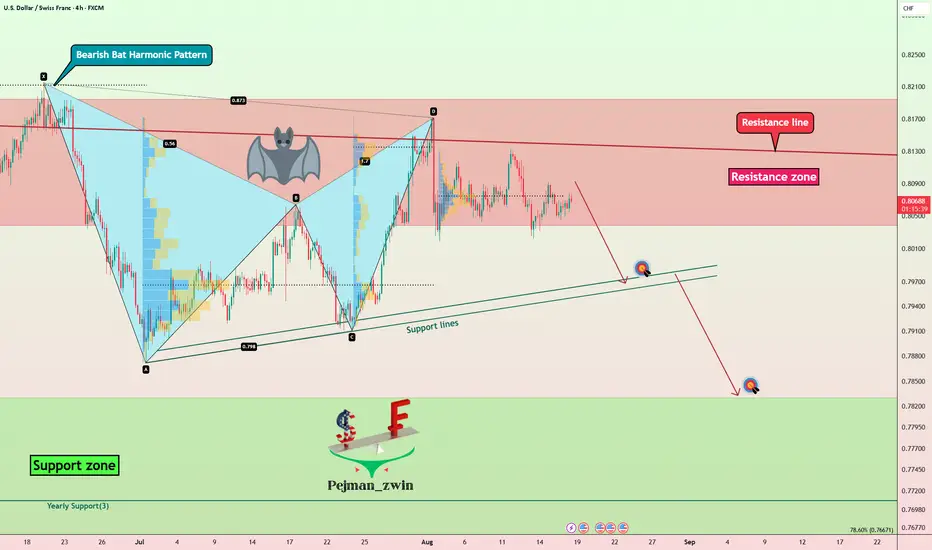
Bearish Bat Pattern Forms – USDCHF Looks Ready to DropToday, I want to review USDCHF ( OANDA:USDCHF ) and lay out the fundamental and technical reasons supporting a Short position bias.
1-Fed policy expectations are the main focus — attention is on the Jackson Hole symposium and signals about the Fed’s path; this has tilted market pricing toward a less hawkish Fed.
2-Dovish bets weigh on the USD — markets are pricing in a softer Fed outlook (rate-cut expectations/pauses), which weakens the dollar.
3-CHF supported by safe-haven flows — amid global uncertainty, the Swiss franc tends to attract demand; SNB’s stance also matters for medium-term flows.
Fundamental takeaway: weaker USD (on Fed expectations) + safe-haven CHF demand = a reinforced bearish case for USDCHF in the short term.
-----------------------------------------------
Now let's take a look at the USDCHF chart on the 4-hour time frame .
USDCHF is trading in the Resistance zone(0.819 CHF-0.804 CHF) and near the Resistance line .
It also looks like USDCHF could continue its downtrend with the help of the Bearish Bat Harmonic Pattern .
I expect USDCHF to decline at least to the Support lines .
Second Target: Support zone(0.783 CHF-0.767 CHF)
Note: Stop Loss(SL): 0.818 CHF
Please respect each other's ideas and express them politely if you agree or disagree.
U.S Dollar/Swiss Franc Analysis (USDCHF), 4-hour time frame.
Be sure to follow the updated ideas.
Do not forget to put a Stop loss for your positions (For every position you want to open).
Please follow your strategy and updates; this is just my Idea, and I will gladly see your ideas in this post.
Please do not forget the ✅' like '✅ button 🙏😊 & Share it with your friends; thanks, and Trade safe.
USDCHF BUY TREND LONG POSITIONFormed a triangle for accumulation, now its broken and gave view it going to go upside slowly. So Buy USD for long time investment now

USD/CHF - Sell Trade Setup📉 USD/CHF – Sell Setup Breakdown
🔎 Bias
Currently leaning bearish. Price rejected from a higher-timeframe supply and continues to respect the descending trendline. Structure is pointing toward deeper liquidity grabs before any major reversal.
🏗 Technical Breakdown
Wave Structure: We completed Wave (4) inside a major supply zone and are now unfolding lower.
Liquidity Hunt: Multiple sweeps of liquidity have been taken on the upside. Current price is gravitating toward sell-side liquidity (SSL) marked below.
Fibonacci Confluence: Rejection aligned with the 71% retracement – classic continuation sell level.
Trendline Respect: Every attempt to break higher has been capped by the diagonal resistance.
🎯 Sell Zones
Entry Area: Any retracement back into the minor supply box (grey zone under the trendline).
Target 1: Sell-side liquidity resting below recent equal lows.
Target 2: Extended push toward the bigger demand block lower (the shaded SSS zone).
⚠️ Risk Notes
If price cleanly breaks and holds above the trendline + supply zone, the bearish idea invalidates.
Best confluence comes from waiting for rejection wicks / bearish order flow before entry.
