USDCHFUSDCHF
- Exp Fiat as an corrective pattern in Short Time Frame
- Fibonacci Level - 61.80%
- Fair Value Gap
- Completed " 123 " Impulsive Waves
- Order Block
Usdchfidea

USDCHF Sell OANDA:USDCHF
sell reason strong trend line touch
and 1 day retracment for golde zone
100% sell time full margin wait and see

USDCHFUSDCHF
- Bearish Channel as an corrective pattern in Short Time Frame
- Break of Structure
- RSI - Divergence
- Completed " 123 " Impulsive Waves
- Fibonacci Level - 38.20% / 50.00%

USDCHF - IT HAS BEEN A LONG TIMETeam, it has been a long time
It is the best buying range at 0.7834-0.7828
Target 1 at 0.7800-0.7910
Target 2 at 0.7940-0.7960
Target 3 at 0.8000-0.8040
The price has been reached last 3-4 months ago.
LETS GO

USD/CHF Price Outlook – Trade Setup📊 Technical Structure
OANDA:USDCHF USD/CHF remains under downside pressure after a sharp selloff from the recent highs. Price rebounded briefly from the 0.7888–0.7880 support zone but failed to sustain upside momentum, and is now stalling beneath the 0.7925–0.7936 resistance zone.
The broader structure still points to a bearish continuation bias. The recent recovery appears corrective in nature, forming a lower high beneath resistance. As long as price remains capped below the resistance zone, the pair is vulnerable to renewed selling pressure toward the lower support area.
🎯 Trade Setup (Bearish Bias)
Entry Zone: 0.7925 – 0.7936
Stop Loss: 0.7940
Take Profit 1: 0.7888
Take Profit 2: 0.7880
Risk–Reward Ratio: Approx. 1 : 2.41
📌 Invalidation
A sustained break and close above 0.7940 would invalidate the bearish setup and signal a deeper upside recovery.
🌐 Macro Background
The short-term macro backdrop remains unfavourable for USD/CHF. The US Dollar continues to weaken amid uncertainty surrounding President Trump’s upcoming announcement of the next Federal Reserve Chairman, raising concerns that future Fed leadership may lean toward a more politically accommodative policy stance.
Additionally, the Swiss Franc has found relative support after Swiss National Bank (SNB) Chairman Martin Schlegel warned that negative inflation prints are possible this year, while downplaying the likelihood of a return to negative interest rates. This has reinforced CHF’s defensive appeal in the near term.
Although the US Dollar briefly regained ground after the EU–US Greenland dispute was de-escalated and tariff threats were rolled back, broader sentiment toward the Greenback remains fragile, keeping downside risks dominant for USD/CHF.
🔑 Key Technical Levels
Resistance Zone: 0.7925 – 0.7936
Support Zone: 0.7888 – 0.7880
Bearish Invalidation: Above 0.7940
📌 Trade Summary
USD/CHF is trading beneath a key resistance zone after a corrective rebound from support. As long as price remains capped below 0.7936, the bias favours a sell-on-rallies approach, targeting a renewed move lower toward the 0.7900–0.7888 support region.
⚠️ Disclaimer
This analysis is for reference only and does not constitute investment or trading advice. Financial markets involve risk, and traders should manage positions according to their own risk tolerance.

Is USD/CHF Preparing for a Momentum Shift Higher?🔥 USDD/CHF – “THE SWISSY” | Swing + DAY Trade Guide (Bullish Plan) 🇺🇸💵🇨🇭💎
📌 Current Context (London Time):
USD/CHF is hovering around key zones near 0.790-0.795 — showing volatility influenced by strong CHF demand and mixed USD data.
🧠 TRADE PLAN – THIEF LAYER STRATEGY
🎯 Bias: Bullish reversal play (swing & intraday)
Entry Strategy:
We’re stacking buy limits in thief layer style (take multiple fills instead of one entry):
🎯 Buy Limit Layers:
⚡ 0.79100
⚡ 0.79200
⚡ 0.79400
(You can add more layers based on your risk appetite)
📉 SL (Thief Style):
🚫 Stop Loss @ 0.79000 – designed as your last line of defense
📈 Target Zone (Take Profit):
🚀 Primary Target @ 0.79900
Price squeeze up to this level where resistance from moving averages + overbought pressure likely kicks in.
⚠️ Risk Advisory:
📌 All risk decisions are yours — trade your plan, not my words. Thief OG’s take profits and losses at their own risk.
🔗 PAIRS TO WATCH (Correlation & Confirmation)
📌 EUR/USD – Strong inverse correlation with USD/CHF; when EUR/USD falls, USD/CHF often rises.
📌 USD/JPY – USD strength gauge; strong USD often lifts USD/CHF too.
📌 XAU/USD (Gold) – Safe-haven proxy; gold up can signal CHF strength (USD/CHF down).
📌 EUR/CHF – CHF strength context; strong euro may push CHF pairs differently.
📊 TECHNICAL EDGE
🟦 Key SMA/EMA resistance around our target zone
🟩 Support cluster aligning with buy layers
🟨 RSI/OB levels suggest bounce potential
🧨 FUNDAMENTAL & ECONOMIC FACTORS (London Time)
🟢 Swiss Franc (CHF) Drivers:
• SNB continues steady policy stance → CHF stays strong as safe haven.
• Lower inflation / strong risk sentiment drives CHF strength.
• Any Swiss GDP/ZEW survey or SNB commentary can spike moves.
🔵 US Dollar (USD) Drivers:
• Fed policy outlook + US GDP & unemployment data shape USD strength.
• USD weakening as Fed easing bets grow puts downward pressure on USD/CHF.
📅 Watch Key Events (London Time):
🕐 US GDP releases
🕐 Fed meeting minutes / speeches
🕐 Swiss ZEW expectations survey
🕐 CPI / inflation prints from USD & CHF regions
💡 Thief Vibe Final Words
🚨 This setup is built for smart layering, patient fills and disciplined exit runs.
📈 Stack entries, defend your risk, and exploit the natural dynamics of USD ↔ CHF flows.

USDCHF: Wave structure at a trend forkUSDCHF: Wave structure at a trend fork
USDCHF Wave Overview (D1 and H4)
As a trader who has been practicing wave analysis for over ten years, I note that the USDCHF pair is currently demonstrating the completion of an extended corrective formation and is poised to form a new impulse.
Chart D1: The global picture indicates that the market is ending a sideways phase. The wave structure appears to be the end of a corrective sequence, which serves as the foundation for the next trend movement.
Chart H4: Local dynamics confirm the formation of key entry points. Here, the first signs of an impulse are visible, which could mark the beginning of a larger wave.
Main Scenario
After the completion of the corrective phase, a downward impulse sequence is expected to develop. This movement will be accompanied by increased seller activity and a gradual shift in priority to the downside.
Alternative Scenario
If the price holds above recent highs and forms a stable upward impulse structure, the priority will shift to continued growth. In this case, the correction will be considered incomplete, and the pair may experience a further rebound.
Trading Idea
Conservative approach: wait for confirmation of a breakout of key levels and enter with the trend.
Aggressive approach: use local impulses on H4 for earlier entries, but with tight stops.
In both cases, it is important to maintain strict risk management and adjust the plan as new impulses emerge.
Results
USDCHF is at the transition point between a correction and a new impulse. The wave structure on D1 and H4 provides clear guidelines for trading: watch for confirmation of the scenario and act with discipline.

Bearish Pressure Dominates USD/CHF Structure!USD/CHF “THE SWISSY” 🐻 Bearish Opportunity (Day/Swing) — Correlation + Macro Watch 🚨
🔥 Asset: USD/CHF — “THE SWISSY”
⏱️ Timeframe: Day / Swing Trade Opportunity
📉 Bias: Bearish Plan
🎯 Trade Setup
🔹 Entry: ANY PRICE LEVEL ENTRY — Market or pullback
🔹 Stop Loss:
➡️ Thief SL: 0.79500 ❌
Adjust your SL based on your strategy & risk tolerance.
💡 This is NOT financial advice — YOU manage your risk.
🔹 Target Zone:
➡️ 0.78800 🎯 — strong support / oversold confluence / trap area
Take profits according to your plan.
💬 Remember: I do not insist on my SL or TP — trade YOUR risk. Your profits.
📌 Why This Setup Matters (Key Technical Points)
📉 Bearish structure forming
📌 Price near resistance + supply cluster
🌀 Momentum slowing
📌 RSI oversold approaching support
⚡ Liquidity sweep possible before drop
🔗 Related Pairs to Watch (Correlation Focus)
USD Strength Index Correlations:
🔹 USD/JPY – if USD weakens → pairs likely follow
🔹 EUR/USD – inverse correlation with USD/CHF
🔹 GBP/CHF – other CHF cross for confirmation
🔹 AUD/CHF – global risk sentiment reflection
📊 If CHF strengthens (risk off), bearish USD/CHF plays accelerate.
🌍 Macro + Economic Factors to Watch
📅 Economic Calendar Triggers
🔹 U.S. Data:
• GDP / CPI / PCE / NFP — volatility drivers
🔹 SNB (Swiss National Bank):
• Policy stance / rate expectations impact CHF strength
📈 Risk Sentiment:
👉 Safe-haven demand for CHF ↗ in risk-off
👉 USD moves with U.S. yield expectations
📊 Correlations to Monitor:
• USD Index (DXY) moves
• S&P 500 / equity risk trends
• CHF demand in flight-to-quality
📍 Quick Summary for Traders
✔ Bearish outlook
✔ Flexible entry
✔ Manage YOUR stops & targets
✔ Watch correlated pairs
✔ Monitor macro drivers
📣 Engagement Hooks:
👇 Comment Your Entry & Target Levels!
❤️ Like & Follow for more setups
📊 Share with other Traders — Let’s Grow Together!

USDCHFUSDCHF
- Symmetrical Triangle as an corrective pattern in Short Time Frame and Long Time Frame
- Break of Structure
- Fair Value Gap
- Consolidation Phase
- Completed " 123 " Impulsive Waves

Will USD/CHF Sustain Its Bullish Structure with Layered Entries?🎯 USD/CHF "THE SWISSY" - BULLISH SWING SETUP | Multi-Layer Entry Strategy 💰
📊 MARKET OVERVIEW
Pair: USD/CHF (The Swissy)
Trade Type: Swing Trade - Bullish Bias
Strategy: Thief's Multi-Layer Entry Method 🎭
🔥 THE SETUP
💎 ENTRY STRATEGY - LAYER METHOD
Using Multiple Buy Limit Orders (Layering Style):
Layer 1: 0.79000 🎯
Layer 2: 0.79200 🎯
Layer 3: 0.79400 🎯
📝 Note: You can add MORE layers based on YOUR capital & risk appetite. This averaging-down approach works when trend aligns with your direction!
🛡️ RISK MANAGEMENT
Thief's Stop Loss: 0.78600 ⚠️
⚠️ IMPORTANT: Ladies & Gentlemen (Thief OG's) - This is MY stop loss level. You MUST adjust YOUR stop loss based on:
Your own risk tolerance
Your account size
Your trading strategy
Your psychology
I'm NOT recommending you copy my SL blindly. Trade at YOUR OWN RISK! 🎲
🎯 PROFIT TARGET
Primary Target: 0.81000 🚀
📍 Why This Level?
Moving Average acting as STRONG resistance zone
Overbought conditions expected
Potential bull trap zone - ESCAPE with profits here!
⚠️ DISCLAIMER: Ladies & Gentlemen (Thief OG's) - This is MY take profit level. You can exit earlier/later based on YOUR strategy. Make money, TAKE money at YOUR OWN RISK! 💪
🔗 CORRELATED PAIRS TO WATCH
📈 POSITIVE CORRELATION (Move Together):
EUR/CHF - Swiss Franc weakness benefits both
GBP/CHF - CHF weakness across the board
DXY (US Dollar Index) - USD strength drives USD/CHF up
📉 INVERSE CORRELATION (Move Opposite):
EUR/USD - When USD strengthens, EUR/USD typically falls
XAU/USD (Gold) - Gold often drops when USD gains
CHF/JPY - Inverse CHF movement
🎯 KEY CORRELATION INSIGHTS:
DXY above 106.00 = Bullish fuel for USD/CHF 🔥
Swiss National Bank dovish = CHF weakness expected
US Treasury Yields rising = USD strength catalyst
Risk-ON sentiment = CHF (safe haven) typically weakens
📊 KEY TECHNICAL FACTORS
✅ Bullish Catalysts:
Multiple support levels holding
USD showing relative strength
CHF facing headwinds from SNB policy
Layer entry allows better average price
⚠️ Watch Out For:
Strong resistance at 0.81000 zone
Potential overbought conditions near target
Risk-OFF events trigger CHF safe-haven demand
SNB surprise interventions
💡 THIEF'S FINAL WORDS
"The market is a device for transferring money from the impatient to the patient."
This is a SWING trade - not a sprint! 🏃♂️
Layer your entries, manage your risk, and let the trade breathe.
Remember:
✅ YOUR money = YOUR rules
✅ YOUR risk = YOUR decision
✅ YOUR profit = YOUR timing
Trade smart, not hard! See you at 0.81000! 🎯💰
#USDCHF #ForexTrading #SwingTrade #TheSwissy #LayeringStrategy #RiskManagement #TradingView #ForexIdeas #PriceAction #TechnicalAnalysis 📈💪🔥
Drop a 🚀 if you're watching this pair! Drop a 💬 with your TP level!

The franc strengthens its position: pressure on the dollarAfter recent strengthening, USDCHF has shifted into a declining phase. The chart shows that upward impulses are losing momentum, while the movement is gradually transitioning into a bearish structure. Sellers are beginning to dominate, limiting growth attempts and pushing the price lower.
Fundamental factors add pressure to the pair. Dollar weakness is linked to expectations of a dovish Federal Reserve policy and the decline of the DXY index, which is losing ground amid weak U.S. economic data. At the same time, the Swiss franc gains support as a safe-haven asset, especially under conditions of geopolitical uncertainty.
An additional signal favoring the downside comes from the technical picture: the breakdown of key levels and the price holding within a bearish channel confirm seller interest.
Thus, USDCHF remains under pressure, and the market’s next steps will determine whether the current decline develops into a sustained downtrend.

USDCHF#USDCHF 1hr timeframe showing some break of trendline structure so i will wait 1 more hour to retest trendline again for the upside movement.

A compressed spring on the chart: readiness for a breakoutOn the four-hour chart, USDCHF is forming a “symmetrical triangle” pattern. After a period of consolidation, the price is gradually narrowing its range, indicating energy accumulation ahead of a new impulse.
The triangle is a model of uncertainty, but its completion often leads to a strong move. In the current structure, it is evident that buyers are holding the asset above key levels, which increases the probability of an upward breakout.
Trading tactics for this formation are usually based on waiting for a breakout of the triangle’s boundaries. A close above the upper line opens the scenario for continued growth, while a break below suggests a decline. However, given the overall bias toward dollar strength, the upward breakout remains the priority scenario.
Thus, USDCHF is in a phase of preparation for an impulse, and the upcoming breakout of the triangle will be the key signal for opening positions.

Stabilization before a new impulse USDCHF shows signs of strengthening after a period of consolidation. The pair is gradually shifting upward, with impulses becoming more confident, indicating buyer dominance.
Corrective pullbacks remain limited, while upward segments retain stability. This dynamic suggests that the market is building a foundation for continued upward movement.
An additional factor is the demand for the dollar, which supports interest in the asset and increases the likelihood of a new impulsive wave. Thus, USDCHF is in a strengthening phase, where the next steps may define the scale of the bullish trend.

Swissie Breakout Retest: Are Buyers Preparing a Major Push?USD/CHF BULLISH SETUP | HMA Pullback + TMA Breakout Retest (Swing/Day Trade) 🚀
📈 Asset: USD/CHF - "The Swissie"
⏰ Timeframe: 4H & Daily (Swing) / 1H & 15M (Day Entry)
🔄 Style: Bullish Continuation | Pullback & Breakout Retest
⚡ Strategy: "Thief Method" - Layered Limit Order Entry
✨ Executive Summary
A technically sound bullish opportunity is forming on USD/CHF! We are identifying a high-probability pullback to a confluence zone, confirmed by the adaptive Hull Moving Average (HMA) and awaiting a decisive breakout & retest of the Triangular Moving Average (TMA). This plan uses a strategic, risk-managed entry method.
📊 Technical Rationale & Confirmation
✅ Trend Filter: Price above the key Hull Moving Average (HMA) on the 4H chart confirms the primary bullish structure. The current move is treated as a healthy pullback within the uptrend.
🔺 Key Signal: We are watching for a breakout and bullish retest of the Triangular Moving Average (TMA), which often acts as dynamic support in a trend. A successful hold here is our confirmation trigger.
🎯 Precision Entry Zone: The confluence area between 0.8000 - 0.8040 provides a high-value zone for action.
⚔️ Trade Plan: "The Thief" Layered Entry Strategy
This plan uses multiple limit orders to "steal" the best average entry price, scaling into the position.
🟢 ENTRY (Layered Limit Orders):
Layer 1: 0.8040
Layer 2: 0.8020
Layer 3: 0.8000
🔹 Pro Tip: You can adjust the number of layers and prices based on your capital & risk appetite.
⛔ STOP LOSS (Risk Management):
Initial/Thief SL: 0.7970 (Below the entry zone and key structure).
📢 IMPORTANT NOTE, THIEF CREW: I provide a framework, not financial advice. YOU MUST adjust your SL based on your personal risk tolerance and strategy. Protect your capital first! 💰
🎯 TAKE PROFIT Target:
Primary Target: 0.8150 (A strong resistance and potential overbought/trap zone).
Tactical Exit: Consider partial profits on the way up. "Escape with profits" when momentum wanes.
📢 REMINDER: This is MY target based on my analysis. YOU are responsible for your own exits. Take money at your own risk and comfort level.
🌍 Related Pairs & Key Correlations (Must Watch!)
Monitoring correlated pairs increases context and confidence.
FX:EURUSD : NEGATIVE Correlation. If USD/CHF is bullish (USD strong), EURUSD is often bearish. Watch for USD strength confirmation here.
OANDA:EURCHF : POSITIVE Correlation. Often moves in tandem with USD/CHF. A strong Euro can also support CHF pairs. Confirm trend alignment.
FX:GBPUSD : NEGATIVE Correlation. Another major USD pair. Broad USD strength (helping USD/CHF) should pressure GBPUSD lower.
OANDA:XAUUSD (Gold): INVERSE Correlation to USD. A falling Gold price ( OANDA:XAUUSD ) typically signals USD strength, which could support this USD/CHF bullish thesis.
🔑 Key Point: For this USD/CHF bullish idea to thrive, we want to see broad USD strength (DXY ⬆️) and/or CHF weakness against other majors. Watch TVC:DXY for the clearest USD direction clue.
📌 Final Notes & Disclaimer
This is a STRATEGY GUIDE, not a signal.
The "Thief" method smooths your entry but requires discipline.
Always use proper risk management (<1-2% per trade).
Like 👍 and Follow if you find this detailed breakdown useful! It helps the algorithm and keeps more content coming!
Comment below! What's your take on this setup? Are you watching the same correlations?
🚀 Trade Safe, Thief Crew! Let's get those pips!
#Forex #USDCHF #Swissie #TradingView #TradingIdea #SwingTrading #DayTrading #TechnicalAnalysis #HMA #TMA #Breakout #ForexStrategy #RiskManagement

USDCHFUSDCHF
- Bearish Channel as an corrective pattern in Short Time Frame
- Break of Structure
- RSI - Divergence
- Order Block
- Completed " 12345 " Impulsive Waves and " A " Corrective Wave

USDCHF I Retracement and Potential Long from SupportWelcome back! Let me know your thoughts in the comments!
** USDCHF Analysis - Listen to video!
We recommend that you keep this on your watch list and enter when the entry criteria of your strategy is met.
Please support this idea with a LIKE and COMMENT if you find it useful and Click "Follow" on our profile if you'd like these trade ideas delivered straight to your email in the future.
Thanks for your continued support!

USDCHF Idea 23.11For chf, I see two scenarios, one is currently as close as the other, and that is a short position at the level around 0.8, where the daily level is nearby, and the vwap condition can be met even when the price reaches the poc level.the second most distant scenario and at this moment even less probable is a long position at the val level which is at the level of 0.786, whether it will be a beautiful range, we will see

USD/CHF – Bullish Marubozu Signal Aligns With Trend USD/CHF – Bullish Marubozu Signal Aligns With Trend (76% Probability)
A fresh BUY signal has been triggered on USD/CHF following the formation of a Marubozu candlestick pattern on the current timeframe.
Our model assigns a 76% historical backtest probability to this setup, highlighting a statistically strong bullish continuation opportunity.
🔍 Technical Analysis & Price Structure
The recent Marubozu candle signals strong buyer dominance, where price closes near the high with minimal wicks — a hallmark of decisive bullish control.
This pattern suggests:
A resumption of the prevailing uptrend after a brief corrective pullback
Strong participation by buyers at current levels
Rejection of lower liquidity zones
Upside continuation potential toward key resistance levels
Combined with trend-following model confirmation, the setup carries high technical validity.
🌍 Market Context & Macro Overview
Market sentiment around USD/CHF remains constructive:
USD performance is mixed, but the pair benefits from safe-haven dynamics
Swiss Franc strength seems muted as global risk sentiment stabilizes
Interest rate differentials still broadly favor the USD
Market expectations around upcoming US economic data may add bullish pressure
Overall, macro conditions support potential upside continuation.
📌 Key Technical Levels to Watch
These levels will guide short-term price action:
Immediate Resistance – 0.79866
A short-term ceiling; clearing this opens the path to higher levels.
Immediate Support – 0.79388
A key zone where buyers stepped in to confirm the Marubozu formation.
Major Resistance – 0.80423
Primary bullish target if momentum sustains.
Major Support – 0.78831
Critical structure invalidation for the bullish bias.
🎯 Trade Setup Parameters (0.10 Lot Example)
Parameter Level
Entry 0.79627
Stop Loss (SL) 0.79427
Take Profit (TP) 0.80027
Risk $50
Potential Profit $100
Risk–Reward Ratio 1 : 2
The setup presents a clean, mechanical bullish continuation structure with clearly defined risk boundaries.
🛡 Risk Management Guidance
Maintain professional-grade discipline:
Keep risk per position between 1–2% of your capital
Scale in on retests or partial confirmations if volatility increases
Move to break-even or trailing stop once price clears the first resistance
Avoid entering before high-impact USD or CHF data releases
Lock profits if momentum begins to flatten near major resistance
Marubozu-driven setups often follow through quickly — managing the trade dynamically is essential.
📌 Final Thoughts
USD/CHF is presenting a well-defined bullish continuation opportunity, supported by a high-probability Marubozu signal, trend alignment, and supportive macro conditions.
A break above 0.79866 could accelerate momentum toward 0.80423, while maintaining SL discipline below 0.79427 keeps risk controlled.
This setup fits well for traders looking for a structured, statistically tested trend continuation entry.

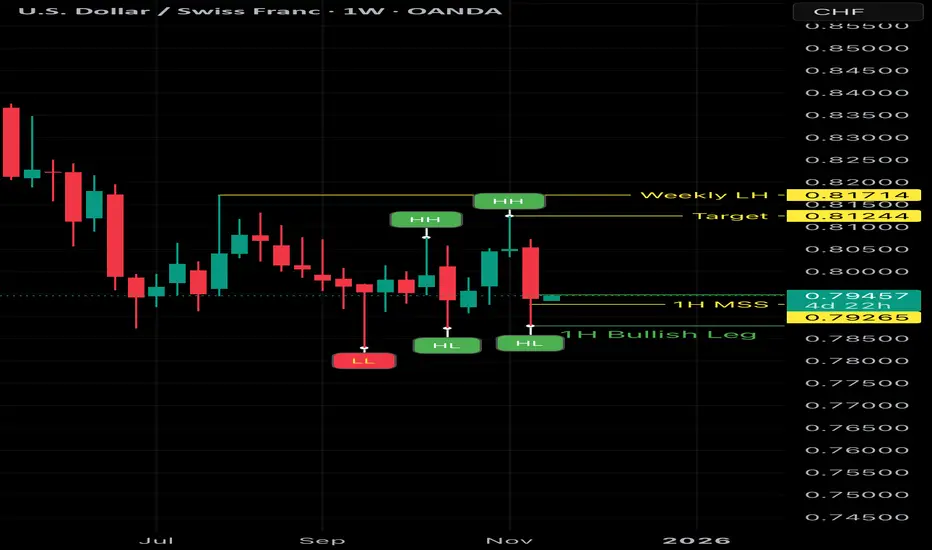
Is This an Early Reversal Signal on USD/CHF This Week?
(The full story: buyer strength forming above the Weekly Low)
NFA – Educational purpose only
USD/CHF has been trading inside a weekly range, and price has just reacted sharply from the Weekly Low at 0.78290 — an area where buyers often step in.
This reaction has created the first meaningful signs of a potential shift inside the broader range.
Let’s walk through the full structure.
1️⃣ Weekly Context — Range + Strong Reaction at 0.78290
The Weekly timeframe is still inside a large consolidation zone, with key boundaries:
• Weekly Low: 0.78290
• Weekly Range Resistance / LH: 0.81714
Price tapped the Weekly Low and bounced immediately — a typical behavior when buyers defend the bottom of a range.
2️⃣ Daily: First Structural Sign of Strength
Following the bounce from 0.78290, the Daily chart printed:
• A Higher Low (HL)
• A Higher High (HH)
This doesn’t confirm a full trend reversal yet,
but it does show that bearish momentum has weakened and buyers are gaining control inside the weekly range.
This is often how early shifts begin.
3️⃣ 1H: Potential Origin of the Next Daily HL
The 1H chart shows the clearest short-term shift:
• A clean bullish leg
• A MSS to the upside
• A fresh FVG created during expansion
• Buyers defending demand on every dip
This type of 1H structure is exactly what often forms the next Daily HL during the early stages of a larger shift.
If buyers continue holding this zone through the week,
the Daily may confirm another wave upward.
4️⃣ Key Zones to Watch This Week
If the bullish structure continues:
• 0.81244 → next Daily target
• 0.81714 → Weekly Range Resistance
These are the natural magnet zones if buyers maintain control.
⸻
5️⃣ The Bigger Story
We are not looking at a confirmed macro reversal yet.
But we are seeing:
• Weekly = range
• Daily = HL → HH above the Weekly Low
• 1H = potential foundation of the next Daily HL
This is how early reversals typically begin inside higher-timeframe ranges.
A full reversal requires a Weekly close above 0.81714 —
but for now, internal structure is clearly shifting upward.
⸻
⭐ Educational Purpose Only
This idea is shared to provide clarity and to show my personal vision of the current structure.
If this analysis helped you or aligned with your view, I’d appreciate your support:
👍 Like
💬 Comment
⭐ Follow
🔄 Share
Your engagement motivates me to keep providing more structured and educational analysis to the community.
USD/CHF: The Franc is Awakening USD/CHF: The Franc is Awakening – Will There Be a Wave 5 or a Crash to 0.75?
📈 Weekly Scenarios
Bearish scenario (main): Price holds below ~0.8080 → wave 5 develops → possible decline to ~0.7700–0.7500.
Consolidation: Price may remain stuck in the ~0.7900–0.8080 range, awaiting further signal.
Alternative bullish scenario: Breakout and fixation above ~0.8080 → corrective rise to ~0.8350 or higher.
✅ Conclusion
USD/CHF on the weekly timeframe looks aggressively bearish, but not without the possibility of an unexpected rebound. The key to further direction is a reaction to the ~0.8080 and ~0.7900 levels.
If the price consolidates below 0.8080, there's a high probability of a new downward wave.
A breakout above this level could provide a chance for a correction or reversal.

USDCHF - Looking To Sell Pullbacks In The Short TermH1 - Strong bearish move.
No opposite signs.
Expecting bearish continuation until the two Fibonacci resistance zones hold.
If you enjoy this idea, don’t forget to LIKE 👍, FOLLOW ✅, SHARE 🙌, and COMMENT ✍! Drop your thoughts and charts below to keep the discussion going. Your support helps keep this content free and reach more people! 🚀
-------------------------------------------------------------------------------------------------------------------

USDCHF - SWING TRADETeam, we been doing very well on USDCHF the last 3-6 months on swing trade
but when you buy, make sure add slowly
LAST HIGH was 0.8117
Our entry at 0.7965, add more at 0.7930-15
if you want to have STOP LOSS - safe at 0.7830-50
Target 1 at 0.8000-0.8015
Target 2 at 0.8045-78
LETS GO
