USD/JPY Bullish Continuation Setup – Buy from Support (148.000) Price Structure & Trend
Overall Trend: The market has been moving upward since around the 18th, forming higher highs and higher lows inside an ascending channel (shown in red).
Current Position: Price is near the top of the channel, slightly pulling back.
2. Key Levels
Entry Zone: Around 148.000 (highlighted by the gray box).
Stop Loss: Around 147.378 (below the channel and key support).
Take Profit (Target Point): 150.513 (near the next major resistance zone)
3. Trade Idea
This chart seems to suggest a buy (long) setup:
Plan: Wait for price to retest the gray zone (support zone near 148.000).
If price respects this support, go long toward the target zone 150.5.
Risk/Reward Ratio: Very favorable (risk is small compared to potential upside).
4. Confirmation Factors
Ascending Channel: Price is respecting the channel, which is a bullish sign.
Support Zone: 148.000 area has been tested multiple times — likely to act as a strong support.
Momentum: As long as price stays above 147.378, buyers are in control.
5. Bearish Scenario
If price breaks below 147.378, this setup becomes invalid.
It may indicate a channel breakdown and potential trend reversal toward 146.5–146.0.
✅ Summary:
This chart shows a bullish continuation setup on USD/JPY. The trader is likely waiting for a pullback to 148.000 before buying, with a stop below 147.378 and a target near 150.5.
USDJPY

technical analysis of USD/JPY - H11. Overall Trend
The pair is currently in a range consolidation between ~146.500 – 149.000.
Recently, the price approached a strong resistance zone at 148.900 – 149.000 (point A on the chart).
The short-term uptrend is weak, indicating a high probability of a reversal.
2. Key Resistance and Support Levels
Resistance:
148.900 – 149.000: range top, ideal selling area.
Support:
148.000 – 148.050: nearest short-term support.
147.200 – 147.000: strong support if the price drops deeper (projected C target).
3. Trading Strategy
a) Short-term (intraday) strategy
Sell at resistance:
Entry: 148.850 – 148.900 (near A)
Target: 148.000 (B) or 147.200 (C)
Stop-loss: 149.100 (above range top)
Buy at support:
Entry: 148.000 – 148.050
Target: 148.800 – 148.900
Stop-loss: 147.800
b) A-B-C Wave Forecast
The price just reached peak A, likely forming a corrective wave B → C.
Wave B: small retracement to ~148.400 – 148.500 before continuing downward.
Wave C: target ~147.200 – 147.000, the previous range bottom.
4. Technical Indicators
RSI H1: above 70 → overbought → confirms reversal potential.
20-period EMA H1: trend not yet broken, but price rejection at resistance signals possible decline.
Fibonacci retracement: from recent low to A peak → 38.2% ~ 147.700, 50% ~ 147.300 → aligns with projected C target.
5. Notes
Current priority: short positions near resistance.
Wait for price action confirmation (pin bar, engulfing candle) before entering a sell.
Watch for a breakout above 149.000 → could trigger a longer-term bullish move.

USDJPY set to cross 151.00Hello traders, this is a complete multiple timeframe analysis of this pair. We see could find significant trading opportunities as per analysis upon price action confirmation we may take this trade. Smash the like button if you find value in this analysis and drop a comment if you have any questions or let me know which pair to cover in my next analysis

USD/JPY Bullish Breakout Setup – Targeting 150.30 with Strong RiChart Overview
The chart shows a rising channel (highlighted in red with blue borders).
Price recently broke above the upper boundary of the channel and pulled back.
The trader’s setup marks:
Entry Point: 148.417
Stop Loss: 148.067
Target Point: 150.307
Analysis
Trend Context
Since September 18th, price has been in an uptrend (higher highs, higher lows).
The breakout from the channel suggests continuation to the upside.
Entry Point (148.417)
Positioned slightly below the breakout area, allowing entry on a pullback confirmation.
This reduces the risk of entering at the top of the breakout wick.
Stop Loss (148.067)
Well-placed below recent consolidation and the channel’s midline.
If price breaks below this level, it would signal a potential failed breakout and bearish reversal.
Target Point (150.307)
Target is based on the measured move projection (height of the channel added to breakout level).
This aligns with a strong psychological resistance near 150.30 – 150.50.
Risk-to-Reward Ratio (RRR)
Risk (Entry to SL): ~35 pips
Reward (Entry to TP): ~190 pips
RRR ≈ 1:5.4 → very favorable.
Conclusion
This is a bullish breakout trade setup.
If price respects the pullback and stays above 148.40, continuation toward 150.30 is likely.
Watch out for news/events (like BoJ or US Fed comments) since USD/JPY is highly sensitive to fundamentals.
👉 In short: The setup looks solid with a strong uptrend, clean breakout, and excellent risk-to-reward

USDJPY sideways consolidation resistance at 148.90The USDJPY pair is currently trading with a bearish bias, aligned with the broader downward trend. Recent price action shows a retest of the falling resistance, suggesting a temporary relief rally within the downtrend.
Key resistance is located at 148.90, a prior consolidation zone. This level will be critical in determining the next directional move.
A bearish rejection from 148.90 could confirm the resumption of the downtrend, targeting the next support levels at 146.10, followed by 145.40 and 144.60 over a longer timeframe.
Conversely, a decisive breakout and daily close above 148.90 would invalidate the current bearish setup, shifting sentiment to bullish and potentially triggering a move towards 149.75, then 150.20.
Conclusion:
The short-term outlook remains bearish unless the pair breaks and holds above 148.90. Traders should watch for price action signals around this key level to confirm direction. A rejection favours fresh downside continuation, while a breakout signals a potential trend reversal or deeper correction.
This communication is for informational purposes only and should not be viewed as any form of recommendation as to a particular course of action or as investment advice. It is not intended as an offer or solicitation for the purchase or sale of any financial instrument or as an official confirmation of any transaction. Opinions, estimates and assumptions expressed herein are made as of the date of this communication and are subject to change without notice. This communication has been prepared based upon information, including market prices, data and other information, believed to be reliable; however, Trade Nation does not warrant its completeness or accuracy. All market prices and market data contained in or attached to this communication are indicative and subject to change without notice.

USD/JPY - Bank of Japan Holds Rates, Inflation RisingFX:USDJPY #USDJPY #Forex #Trading #FXAnalysis #TechnicalAnalysis #PriceAction #BankOfJapan #ForexTrader #DayTrading #SwingTrading
The Bank of Japan kept interest rates unchanged while raising its inflation forecast. This signals caution but also optimism that cooperation with the U.S. could help stabilize Japan’s economy.
On the chart, we see key demand zones (red) holding as potential support, with upside targets toward 148.700 – 149.200 (green key zones). If price sustains above the demand area, bullish momentum could push USD/JPY higher into these resistance levels.
Traders should watch for confirmation signals around support before entering long positions.
👍 Support with a like & drop your thoughts in the comments!
⚠️ Disclaimer: This analysis is for educational purposes only and should not be considered financial advice. Always do your own research before making trading decisions.

USD/JPY - Bullish Channel, Next Targeting 148.95 (23.09.2025)#USDJPY #Forex #Trading #TechnicalAnalysis
USD/JPY is trading within a Bullish Channel Pattern on the 30M chart, holding above the rising trendline support. The pair is bouncing from the support zone (147.50 – 147.70), signaling potential upside continuation.
🔹 Market Structure:
Bullish channel intact with higher highs & higher lows.
Price rejected the support zone and trendline.
Momentum suggests buyers could retest upper channel resistance.
🔹 Key Levels:
Support Zone: 147.50 – 147.70
1st Resistance: 148.58
2nd Resistance: 148.95
📈 Trading Idea:
As long as USD/JPY stays above the support zone, bulls may drive price higher toward 148.58 → 148.95.
⚠️ Invalidation:
A break below 147.50 would weaken the bullish outlook.
“Discipline + Patience = Consistency 🔑”

USD/JPY key levels to watchThe USD/JPY's weekly chart is the one to watch. A string of doji candles shows the market is coiling ahead of a larger move. Resistance at 148.65–150.00 remains the barrier; rejection keeps the bearish case alive with 147.00, 146.00, and 145.00 as downside levels.
By Fawad Razaqzada, market analyst with FOREX.com

USD/JPY BEARS ARE STRONG HERE|SHORT
Hello, Friends!
We are targeting the 147.228 level area with our short trade on USD/JPY which is based on the fact that the pair is overbought on the BB band scale and is also approaching a resistance line above thus going us a good entry option.
Disclosure: I am part of Trade Nation's Influencer program and receive a monthly fee for using their TradingView charts in my analysis.
✅LIKE AND COMMENT MY IDEAS✅

USDJPY H4 | Bullish bounce offUSD/JPY has bounced off the buy entry which is a pullback support and could potentially rise from this level eot the take profit.
Buy entry is at 147.45, which is a pullback support.
Stop loss is at 146.61, which is a pullback support that lines up with the 61.8% Fibonacci retracement.
Take profit is at 148.75, which his a multi swing high resistance that lines up with the 127.2% Fibonacci extension.
High Risk Investment Warning
Trading Forex/CFDs on margin carries a high level of risk and may not be suitable for all investors. Leverage can work against you.
Stratos Markets Limited (tradu.com ):
CFDs are complex instruments and come with a high risk of losing money rapidly due to leverage. 65% of retail investor accounts lose money when trading CFDs with this provider. You should consider whether you understand how CFDs work and whether you can afford to take the high risk of losing your money.
Stratos Europe Ltd (tradu.com ):
CFDs are complex instruments and come with a high risk of losing money rapidly due to leverage. 66% of retail investor accounts lose money when trading CFDs with this provider. You should consider whether you understand how CFDs work and whether you can afford to take the high risk of losing your money.
Stratos Global LLC (tradu.com ):
Losses can exceed deposits.
Please be advised that the information presented on TradingView is provided to Tradu (‘Company’, ‘we’) by a third-party provider (‘TFA Global Pte Ltd’). Please be reminded that you are solely responsible for the trading decisions on your account. There is a very high degree of risk involved in trading. Any information and/or content is intended entirely for research, educational and informational purposes only and does not constitute investment or consultation advice or investment strategy. The information is not tailored to the investment needs of any specific person and therefore does not involve a consideration of any of the investment objectives, financial situation or needs of any viewer that may receive it. Kindly also note that past performance is not a reliable indicator of future results. Actual results may differ materially from those anticipated in forward-looking or past performance statements. We assume no liability as to the accuracy or completeness of any of the information and/or content provided herein and the Company cannot be held responsible for any omission, mistake nor for any loss or damage including without limitation to any loss of profit which may arise from reliance on any information supplied by TFA Global Pte Ltd.
The speaker(s) is neither an employee, agent nor representative of Tradu and is therefore acting independently. The opinions given are their own, constitute general market commentary, and do not constitute the opinion or advice of Tradu or any form of personal or investment advice. Tradu neither endorses nor guarantees offerings of third-party speakers, nor is Tradu responsible for the content, veracity or opinions of third-party speakers, presenters or participants.

Bearish drop off pullback resistance?USD/JPY has rejected off the resistance level which is a pullback resistance and could drop from this level to our take profit.
Entry: 148.36
Why we like it:
There is a pullback resistance level.
Stop loss: 149.49
Why we like it:
There is a pullback resistance that is slightly below the 161.8% Fibonacci extension.
Take profit: 146.61
Why we like it:
There is a pullback support that aligns with the 61.8% Fibonacci retracement.
Enjoying your TradingView experience? Review us!
Please be advised that the information presented on TradingView is provided to Vantage (‘Vantage Global Limited’, ‘we’) by a third-party provider (‘Everest Fortune Group’). Please be reminded that you are solely responsible for the trading decisions on your account. There is a very high degree of risk involved in trading. Any information and/or content is intended entirely for research, educational and informational purposes only and does not constitute investment or consultation advice or investment strategy. The information is not tailored to the investment needs of any specific person and therefore does not involve a consideration of any of the investment objectives, financial situation or needs of any viewer that may receive it. Kindly also note that past performance is not a reliable indicator of future results. Actual results may differ materially from those anticipated in forward-looking or past performance statements. We assume no liability as to the accuracy or completeness of any of the information and/or content provided herein and the Company cannot be held responsible for any omission, mistake nor for any loss or damage including without limitation to any loss of profit which may arise from reliance on any information supplied by Everest Fortune Group.

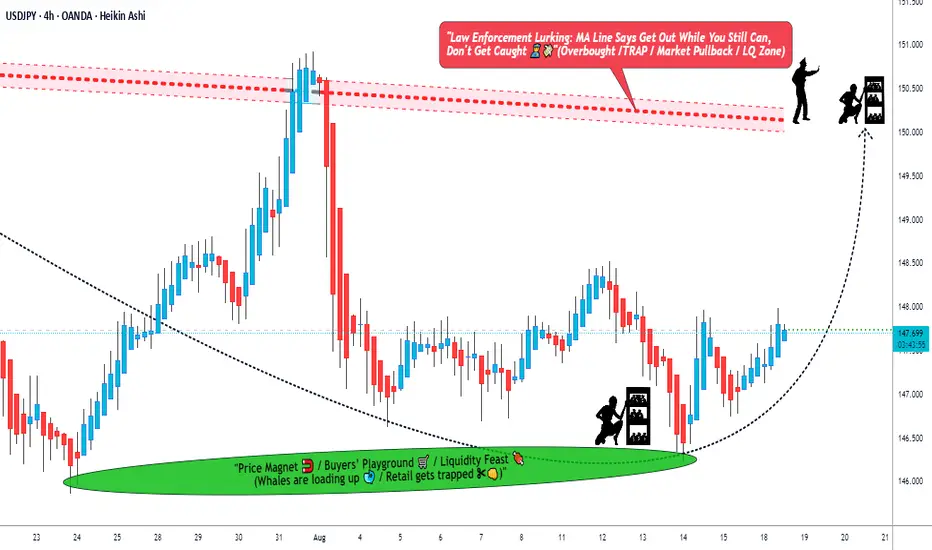
"The USDJPY Ninja Trade – Silent Entry, Big Exit!"🚨💰 USD/JPY “The Ninja” Forex Bank Heist Plan (Swing Trade) 🐱👤💴💵
🎭 Dear Money Makers, Robbers & Thief OG’s,
It’s time to gear up for our biggest Ninja heist on the Forex streets!
We’re breaking into the USD/JPY vault with a Bullish Master Plan – grab your mask, load your limit orders, and let’s rob the market clean! 💰🔫
🗡️ Heist Entry (Layering Style) 📈
Thief doesn’t enter with one bullet – we spray the vault with multiple limit orders! 🎯
First layer: 147.600
Second layer: 147.400
Third layer: 147.200
👉 Add more layers if you want a deeper pullback entry – the more locks you pick, the bigger the loot! 🏦💎
🛑 Thief Stop Loss
This is Thief SL 🔒: 146.500
But remember, dear ladies & gentlemen (Thief OG’s) – adjust your SL based on your own strategy, capital & risk appetite. Stay slick, don’t get caught! 🚔💨
🎯 Target Escape Zone
Police barricade spotted 🚨👮 @ 150.700
Our heist exit point is locked at 150.000 🏃♂️💨
👉 Make sure you grab the loot & escape before the cops arrive. Take profit & celebrate with stolen sushi 🍣 & sake 🍶!
⚠️ Thief Trading Notes
News drops = extra police patrols 🚔 – avoid opening fresh entries during major releases.
Trail your stops to lock in profits – no thief leaves empty-handed!
Stay alert to price traps – don’t get stuck behind enemy lines.
💎 If this heist plan made you some loot, smash that 💖 & BOOST button to power up the Thief Gang 🚀🤝💰
The more boosts, the bigger our robbery squad becomes!
Stay tuned, Ninjas 🐱👤 … the next heist plan is already loading.
💵💎🚀 Thief Trader OUT.
USDJPY Potential Buy 4HWeaker USD needs to extend so it can fall back on weekly scale.
4H triggered a potential Buy signal. Previous 2 times support didnt break and we see 3rd time small bullish 4H formed. This could suggest short term bullish reversal for the parity.
Levels to watch out
TP1: 148.3
TP2: 148.6
TP3: 148.75

USDJPY 30Min Engaged ( Bearish Reversal Entry Detected )Time Frame: 30-Minute Warfare
Entry Protocol: Only after volume-verified breakout
🩸Bearish Reversal - 147.750
➗ Hanzo Protocol: Volume-Tiered Entry Authority
➕ Zone Activated: Dynamic market pressure detected.
The level isn’t just price — it’s a memory of where they moved size.
Volume is rising beneath the surface — not noise, but preparation.
🔥 Tactical Note:
We wait for the energy signature — when volume betrays intention.
The trap gets set. The weak follow. We execute.

USDJPY H4 | Could we see a bounce from here?USD/JPY is falling towards the buy entry which is a pullback support and could bounce from this level to the take profit.
Buy entry is at 147.45, which is a pullback support.
Stop loss is at 146.61, which is a pullback support that aligns with the 61.8% Fibonacci retracement.
Take profit is at 148.75, which is a multi swing high resistance that aligns with the 127.2% Fibonacci extension.
High Risk Investment Warning
Trading Forex/CFDs on margin carries a high level of risk and may not be suitable for all investors. Leverage can work against you.
Stratos Markets Limited (tradu.com ):
CFDs are complex instruments and come with a high risk of losing money rapidly due to leverage. 65% of retail investor accounts lose money when trading CFDs with this provider. You should consider whether you understand how CFDs work and whether you can afford to take the high risk of losing your money.
Stratos Europe Ltd (tradu.com ):
CFDs are complex instruments and come with a high risk of losing money rapidly due to leverage. 66% of retail investor accounts lose money when trading CFDs with this provider. You should consider whether you understand how CFDs work and whether you can afford to take the high risk of losing your money.
Stratos Global LLC (tradu.com ):
Losses can exceed deposits.
Please be advised that the information presented on TradingView is provided to Tradu (‘Company’, ‘we’) by a third-party provider (‘TFA Global Pte Ltd’). Please be reminded that you are solely responsible for the trading decisions on your account. There is a very high degree of risk involved in trading. Any information and/or content is intended entirely for research, educational and informational purposes only and does not constitute investment or consultation advice or investment strategy. The information is not tailored to the investment needs of any specific person and therefore does not involve a consideration of any of the investment objectives, financial situation or needs of any viewer that may receive it. Kindly also note that past performance is not a reliable indicator of future results. Actual results may differ materially from those anticipated in forward-looking or past performance statements. We assume no liability as to the accuracy or completeness of any of the information and/or content provided herein and the Company cannot be held responsible for any omission, mistake nor for any loss or damage including without limitation to any loss of profit which may arise from reliance on any information supplied by TFA Global Pte Ltd.
The speaker(s) is neither an employee, agent nor representative of Tradu and is therefore acting independently. The opinions given are their own, constitute general market commentary, and do not constitute the opinion or advice of Tradu or any form of personal or investment advice. Tradu neither endorses nor guarantees offerings of third-party speakers, nor is Tradu responsible for the content, veracity or opinions of third-party speakers, presenters or participants.

Fundamental Market Analysis for September 23, 2025 USDJPYThe key fundamental driver remains unchanged: the yield and rate gap between the US and Japan, where the Bank of Japan maintains ultra-loose policy while the US supports relatively high yields, systematically supporting long USD positions against the yen. In quiet periods, carry trade mechanics work stably, and occasional verbal interventions from Tokyo usually have short-lived effect without trend base changes absent central bank policy shifts. On this background, even after pullbacks, the pair tends to resume gains reflecting yield premium and global USD demand amid strengthening US macro data.
News assessments on EURUSD and market sentiment highlight high USD sensitivity to inflation and labor data releases, which, upon strong data, usually translates into USDJPY gains via the UST curve. With ECB holding rates and markets expecting Fed easing later, short-term USD fluctuations are often data surprise-driven, while yen remains the "weak link" due to BOJ policy. Therefore, an entry near 147.800 is justified for tactical buying with controlled risk until signs of sustained policy shifts in Tokyo or sharp US yield drops emerge.
Current cross rates through EUR confirm the USDJPY calculated target near 147.800 for today's session, consistent with entry choice at 147.800 for carry-support continuation scenario. Risk management implies a tight stop within 0.20 given possible short-term volatility on news and comments from Japanese officials. The target around 148.800 reflects gradual advance amid sustaining divergence in US-Japan monetary regimes.
Trading recommendation: BUY 147.800, SL 147.600, TP 148.800

Bullish bounce off 50% Fibonacci support?USD/JPY is falling towards the pivot which is a pullback support that aligns with the 50% Fibonacci retracement and could bounce to the pullback resistance.
Pivot: 147.03
1st Support: 146
1st Resistance: 148.74
Disclaimer:
The above opinions given constitute general market commentary, and do not constitute the opinion or advice of IC Markets or any form of personal or investment advice.
Any opinions, news, research, analyses, prices, other information, or links to third-party sites contained on this website are provided on an "as-is" basis, are intended only to be informative, is not an advice nor a recommendation, nor research, or a record of our trading prices, or an offer of, or solicitation for a transaction in any financial instrument and thus should not be treated as such. The information provided does not involve any specific investment objectives, financial situation and needs of any specific person who may receive it. Please be aware, that past performance is not a reliable indicator of future performance and/or results. Past Performance or Forward-looking scenarios based upon the reasonable beliefs of the third-party provider are not a guarantee of future performance. Actual results may differ materially from those anticipated in forward-looking or past performance statements. IC Markets makes no representation or warranty and assumes no liability as to the accuracy or completeness of the information provided, nor any loss arising from any investment based on a recommendation, forecast or any information supplied by any third-party.

USDJPY SHORT TRADEUSDJPY is bull run however due to weaker dollar we can see a smart sell setup available on 15 minutes TF. Risk management required

USDJPY 30Min Engaged ( Bullish Reversal Entry Detected )Time Frame: 30-Minute Warfare
Entry Protocol: Only after volume-verified breakout
🩸Bullish Reversal - 148.000
➗ Hanzo Protocol: Volume-Tiered Entry Authority
➕ Zone Activated: Dynamic market pressure detected.
The level isn’t just price — it’s a memory of where they moved size.
Volume is rising beneath the surface — not noise, but preparation.
🔥 Tactical Note:
We wait for the energy signature — when volume betrays intention.
The trap gets set. The weak follow. We execute.

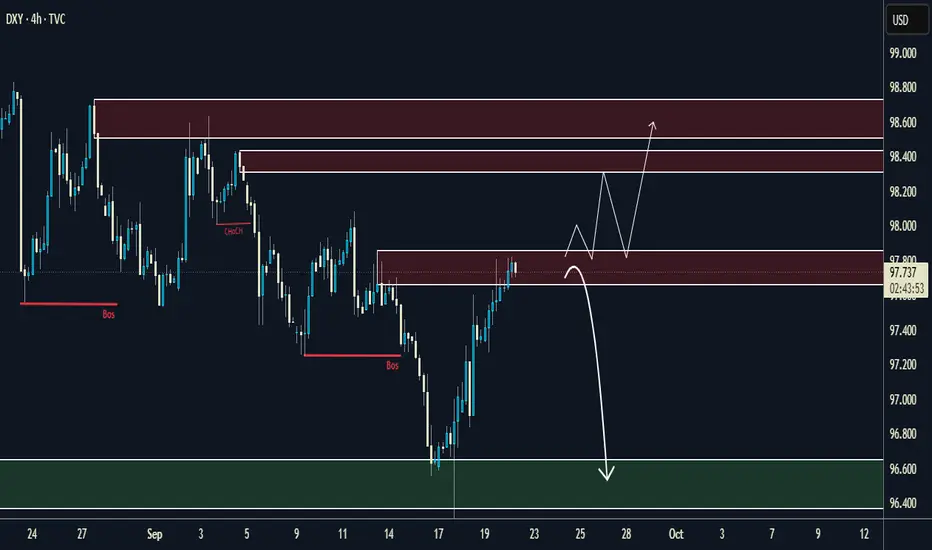
DXY 4H Outlook – Key Levels & Potential Scenarios💡 DXY 4H Outlook – Key Levels & Potential Scenarios
Price is currently testing an important supply zone (97.7 – 98.0) after showing a strong recovery. From here, I’m watching two possible outcomes:
🔼 Bullish Scenario
If buyers manage to hold above the 97.7 – 98.0 supply zone, we could see continuation toward the next major resistance between 98.2 – 98.6.
Break & retest of 98.0 would be a strong confirmation for buyers.
🔽 Bearish Scenario
If the 97.7 – 98.0 area rejects strongly, price could reverse back down toward the demand zone (96.4 – 96.6) for liquidity grab.
This zone has previously acted as a strong reaction point.
⚔️ Key Levels to Watch
Resistance: 98.0 | 98.2 | 98.6
Support: 97.4 | 96.6
📊 This setup gives both bulls and bears opportunities depending on how price reacts at these zones.
✅ If you enjoy this type of analysis, make sure to follow me so you don’t miss the next updates.
💼 For those who want account management services (personal or funded accounts), feel free to reach out – I can help you grow consistently with risk management and proven strategies.
USDJPY H4 | Approaching major resistanceUSD/JPY is rising towards the sell entry which acts as a pullback resistance that aligns with the 127.2% Fibonacci extension and the 61.8% Fibonacci projection, and could reverse from this level to the take profit.
Sell entry is at 148.84, which is a pullback resistance that aligns with the 127.2% Fibonacci extension and the 61.8% Fibonacci projection.
Stop loss is at 150.72, which is a swing high resistance.
Take profit is at 147.44, which is a pullback support level.
High Risk Investment Warning
Trading Forex/CFDs on margin carries a high level of risk and may not be suitable for all investors. Leverage can work against you.
Stratos Markets Limited (tradu.com ):
CFDs are complex instruments and come with a high risk of losing money rapidly due to leverage. 65% of retail investor accounts lose money when trading CFDs with this provider. You should consider whether you understand how CFDs work and whether you can afford to take the high risk of losing your money.
Stratos Europe Ltd (tradu.com ):
CFDs are complex instruments and come with a high risk of losing money rapidly due to leverage. 66% of retail investor accounts lose money when trading CFDs with this provider. You should consider whether you understand how CFDs work and whether you can afford to take the high risk of losing your money.
Stratos Global LLC (tradu.com ):
Losses can exceed deposits.
Please be advised that the information presented on TradingView is provided to Tradu (‘Company’, ‘we’) by a third-party provider (‘TFA Global Pte Ltd’). Please be reminded that you are solely responsible for the trading decisions on your account. There is a very high degree of risk involved in trading. Any information and/or content is intended entirely for research, educational and informational purposes only and does not constitute investment or consultation advice or investment strategy. The information is not tailored to the investment needs of any specific person and therefore does not involve a consideration of any of the investment objectives, financial situation or needs of any viewer that may receive it. Kindly also note that past performance is not a reliable indicator of future results. Actual results may differ materially from those anticipated in forward-looking or past performance statements. We assume no liability as to the accuracy or completeness of any of the information and/or content provided herein and the Company cannot be held responsible for any omission, mistake nor for any loss or damage including without limitation to any loss of profit which may arise from reliance on any information supplied by TFA Global Pte Ltd.
The speaker(s) is neither an employee, agent nor representative of Tradu and is therefore acting independently. The opinions given are their own, constitute general market commentary, and do not constitute the opinion or advice of Tradu or any form of personal or investment advice. Tradu neither endorses nor guarantees offerings of third-party speakers, nor is Tradu responsible for the content, veracity or opinions of third-party speakers, presenters or participants.

Heading into major resistance?USD/CAD is rising towards the resistance level, which is a pullback resistance that aligns with the 127.2% Fibonacci extension and could potentially drop from this level to our take profit.
Entry: 148.88
Why we like it:
There is a pullback resistance level that aligns with the 127.2% Fibonacci extension.
Stop loss: 150.74
Why we like it:
There is a swing high resistance level.
Take profit: 147.08
Why we like it:
There is a pullback support level.
Enjoying your TradingView experience? Review us!
Please be advised that the information presented on TradingView is provided to Vantage (‘Vantage Global Limited’, ‘we’) by a third-party provider (‘Everest Fortune Group’). Please be reminded that you are solely responsible for the trading decisions on your account. There is a very high degree of risk involved in trading. Any information and/or content is intended entirely for research, educational and informational purposes only and does not constitute investment or consultation advice or investment strategy. The information is not tailored to the investment needs of any specific person and therefore does not involve a consideration of any of the investment objectives, financial situation or needs of any viewer that may receive it. Kindly also note that past performance is not a reliable indicator of future results. Actual results may differ materially from those anticipated in forward-looking or past performance statements. We assume no liability as to the accuracy or completeness of any of the information and/or content provided herein and the Company cannot be held responsible for any omission, mistake nor for any loss or damage including without limitation to any loss of profit which may arise from reliance on any information supplied by Everest Fortune Group.

Bullish reversal?USD/JPY has bounced off the pivot which acts as an overlap support and could rise to the 1st resistance.
Pivot: 146.62
1st Support: 144.86
1st Resistance: 150.96
Disclaimer:
The above opinions given constitute general market commentary, and do not constitute the opinion or advice of IC Markets or any form of personal or investment advice.
Any opinions, news, research, analyses, prices, other information, or links to third-party sites contained on this website are provided on an "as-is" basis, are intended only to be informative, is not an advice nor a recommendation, nor research, or a record of our trading prices, or an offer of, or solicitation for a transaction in any financial instrument and thus should not be treated as such. The information provided does not involve any specific investment objectives, financial situation and needs of any specific person who may receive it. Please be aware, that past performance is not a reliable indicator of future performance and/or results. Past Performance or Forward-looking scenarios based upon the reasonable beliefs of the third-party provider are not a guarantee of future performance. Actual results may differ materially from those anticipated in forward-looking or past performance statements. IC Markets makes no representation or warranty and assumes no liability as to the accuracy or completeness of the information provided, nor any loss arising from any investment based on a recommendation, forecast or any information supplied by any third-party.
