USD/JPY BEARS ARE STRONG HERE|SHORT
Hello, Friends!
We are targeting the 147.228 level area with our short trade on USD/JPY which is based on the fact that the pair is overbought on the BB band scale and is also approaching a resistance line above thus going us a good entry option.
Disclosure: I am part of Trade Nation's Influencer program and receive a monthly fee for using their TradingView charts in my analysis.
✅LIKE AND COMMENT MY IDEAS✅
USDJPY

USDJPY H4 | Bullish bounce offUSD/JPY has bounced off the buy entry which is a pullback support and could potentially rise from this level eot the take profit.
Buy entry is at 147.45, which is a pullback support.
Stop loss is at 146.61, which is a pullback support that lines up with the 61.8% Fibonacci retracement.
Take profit is at 148.75, which his a multi swing high resistance that lines up with the 127.2% Fibonacci extension.
High Risk Investment Warning
Trading Forex/CFDs on margin carries a high level of risk and may not be suitable for all investors. Leverage can work against you.
Stratos Markets Limited (tradu.com ):
CFDs are complex instruments and come with a high risk of losing money rapidly due to leverage. 65% of retail investor accounts lose money when trading CFDs with this provider. You should consider whether you understand how CFDs work and whether you can afford to take the high risk of losing your money.
Stratos Europe Ltd (tradu.com ):
CFDs are complex instruments and come with a high risk of losing money rapidly due to leverage. 66% of retail investor accounts lose money when trading CFDs with this provider. You should consider whether you understand how CFDs work and whether you can afford to take the high risk of losing your money.
Stratos Global LLC (tradu.com ):
Losses can exceed deposits.
Please be advised that the information presented on TradingView is provided to Tradu (‘Company’, ‘we’) by a third-party provider (‘TFA Global Pte Ltd’). Please be reminded that you are solely responsible for the trading decisions on your account. There is a very high degree of risk involved in trading. Any information and/or content is intended entirely for research, educational and informational purposes only and does not constitute investment or consultation advice or investment strategy. The information is not tailored to the investment needs of any specific person and therefore does not involve a consideration of any of the investment objectives, financial situation or needs of any viewer that may receive it. Kindly also note that past performance is not a reliable indicator of future results. Actual results may differ materially from those anticipated in forward-looking or past performance statements. We assume no liability as to the accuracy or completeness of any of the information and/or content provided herein and the Company cannot be held responsible for any omission, mistake nor for any loss or damage including without limitation to any loss of profit which may arise from reliance on any information supplied by TFA Global Pte Ltd.
The speaker(s) is neither an employee, agent nor representative of Tradu and is therefore acting independently. The opinions given are their own, constitute general market commentary, and do not constitute the opinion or advice of Tradu or any form of personal or investment advice. Tradu neither endorses nor guarantees offerings of third-party speakers, nor is Tradu responsible for the content, veracity or opinions of third-party speakers, presenters or participants.

Bearish drop off pullback resistance?USD/JPY has rejected off the resistance level which is a pullback resistance and could drop from this level to our take profit.
Entry: 148.36
Why we like it:
There is a pullback resistance level.
Stop loss: 149.49
Why we like it:
There is a pullback resistance that is slightly below the 161.8% Fibonacci extension.
Take profit: 146.61
Why we like it:
There is a pullback support that aligns with the 61.8% Fibonacci retracement.
Enjoying your TradingView experience? Review us!
Please be advised that the information presented on TradingView is provided to Vantage (‘Vantage Global Limited’, ‘we’) by a third-party provider (‘Everest Fortune Group’). Please be reminded that you are solely responsible for the trading decisions on your account. There is a very high degree of risk involved in trading. Any information and/or content is intended entirely for research, educational and informational purposes only and does not constitute investment or consultation advice or investment strategy. The information is not tailored to the investment needs of any specific person and therefore does not involve a consideration of any of the investment objectives, financial situation or needs of any viewer that may receive it. Kindly also note that past performance is not a reliable indicator of future results. Actual results may differ materially from those anticipated in forward-looking or past performance statements. We assume no liability as to the accuracy or completeness of any of the information and/or content provided herein and the Company cannot be held responsible for any omission, mistake nor for any loss or damage including without limitation to any loss of profit which may arise from reliance on any information supplied by Everest Fortune Group.

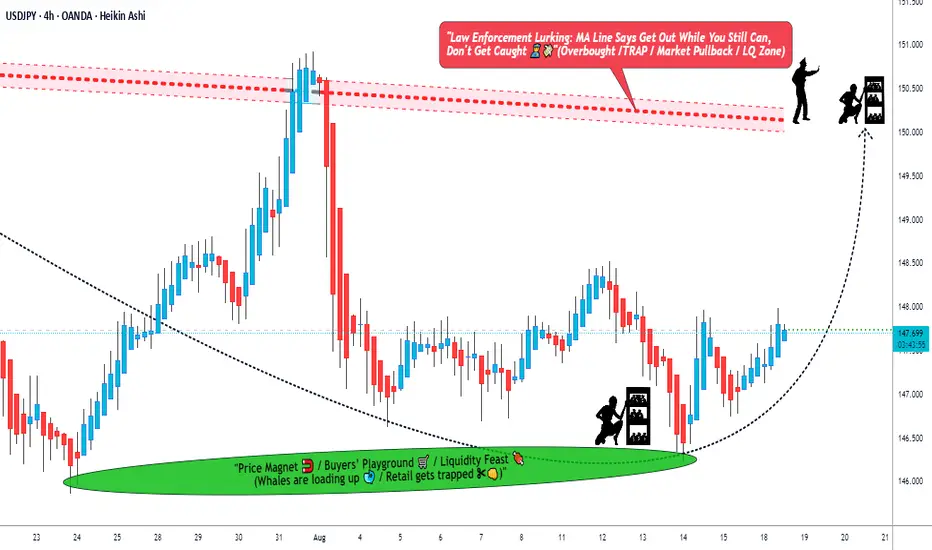
"The USDJPY Ninja Trade – Silent Entry, Big Exit!"🚨💰 USD/JPY “The Ninja” Forex Bank Heist Plan (Swing Trade) 🐱👤💴💵
🎭 Dear Money Makers, Robbers & Thief OG’s,
It’s time to gear up for our biggest Ninja heist on the Forex streets!
We’re breaking into the USD/JPY vault with a Bullish Master Plan – grab your mask, load your limit orders, and let’s rob the market clean! 💰🔫
🗡️ Heist Entry (Layering Style) 📈
Thief doesn’t enter with one bullet – we spray the vault with multiple limit orders! 🎯
First layer: 147.600
Second layer: 147.400
Third layer: 147.200
👉 Add more layers if you want a deeper pullback entry – the more locks you pick, the bigger the loot! 🏦💎
🛑 Thief Stop Loss
This is Thief SL 🔒: 146.500
But remember, dear ladies & gentlemen (Thief OG’s) – adjust your SL based on your own strategy, capital & risk appetite. Stay slick, don’t get caught! 🚔💨
🎯 Target Escape Zone
Police barricade spotted 🚨👮 @ 150.700
Our heist exit point is locked at 150.000 🏃♂️💨
👉 Make sure you grab the loot & escape before the cops arrive. Take profit & celebrate with stolen sushi 🍣 & sake 🍶!
⚠️ Thief Trading Notes
News drops = extra police patrols 🚔 – avoid opening fresh entries during major releases.
Trail your stops to lock in profits – no thief leaves empty-handed!
Stay alert to price traps – don’t get stuck behind enemy lines.
💎 If this heist plan made you some loot, smash that 💖 & BOOST button to power up the Thief Gang 🚀🤝💰
The more boosts, the bigger our robbery squad becomes!
Stay tuned, Ninjas 🐱👤 … the next heist plan is already loading.
💵💎🚀 Thief Trader OUT.
USDJPY Potential Buy 4HWeaker USD needs to extend so it can fall back on weekly scale.
4H triggered a potential Buy signal. Previous 2 times support didnt break and we see 3rd time small bullish 4H formed. This could suggest short term bullish reversal for the parity.
Levels to watch out
TP1: 148.3
TP2: 148.6
TP3: 148.75

USDJPY 30Min Engaged ( Bearish Reversal Entry Detected )Time Frame: 30-Minute Warfare
Entry Protocol: Only after volume-verified breakout
🩸Bearish Reversal - 147.750
➗ Hanzo Protocol: Volume-Tiered Entry Authority
➕ Zone Activated: Dynamic market pressure detected.
The level isn’t just price — it’s a memory of where they moved size.
Volume is rising beneath the surface — not noise, but preparation.
🔥 Tactical Note:
We wait for the energy signature — when volume betrays intention.
The trap gets set. The weak follow. We execute.

USDJPY H4 | Could we see a bounce from here?USD/JPY is falling towards the buy entry which is a pullback support and could bounce from this level to the take profit.
Buy entry is at 147.45, which is a pullback support.
Stop loss is at 146.61, which is a pullback support that aligns with the 61.8% Fibonacci retracement.
Take profit is at 148.75, which is a multi swing high resistance that aligns with the 127.2% Fibonacci extension.
High Risk Investment Warning
Trading Forex/CFDs on margin carries a high level of risk and may not be suitable for all investors. Leverage can work against you.
Stratos Markets Limited (tradu.com ):
CFDs are complex instruments and come with a high risk of losing money rapidly due to leverage. 65% of retail investor accounts lose money when trading CFDs with this provider. You should consider whether you understand how CFDs work and whether you can afford to take the high risk of losing your money.
Stratos Europe Ltd (tradu.com ):
CFDs are complex instruments and come with a high risk of losing money rapidly due to leverage. 66% of retail investor accounts lose money when trading CFDs with this provider. You should consider whether you understand how CFDs work and whether you can afford to take the high risk of losing your money.
Stratos Global LLC (tradu.com ):
Losses can exceed deposits.
Please be advised that the information presented on TradingView is provided to Tradu (‘Company’, ‘we’) by a third-party provider (‘TFA Global Pte Ltd’). Please be reminded that you are solely responsible for the trading decisions on your account. There is a very high degree of risk involved in trading. Any information and/or content is intended entirely for research, educational and informational purposes only and does not constitute investment or consultation advice or investment strategy. The information is not tailored to the investment needs of any specific person and therefore does not involve a consideration of any of the investment objectives, financial situation or needs of any viewer that may receive it. Kindly also note that past performance is not a reliable indicator of future results. Actual results may differ materially from those anticipated in forward-looking or past performance statements. We assume no liability as to the accuracy or completeness of any of the information and/or content provided herein and the Company cannot be held responsible for any omission, mistake nor for any loss or damage including without limitation to any loss of profit which may arise from reliance on any information supplied by TFA Global Pte Ltd.
The speaker(s) is neither an employee, agent nor representative of Tradu and is therefore acting independently. The opinions given are their own, constitute general market commentary, and do not constitute the opinion or advice of Tradu or any form of personal or investment advice. Tradu neither endorses nor guarantees offerings of third-party speakers, nor is Tradu responsible for the content, veracity or opinions of third-party speakers, presenters or participants.

Fundamental Market Analysis for September 23, 2025 USDJPYThe key fundamental driver remains unchanged: the yield and rate gap between the US and Japan, where the Bank of Japan maintains ultra-loose policy while the US supports relatively high yields, systematically supporting long USD positions against the yen. In quiet periods, carry trade mechanics work stably, and occasional verbal interventions from Tokyo usually have short-lived effect without trend base changes absent central bank policy shifts. On this background, even after pullbacks, the pair tends to resume gains reflecting yield premium and global USD demand amid strengthening US macro data.
News assessments on EURUSD and market sentiment highlight high USD sensitivity to inflation and labor data releases, which, upon strong data, usually translates into USDJPY gains via the UST curve. With ECB holding rates and markets expecting Fed easing later, short-term USD fluctuations are often data surprise-driven, while yen remains the "weak link" due to BOJ policy. Therefore, an entry near 147.800 is justified for tactical buying with controlled risk until signs of sustained policy shifts in Tokyo or sharp US yield drops emerge.
Current cross rates through EUR confirm the USDJPY calculated target near 147.800 for today's session, consistent with entry choice at 147.800 for carry-support continuation scenario. Risk management implies a tight stop within 0.20 given possible short-term volatility on news and comments from Japanese officials. The target around 148.800 reflects gradual advance amid sustaining divergence in US-Japan monetary regimes.
Trading recommendation: BUY 147.800, SL 147.600, TP 148.800

Bullish bounce off 50% Fibonacci support?USD/JPY is falling towards the pivot which is a pullback support that aligns with the 50% Fibonacci retracement and could bounce to the pullback resistance.
Pivot: 147.03
1st Support: 146
1st Resistance: 148.74
Disclaimer:
The above opinions given constitute general market commentary, and do not constitute the opinion or advice of IC Markets or any form of personal or investment advice.
Any opinions, news, research, analyses, prices, other information, or links to third-party sites contained on this website are provided on an "as-is" basis, are intended only to be informative, is not an advice nor a recommendation, nor research, or a record of our trading prices, or an offer of, or solicitation for a transaction in any financial instrument and thus should not be treated as such. The information provided does not involve any specific investment objectives, financial situation and needs of any specific person who may receive it. Please be aware, that past performance is not a reliable indicator of future performance and/or results. Past Performance or Forward-looking scenarios based upon the reasonable beliefs of the third-party provider are not a guarantee of future performance. Actual results may differ materially from those anticipated in forward-looking or past performance statements. IC Markets makes no representation or warranty and assumes no liability as to the accuracy or completeness of the information provided, nor any loss arising from any investment based on a recommendation, forecast or any information supplied by any third-party.

USDJPY SHORT TRADEUSDJPY is bull run however due to weaker dollar we can see a smart sell setup available on 15 minutes TF. Risk management required

USDJPY 30Min Engaged ( Bullish Reversal Entry Detected )Time Frame: 30-Minute Warfare
Entry Protocol: Only after volume-verified breakout
🩸Bullish Reversal - 148.000
➗ Hanzo Protocol: Volume-Tiered Entry Authority
➕ Zone Activated: Dynamic market pressure detected.
The level isn’t just price — it’s a memory of where they moved size.
Volume is rising beneath the surface — not noise, but preparation.
🔥 Tactical Note:
We wait for the energy signature — when volume betrays intention.
The trap gets set. The weak follow. We execute.

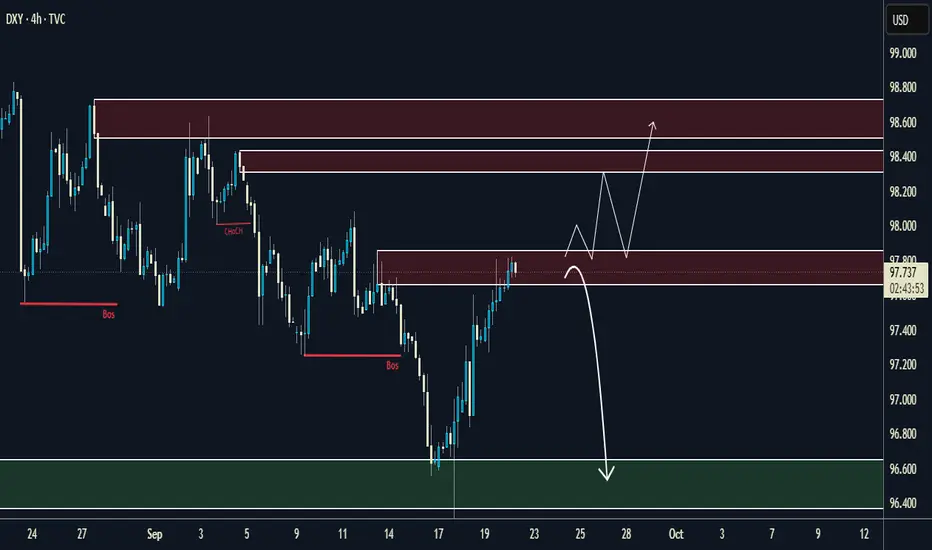
DXY 4H Outlook – Key Levels & Potential Scenarios💡 DXY 4H Outlook – Key Levels & Potential Scenarios
Price is currently testing an important supply zone (97.7 – 98.0) after showing a strong recovery. From here, I’m watching two possible outcomes:
🔼 Bullish Scenario
If buyers manage to hold above the 97.7 – 98.0 supply zone, we could see continuation toward the next major resistance between 98.2 – 98.6.
Break & retest of 98.0 would be a strong confirmation for buyers.
🔽 Bearish Scenario
If the 97.7 – 98.0 area rejects strongly, price could reverse back down toward the demand zone (96.4 – 96.6) for liquidity grab.
This zone has previously acted as a strong reaction point.
⚔️ Key Levels to Watch
Resistance: 98.0 | 98.2 | 98.6
Support: 97.4 | 96.6
📊 This setup gives both bulls and bears opportunities depending on how price reacts at these zones.
✅ If you enjoy this type of analysis, make sure to follow me so you don’t miss the next updates.
💼 For those who want account management services (personal or funded accounts), feel free to reach out – I can help you grow consistently with risk management and proven strategies.
USDJPY H4 | Approaching major resistanceUSD/JPY is rising towards the sell entry which acts as a pullback resistance that aligns with the 127.2% Fibonacci extension and the 61.8% Fibonacci projection, and could reverse from this level to the take profit.
Sell entry is at 148.84, which is a pullback resistance that aligns with the 127.2% Fibonacci extension and the 61.8% Fibonacci projection.
Stop loss is at 150.72, which is a swing high resistance.
Take profit is at 147.44, which is a pullback support level.
High Risk Investment Warning
Trading Forex/CFDs on margin carries a high level of risk and may not be suitable for all investors. Leverage can work against you.
Stratos Markets Limited (tradu.com ):
CFDs are complex instruments and come with a high risk of losing money rapidly due to leverage. 65% of retail investor accounts lose money when trading CFDs with this provider. You should consider whether you understand how CFDs work and whether you can afford to take the high risk of losing your money.
Stratos Europe Ltd (tradu.com ):
CFDs are complex instruments and come with a high risk of losing money rapidly due to leverage. 66% of retail investor accounts lose money when trading CFDs with this provider. You should consider whether you understand how CFDs work and whether you can afford to take the high risk of losing your money.
Stratos Global LLC (tradu.com ):
Losses can exceed deposits.
Please be advised that the information presented on TradingView is provided to Tradu (‘Company’, ‘we’) by a third-party provider (‘TFA Global Pte Ltd’). Please be reminded that you are solely responsible for the trading decisions on your account. There is a very high degree of risk involved in trading. Any information and/or content is intended entirely for research, educational and informational purposes only and does not constitute investment or consultation advice or investment strategy. The information is not tailored to the investment needs of any specific person and therefore does not involve a consideration of any of the investment objectives, financial situation or needs of any viewer that may receive it. Kindly also note that past performance is not a reliable indicator of future results. Actual results may differ materially from those anticipated in forward-looking or past performance statements. We assume no liability as to the accuracy or completeness of any of the information and/or content provided herein and the Company cannot be held responsible for any omission, mistake nor for any loss or damage including without limitation to any loss of profit which may arise from reliance on any information supplied by TFA Global Pte Ltd.
The speaker(s) is neither an employee, agent nor representative of Tradu and is therefore acting independently. The opinions given are their own, constitute general market commentary, and do not constitute the opinion or advice of Tradu or any form of personal or investment advice. Tradu neither endorses nor guarantees offerings of third-party speakers, nor is Tradu responsible for the content, veracity or opinions of third-party speakers, presenters or participants.

Heading into major resistance?USD/CAD is rising towards the resistance level, which is a pullback resistance that aligns with the 127.2% Fibonacci extension and could potentially drop from this level to our take profit.
Entry: 148.88
Why we like it:
There is a pullback resistance level that aligns with the 127.2% Fibonacci extension.
Stop loss: 150.74
Why we like it:
There is a swing high resistance level.
Take profit: 147.08
Why we like it:
There is a pullback support level.
Enjoying your TradingView experience? Review us!
Please be advised that the information presented on TradingView is provided to Vantage (‘Vantage Global Limited’, ‘we’) by a third-party provider (‘Everest Fortune Group’). Please be reminded that you are solely responsible for the trading decisions on your account. There is a very high degree of risk involved in trading. Any information and/or content is intended entirely for research, educational and informational purposes only and does not constitute investment or consultation advice or investment strategy. The information is not tailored to the investment needs of any specific person and therefore does not involve a consideration of any of the investment objectives, financial situation or needs of any viewer that may receive it. Kindly also note that past performance is not a reliable indicator of future results. Actual results may differ materially from those anticipated in forward-looking or past performance statements. We assume no liability as to the accuracy or completeness of any of the information and/or content provided herein and the Company cannot be held responsible for any omission, mistake nor for any loss or damage including without limitation to any loss of profit which may arise from reliance on any information supplied by Everest Fortune Group.

Bullish reversal?USD/JPY has bounced off the pivot which acts as an overlap support and could rise to the 1st resistance.
Pivot: 146.62
1st Support: 144.86
1st Resistance: 150.96
Disclaimer:
The above opinions given constitute general market commentary, and do not constitute the opinion or advice of IC Markets or any form of personal or investment advice.
Any opinions, news, research, analyses, prices, other information, or links to third-party sites contained on this website are provided on an "as-is" basis, are intended only to be informative, is not an advice nor a recommendation, nor research, or a record of our trading prices, or an offer of, or solicitation for a transaction in any financial instrument and thus should not be treated as such. The information provided does not involve any specific investment objectives, financial situation and needs of any specific person who may receive it. Please be aware, that past performance is not a reliable indicator of future performance and/or results. Past Performance or Forward-looking scenarios based upon the reasonable beliefs of the third-party provider are not a guarantee of future performance. Actual results may differ materially from those anticipated in forward-looking or past performance statements. IC Markets makes no representation or warranty and assumes no liability as to the accuracy or completeness of the information provided, nor any loss arising from any investment based on a recommendation, forecast or any information supplied by any third-party.

USDJPY Tight Range, Bearish Pressure Building Below TrendlineUSDJPY continues to trade inside a broad descending channel, with sellers stepping in near the 148.20–148.50 region once again. Despite short-term rebounds, the pair struggles to maintain momentum above resistance, signaling that bearish pressure remains intact. A break below near-term supports could open the way for a deeper move toward 145.50.
Current Bias
Bearish – short-term rejection at trendline resistance points to downside continuation unless bulls reclaim 148.50.
Key Fundamental Drivers
Federal Reserve: Softer U.S. data and cooling inflation have increased expectations for rate cuts later this year, weighing on USD strength.
Bank of Japan: Still holding an ultra-loose stance, but higher JGB yields and speculation about eventual policy tweaks are helping limit yen weakness.
Risk Sentiment: Equity pullbacks or tariff-related shocks can drive safe-haven demand for JPY, putting additional pressure on USDJPY.
Macro Context
Interest Rates: U.S. yields are softer as markets price in Fed easing; Japanese yields are edging higher, narrowing the yield gap.
Growth Trends: U.S. growth momentum is slowing, while Japan’s economy remains fragile but stable.
Geopolitics: Trade tensions and tariff headlines add uncertainty and may amplify yen demand in risk-off phases.
Primary Risk to the Trend
A sudden rebound in U.S. yields or stronger U.S. inflation prints could lift the dollar back above 148.50, invalidating the bearish setup.
Most Critical Upcoming News/Event
U.S. PCE inflation data
FOMC speeches regarding rate-cut timing
Japanese CPI release
Leader/Lagger Dynamics
USDJPY is often a leader within yen pairs, driving sentiment across JPY crosses. Movements here influence EURJPY, GBPJPY, and CADJPY.
Key Levels
Support Levels: 147.05, 145.52
Resistance Levels: 148.20, 149.25
Stop Loss (SL): 149.25 (above key resistance)
Take Profit (TP): 147.05 (first target), 145.52 (secondary target)
Summary: Bias and Watchpoints
USDJPY remains capped under trendline resistance, keeping the bias bearish as long as 148.50–149.25 holds. Stops above 149.25 protect against a breakout, while downside targets rest at 147.05 and then 145.52. The main watchpoint is U.S. inflation data and Fed commentary—if they confirm easing, sellers could gain control and extend the decline. Conversely, a surprise hawkish shift could trigger a squeeze higher.

USD/JPY: Is the Bear Coming Back?Hello traders, USD/JPY is still under the influence of the latest news from the BOJ . The Bank of Japan kept interest rates at 0.5% but started selling ETFs and REITs, showing they are gradually moving away from their ultra-loose policy. This is a hawkish signal that supports the yen. In addition, 2 out of 9 BOJ board members even wanted to raise rates to 0.75% , increasing market expectations that the JPY will become even stronger in the near future. Meanwhile, the Fed is in a rate-cutting cycle , leaving the USD weaker against the JPY.
From a technical perspective, USD/JPY has just touched the resistance area around 148.200 and bounced down. The downtrend line continues to act as pressure. The market structure is also forming lower highs, reinforcing the bearish outlook. The 148.200 level is a strong supply zone, difficult to break without unexpected news.
The preferred scenario is to look for sell entries around the resistance zone , with a near-term target at 147.000 and a further target at 146.000 – a key support level overlapping with the demand zone. A stop-loss should be placed above 148.500 to avoid false breakouts.
Overall, both fundamentals and technicals support a bearish move for USD/JPY . The dominant trend is bearish, and the effective strategy is to wait for pullbacks to sell with the trend.

EURJPY ANALYSISEURJPY – Sell to Buy Setup (1D TF)
Sellers are expected to take control early next week before bullish momentum returns. Traders can take advantage of this move by entering on lower timeframes, targeting the buying zone around 172.000. From there, price is anticipated to push upward toward 174.500.

USDJPY Is Bullish! Buy!
Here is our detailed technical review for USDJPY.
Time Frame: 1D
Current Trend: Bullish
Sentiment: Oversold (based on 7-period RSI)
Forecast: Bullish
The market is on a crucial zone of demand 147.950.
The oversold market condition in a combination with key structure gives us a relatively strong bullish signal with goal 150.890 level.
P.S
The term oversold refers to a condition where an asset has traded lower in price and has the potential for a price bounce.
Overbought refers to market scenarios where the instrument is traded considerably higher than its fair value. Overvaluation is caused by market sentiments when there is positive news.
Like and subscribe and comment my ideas if you enjoy them!

JPXY 1D TFFirst, note that price is currently in a downward trend. You can review my recent analysis on JPYX for better context on what I’m observing. At the moment, price is sitting on a strong demand level, and I anticipate a move toward the premium zone around 745–750 before potential sell opportunities emerge, after which XXX/JPY pairs may experience significant upward movement.

USDJPY 30Min Engaged ( Buy and sell Reversal Entry Detected )Time Frame: 30-Minute Warfare
Entry Protocol: Only after volume-verified breakout
🩸Bearish Reversal Movement from - 147.950
🩸Bullish Reversal - 147.450
➗ Hanzo Protocol: Volume-Tiered Entry Authority
➕ Zone Activated: Dynamic market pressure detected.
The level isn’t just price — it’s a memory of where they moved size.
Volume is rising beneath the surface — not noise, but preparation.
🔥 Tactical Note:
We wait for the energy signature — when volume betrays intention.
The trap gets set. The weak follow. We execute.

BoJ holds rates, yen gives up gainsThe Japanese yen climbed 0.50% earlier against the US dollar but was unable to consolidate these gains. In the European session, USD/JPY is trading at 147.92, down 0.04% on the day.
The Bank of Japan maintained its key interest rate at 0.50% at today's meeting. The non-move was widely expected by the markets. What was a surprise was the split vote, as two of the nine members voted in favor of a rate hike, indicating some support for a more hawkish monetary policy.
Governor Ueda has been cautious and has the markets guessing as to when the BoJ will raise rates. The markets have priced in a 59% chance of a rate hike before the end of the year, up from 50% a week ago, according to LSEG.
The policy statement noted that the domestic economy had "recovered moderately" but was still showing signs of weakness. Members also expressed concern that exports will be hurt by US tariffs, with Japan facing a 15% tarriff on most of its exports to the US.
On the inflation front, the statement said that underlying inflation is weak but is expected to increase gradually and reach the 2% inflation target. After years of deflation, prices are moving higher, which has led to expectations that a rate hike is just a question of timing. Consumer inflation is running between 2.5-3%, above the BoJ's 2% target. The central bank has stressed that it wants to see sustainable underyling inflation at around 2% before the next rate hike.
The BoJ is also concerned about the political turmoil in Japan. Prime Minister Ishiba recently resigned and the ruling Liberal Democratic Party is holding an election to choose a new leader.
USDJPY tested support at 147.77 and 147.51 earlier
There is resistance at 148.12 and 148.38

USDJPY Under Pressure! SELL!
My dear friends,
My technical analysis for USDJPY is below:
The market is trading on 147.95 pivot level.
Bias - Bearish
Technical Indicators: Both Super Trend & Pivot HL indicate a highly probable USDJPY continuation.
Target - 147.30
About Used Indicators:
A pivot point is a technical analysis indicator, or calculations, used to determine the overall trend of the market over different time frames.
Disclosure: I am part of Trade Nation's Influencer program and receive a monthly fee for using their TradingView charts in my analysis.
———————————
WISH YOU ALL LUCK
