USD/JPY: Increasing Downside PressureUSD/JPY is currently trading around the 147 level after a technical rebound, but the overall trend still leans to the downside. Recent news shows that the Fed has adopted a dovish stance, weakening the USD, while strong Japanese economic data has reinforced expectations that the BoJ may tighten policy further, lending greater support to the yen. Major institutions such as Nomura have even forecast that USD/JPY could fall toward the 142 area in the coming months.
From a technical perspective, the 148.2 resistance zone is acting as a strong barrier, where price is unlikely to break through given the current news backdrop does not favor USD strength. On the contrary, failure at this level could trigger a reversal, with USD/JPY likely to retest support at 146.2 and potentially extend lower toward the 145 region – a key area that could determine a deeper decline.
Thus, despite short-term fluctuations caused by profit-taking and temporary balance, the medium-term outlook continues to favor a bearish trend, in line with both fundamental drivers and the current technical structure.
USDJPY

Bearish drop off 61.8% Fibonacci resistance?USD/JPY is reacting off the pivot, which is a pullback resistance and could drop to the pullback support.
Pivot: 147.88
1st Support: 146.40
1st Resistance: 148.88
Risk Warning:
Trading Forex and CFDs carries a high level of risk to your capital and you should only trade with money you can afford to lose. Trading Forex and CFDs may not be suitable for all investors, so please ensure that you fully understand the risks involved and seek independent advice if necessary.
Disclaimer:
The above opinions given constitute general market commentary, and do not constitute the opinion or advice of IC Markets or any form of personal or investment advice.
Any opinions, news, research, analyses, prices, other information, or links to third-party sites contained on this website are provided on an "as-is" basis, are intended only to be informative, is not an advice nor a recommendation, nor research, or a record of our trading prices, or an offer of, or solicitation for a transaction in any financial instrument and thus should not be treated as such. The information provided does not involve any specific investment objectives, financial situation and needs of any specific person who may receive it. Please be aware, that past performance is not a reliable indicator of future performance and/or results. Past Performance or Forward-looking scenarios based upon the reasonable beliefs of the third-party provider are not a guarantee of future performance. Actual results may differ materially from those anticipated in forward-looking or past performance statements. IC Markets makes no representation or warranty and assumes no liability as to the accuracy or completeness of the information provided, nor any loss arising from any investment based on a recommendation, forecast or any information supplied by any third-party.

Could the price reverse from here?USD/JPY is rising towards the resistance level, which is a pullback resistance that lines up with the 61.8% Fibonacci retracement and could reverse from this level to our take profit.
Entry: 148.02
Why we like it:
There is a pullback resistance that lines up with the 61.8% Fibonacci retracement.
Stop loss: 148.74
Why we like it:
There is a pullback resistance.
Take profit: 146.37
Why we like it:
There is a pullback support that aligns with the 127.2% Fibonacci extension.
Enjoying your TradingView experience? Review us!
Please be advised that the information presented on TradingView is provided to Vantage (‘Vantage Global Limited’, ‘we’) by a third-party provider (‘Everest Fortune Group’). Please be reminded that you are solely responsible for the trading decisions on your account. There is a very high degree of risk involved in trading. Any information and/or content is intended entirely for research, educational and informational purposes only and does not constitute investment or consultation advice or investment strategy. The information is not tailored to the investment needs of any specific person and therefore does not involve a consideration of any of the investment objectives, financial situation or needs of any viewer that may receive it. Kindly also note that past performance is not a reliable indicator of future results. Actual results may differ materially from those anticipated in forward-looking or past performance statements. We assume no liability as to the accuracy or completeness of any of the information and/or content provided herein and the Company cannot be held responsible for any omission, mistake nor for any loss or damage including without limitation to any loss of profit which may arise from reliance on any information supplied by Everest Fortune Group.

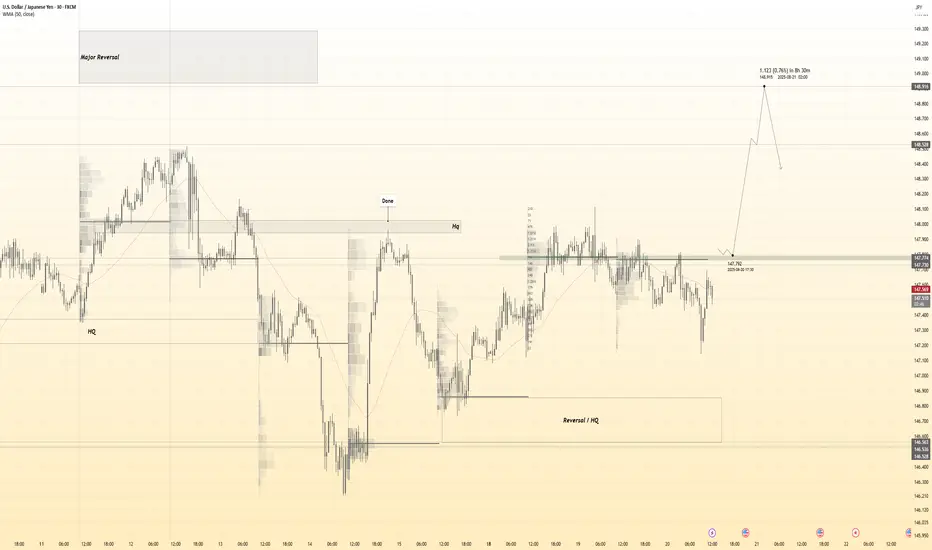
USDJPY 30Min Engaged ( Bearish Reversal entry Detected )Time Frame: 30-Minute Warfare
Entry Protocol: Only after volume-verified breakout
Bullish Reversal : 146.750
➗ Hanzo Protocol: Volume-Tiered Entry Authority
➕ Zone Activated: Dynamic market pressure detected.
The level isn’t just price — it’s a memory of where they moved size.
Volume is rising beneath the surface — not noise, but preparation.
🔥 Tactical Note:
We wait for the energy signature — when volume betrays intention.
The trap gets set. The weak follow. We execute.
1 hour ago
Trade closed manually
Avoid Closed Near entry 147.800

USDJPY has done false breakdown?USDJPY trade setup for today :
Before we look at potential entry in this pair first let’s look at multiple timeframe analysis in this market.
Monthly: 150.79 Monthly resistance price has got rejection strongly from the top
Weekly: After multiple doji formation, price is about to bounce off the support level potentially move back to the upside.
Daily: With a massive rejection on Friday, USDJPY started to fill the imbalance and price may continue to move back to the upside.
Entry timeframe 4H : Upon rejection from any previous candles support, price may continue to bounce.
Possible trade recommendation : Bullish entry with SL above sessions high

USDJPY: Bearish Momentum Builds After H4 Structure Shift!Greetings Traders,
In today’s analysis of USDJPY, we observe that the prevailing institutional order flow remains bearish, positioning us to focus on high-probability selling opportunities aligned with downside liquidity objectives.
Key Observations on H4:
Weekly Bearish Order Block Reaction: Price recently reacted to a weekly bearish order block, causing an H4 market structure shift (MSS) to the downside. This confirms that the H4 order flow is now in alignment with the higher timeframe bearish bias, with the weekly order block acting as a strong institutional resistance zone.
Liquidity Dynamics: Recent price action saw sell-side liquidity swept (external range liquidity), followed by a pullback into an H4 fair value gap (FVG), representing internal range liquidity. This reinforces the expectation that the H4 FVG may hold as a firm resistance zone.
Trading Plan:
Entry Strategy: Seek confirmation-based entries on the lower timeframes (M15 and below) within the H4 FVG to refine risk and validate the bearish continuation.
Target Objective: Focus on discount-side liquidity pools, consistent with institutional objectives to rebalance price and capture liquidity resting below.
The main liquidity draw is towards the weekly liquidity pool- which is our long term draw on liquidity.
Remain patient, allow the market to confirm your bias, and execute with disciplined risk management.
Kind regards,
The Architect 🏛️📉

149.50 Target Set — Aggressive Bulls OnlyTechnical analysis — USD/JPY (1-hour chart you shared)
The dominant feature on the chart is a deep bearish liquidity sweep (a single long vertical down candle) that reached roughly the 146.0–146.2 area before buyers sharply pushed price back up. That sweep looks like a stop-hunt followed by an immediate mean reversion: price recovered into a short-term retracement and is currently testing the resistance cluster around 148.115. The overall short-term structure now reads as a bounce off a flash low, producing a higher low, but bulls still need a reclaim of the recent swing highs to claim control.
Key visible levels (in plain language): the immediate resistance band to watch is the 148.115 → 148.520 → 148.778 zone (these are stacked red dotted levels on your chart). On the downside, the near pivot/support is ~147.166, with a tighter support cluster around 146.872 → 146.690 → 146.572 and the liquidity floor near 146.214–146.0 (the sweep low). If price holds above the 146.8–147.2 cluster, the odds favor another attempt at the 148.1–148.5 area; if it falls back through the 146.2 floor, sellers will likely regain initiative.
Structurally, this looks like a short-term mean-reversion opportunity rather than a clear trend continuation. The big wick down removed a lot of buy-side liquidity; the subsequent recovery suggests short-term buyers are present. However, volatility remains elevated — I see event icons under the timeline, so economic releases could create wide intraday swings. That argues either for waiting for confirmation (clean hourly closes) or using smaller position sizes if you enter immediately.
A quick numeric appraisal of the long trade box visible on the chart: entry ~147.166, stop ~146.872, target ~148.115. The risk per unit is 147.166 − 146.872 = 0.294 (about 29.4 pips on a JPY pair); the reward to target is 148.115 − 147.166 = 0.949 (about 94.9 pips). Reward:Risk ≈ 0.949 ÷ 0.294 = 3.23 — a favorable ratio if the support holds and volatility doesn’t spike.
What to watch next (trade management and confirmations): if the pair posts a clean hourly close above 148.115, that will reduce false-break risk and increase the chance of hitting higher targets (148.52 / 148.78).
Conversely, failure to close above 148.115 and a reversal candlestick there would be a bearish sign and could lead price back toward 146.87 and the flash low. Keep an eye on hourly momentum indicators (RSI/MACD) for divergence and on volume/tick activity during any breakout attempt. Because economic events are on the chart timeline, avoid entering with full size immediately before a known print — widen stops or wait until the event is clear.
Trade setups (explicit — bullets as requested)
• Aggressive dip-buy (the chart’s boxed trade)
o Entry: ~147.10–147.20 (around current pivot).
o Stop: ~146.80–146.70 (chart SL ≈ 146.872).
o Take-profit 1: 148.115 (partial exit). Take-profit 2: 148.520 (scale out).
o R:R (to TP1): ~3.23 (94.9 pips reward / 29.4 pips risk).
o Notes: use reduced size if trading through event windows; a tight stop risks being clipped by noise.
• Conservative breakout long
o Entry: wait for an hourly close above 148.115.
o Stop: below the breakout candle low or below 147.166 pivot (give ~20–30 pips buffer depending on spread).
o Targets: 148.520, then 148.778 for larger bias confirmation.
o Notes: lowers false breakout risk; trade momentum, not wishful bias.
• Rejection short
o Entry: bearish price action / clear rejection at 148.115 (failed break or reversal candle).
o Stop: above recent wick high (above 148.520).
o Targets: first 146.872, then 146.214–146.0 if weakness continues.
o Notes: short becomes higher-probability if momentum indicators turn down at resistance.
Final recommendations: if you favor a cleaner edge, wait for a confirmed hourly close above 148.115 before chasing longs. If you prefer higher reward and accept higher risk, the boxed long is reasonable given the R:R, but size it conservatively and respect the 146.8 invalidation. Tell me if you want position-size calculations for a specific account balance and risk percent, or an annotated re-export of this chart with levels labeled for your TradingView.

USDJPY H4 | Bearish drop off 61.8% Fibonacci resistanceUSD/JPY is rising towards the sell entry which is a pullback resistance that aligns with the 61.8% Fibonacci retracement and could reverse from this level to the downside.
Sell entry is at 147.86, which is a pullback resistance that aligns with the 61.8% Fibonacci retracement.
Stop loss is at 148.73, which is an overlap resistance.
Take profit is at 145.93, which is an overlap support that aligns with the 61.8% Fibonacci retracement.
High Risk Investment Warning
Trading Forex/CFDs on margin carries a high level of risk and may not be suitable for all investors. Leverage can work against you.
Stratos Markets Limited (tradu.com ):
CFDs are complex instruments and come with a high risk of losing money rapidly due to leverage. 65% of retail investor accounts lose money when trading CFDs with this provider. You should consider whether you understand how CFDs work and whether you can afford to take the high risk of losing your money.
Stratos Europe Ltd (tradu.com ):
CFDs are complex instruments and come with a high risk of losing money rapidly due to leverage. 66% of retail investor accounts lose money when trading CFDs with this provider. You should consider whether you understand how CFDs work and whether you can afford to take the high risk of losing your money.
Stratos Global LLC (tradu.com ):
Losses can exceed deposits.
Please be advised that the information presented on TradingView is provided to Tradu (‘Company’, ‘we’) by a third-party provider (‘TFA Global Pte Ltd’). Please be reminded that you are solely responsible for the trading decisions on your account. There is a very high degree of risk involved in trading. Any information and/or content is intended entirely for research, educational and informational purposes only and does not constitute investment or consultation advice or investment strategy. The information is not tailored to the investment needs of any specific person and therefore does not involve a consideration of any of the investment objectives, financial situation or needs of any viewer that may receive it. Kindly also note that past performance is not a reliable indicator of future results. Actual results may differ materially from those anticipated in forward-looking or past performance statements. We assume no liability as to the accuracy or completeness of any of the information and/or content provided herein and the Company cannot be held responsible for any omission, mistake nor for any loss or damage including without limitation to any loss of profit which may arise from reliance on any information supplied by TFA Global Pte Ltd.
The speaker(s) is neither an employee, agent nor representative of Tradu and is therefore acting independently. The opinions given are their own, constitute general market commentary, and do not constitute the opinion or advice of Tradu or any form of personal or investment advice. Tradu neither endorses nor guarantees offerings of third

Fundamental Market Analysis for August 25, 2025 USDJPYFollowing dovish-leaning Fed rhetoric, demand for the dollar has eased and U.S. yields have retreated, reducing support for USDJPY. The pair has pulled back from recent highs as markets price a September Fed cut, narrowing the U.S.–Japan yield spread and making long USD positions against the yen less compelling.
Japan’s recent macro data in August has been more resilient than expected, and the Bank of Japan continues a cautious normalization with an emphasis on wages and sustained inflation at target. Against this backdrop, a modest domestic impulse in Japan and lower U.S. yields support the yen. Another factor is the market’s sensitivity to potential verbal interventions from Japan’s Ministry of Finance if the yen were to weaken again.
Near-term, risks for USDJPY are skewed lower: a softer Fed, steadier Japanese data, and the authorities’ intervention risk management create a fundamental case for the pair to decline. Barring a renewed jump in U.S. yields, the probability of further yen strength remains elevated.
Trading recommendation: SELL 147.250, SL 147.950, TP 146.500

Potential bullish bounce?USD/JPY is falling towards the pivot, which is a pullback support, and could bounce to the 1st resistance ,which is a pullback resistance.
Pivot: 146.32
1st Support: 143.31
1st Resistance: 151.12
Risk Warning:
Trading Forex and CFDs carries a high level of risk to your capital and you should only trade with money you can afford to lose. Trading Forex and CFDs may not be suitable for all investors, so please ensure that you fully understand the risks involved and seek independent advice if necessary.
Disclaimer:
The above opinions given constitute general market commentary, and do not constitute the opinion or advice of IC Markets or any form of personal or investment advice.
Any opinions, news, research, analyses, prices, other information, or links to third-party sites contained on this website are provided on an "as-is" basis, are intended only to be informative, is not an advice nor a recommendation, nor research, or a record of our trading prices, or an offer of, or solicitation for a transaction in any financial instrument and thus should not be treated as such. The information provided does not involve any specific investment objectives, financial situation and needs of any specific person who may receive it. Please be aware, that past performance is not a reliable indicator of future performance and/or results. Past Performance or Forward-looking scenarios based upon the reasonable beliefs of the third-party provider are not a guarantee of future performance. Actual results may differ materially from those anticipated in forward-looking or past performance statements. IC Markets makes no representation or warranty and assumes no liability as to the accuracy or completeness of the information provided, nor any loss arising from any investment based on a recommendation, forecast or any information supplied by any third-party.

USD/JPY: Weak USD Drives the Pair LowerUSD/JPY is currently trading within a descending channel, with near support at 146.400 and resistance at 148.500. After a strong pullback from 148.500, the price is trying to hold around 146.400.
News: The weakness in US economic indicators (GDP and CPI weaker than expected), along with remarks from Fed officials supporting a more cautious monetary policy, have caused the USD to weaken, providing space for pairs like USD/JPY to adjust lower.
Additionally, slower growth in the US economy and concerns over the Fed's rate hike potential have made the USD less attractive, especially compared to the Japanese yen, where monetary policy remains cautious.
Strategy: If the price breaks below 146.400, the downtrend could continue, targeting 146.000.

USD_JPY POTENTIAL LONG|
✅USD_JPY fell again to retest
The support of 146.500
But it is a strong key level
So I think that there is a high chance
That we will see a bullish rebound and a move up
LONG🚀
✅Like and subscribe to never miss a new idea!✅

USD-JPY Will Go UP! Buy!
Hello,Traders!
USD-JPY is making a nice
Rebound form the horizontal
Support of 146.350 after a
Strong move down and as
We are locally bullish biased
We will be expecting a
Local bullish rebound
Buy!
Comment and subscribe to help us grow!
Check out other forecasts below too!
Disclosure: I am part of Trade Nation's Influencer program and receive a monthly fee for using their TradingView charts in my analysis.

USDJPY: The Market Will Recover 🇺🇸🇯🇵
There is a high chance that USDJPY will grow on Monday,
following a formation of a huge Fair Value Gap FVG
after a Powell speech on Friday.
A trap that is followed by a bullish imbalance indicate
a highly probably bullish movement at least to 147.25 resistance.
❤️Please, support my work with like, thank you!❤️
I am part of Trade Nation's Influencer program and receive a monthly fee for using their TradingView charts in my analysis.

USD/JPY ~ Buy Opportunity.Hello traders. It's Nika.
We got here beautiful uptrend. This looks like the price will keep go high.
Our trade in this situation will be buying from support and TP on resistance.
Trade ratio 1:54 Risk 8%.

USDJPY 30Min Engaged ( Bullish Reversal entry Detected )
Time Frame: 30-Minute Warfare
Entry Protocol: Only after volume-verified breakout
Bullish Reversal : 146.750
➗ Hanzo Protocol: Volume-Tiered Entry Authority
➕ Zone Activated: Dynamic market pressure detected.
The level isn’t just price — it’s a memory of where they moved size.
Volume is rising beneath the surface — not noise, but preparation.
🔥 Tactical Note:
We wait for the energy signature — when volume betrays intention.
The trap gets set. The weak follow. We execute.
1 hour ago
Trade closed manually
Avoid Closed Near entry 147.800

USDJPY 30Min Engaged ( Bearish Reversal entry Detected )Time Frame: 30-Minute Warfare
Entry Protocol: Only after volume-verified breakout
Bearish Reversal : 148.850
➗ Hanzo Protocol: Volume-Tiered Entry Authority
➕ Zone Activated: Dynamic market pressure detected.
The level isn’t just price — it’s a memory of where they moved size.
Volume is rising beneath the surface — not noise, but preparation.
🔥 Tactical Note:
We wait for the energy signature — when volume betrays intention.
The trap gets set. The weak follow. We execute.
1 hour ago
Trade closed manually
Avoid Closed Near entry 147.800

XAU/USD | Gold Hits Double Targets – Is Another Drop on the Way?Based on the 4-hour gold chart, we can see that the price was strongly rejected from the $3348 zone, exactly as anticipated, and dropped to $3321—successfully hitting both targets at $3334 and $3324, delivering over 250 pips of profit! Currently, gold is trading around $3328, and I expect another bearish wave to follow soon. The next downside targets are $3318, $3311, and $3301. This analysis will be updated shortly!
Please support me with your likes and comments to motivate me to share more analysis with you and share your opinion about the possible trend of this chart with me !
Best Regards , Arman Shaban

Japanese inflation falls, yen extends lossesThe Japanese yen continues to lose ground on Friday. In the North American session, USD/JPY is trading at 148.68. Earlier, USD/JPY hit 148.77, its highest level since August 1.
Japan's core CPI, which excludes fresh food, dropped to 3.1% y/y in July, down from 3.3% and just above the market estimate of 3.0%. Headline CPI also declined to 3.1% from 3.3%, as rice inflation, which has skyrocketed, eased slightly.
Headline inflation has been above the Bank of Japan's 2% inflation target for 40 consecutive months but the central bank remains hesitant to raise rates, arguing that it needs more evidence that domestic demand and wages will keep underlying inflation sustainable at around 2%.
The BoJ meets next on September 19 and the markets widely expect another hold. The BoJ has a habit of catching the markets off guard and a rate hike is certainly a possibiity in September or October. The BoJ upgraded its inflation forecast for fiscal year 2025 at the July meeting from 2.2% to 2.7%, which supports the case for a rate hike in the coming months.
Central bankers are meeting up in Jackson Hole, Wyoming. The star of the show will be Federal Reserve Chair Powell, who will deliver a speech later today. The markets have priced in a rate cut at next month's Fed meeting and are hoping for some confirmation from Powell.
The Fed is caught between a rock and a hard place as it charts a rate path. Inflation is still high, which would support maintaining rates, but the labor market is deteriorating, which supports the case to lower rates and boost economic activity.
Should the Fed's primary focus be inflation or employment? There is a split among members, which was reflected in the rare split vote at the July meeting. The majority of the FOMC members, which voted to hold rates, judged the upside risk of inflation to be the primary concern, while the two members who voted to lower rates were most concerned about softening employment. The Fed meets next month and is widely expected to deliver its first rate cut since December 2024.

USDJPY Market Outlook | Fed Signals & Yields in FocusUSDJPY – Technical Outlook
USDJPY is trading around 148.67, just above the pivot zone (148.50 – 148.49), after breaking out of the recent consolidation range. The pair is showing bullish momentum, with near-term upside potential.
🔎 Bullish Scenario
As long as price holds above the pivot (148.50), the bias stays bullish.
Next upside targets sit at 149.00 – 149.49, followed by the key resistance at 149.92.
A breakout above 149.92 would open the way toward the major resistance at 151.01.
🔎 Bearish Scenario
If price falls back below the pivot line (148.50), USDJPY could retest support at 147.07.
A break below 147.07 would expose deeper support zones at 146.33 – 145.08, with stronger downside momentum possible if sellers regain control.
📍 Key Levels
Pivot: 148.50
Resistance: 149.00 – 149.49 – 149.92
Support: 148.50 – 147.07 – 146.33
USD not coming slowBull points
Bullish on higher timeframe
Rsi div on 1h
wait for trend reversal
RRR go for 1:2

USDJPY Will Go Up From Support! Buy!
Please, check our technical outlook for USDJPY.
Time Frame: 9h
Current Trend: Bullish
Sentiment: Oversold (based on 7-period RSI)
Forecast: Bullish
The market is approaching a significant support area 147.290.
The underlined horizontal cluster clearly indicates a highly probable bullish movement with target 148.688 level.
P.S
Overbought describes a period of time where there has been a significant and consistent upward move in price over a period of time without much pullback.
Disclosure: I am part of Trade Nation's Influencer program and receive a monthly fee for using their TradingView charts in my analysis.
Like and subscribe and comment my ideas if you enjoy them!

USDJPY 30Min Engaged ( Bullish Break out entry Detected )19 hours ago
Time Frame: 30-Minute Warfare
Entry Protocol: Only after volume-verified breakout
Bullish after Break : 147.800
➗ Hanzo Protocol: Volume-Tiered Entry Authority
➕ Zone Activated: Dynamic market pressure detected.
The level isn’t just price — it’s a memory of where they moved size.
Volume is rising beneath the surface — not noise, but preparation.
🔥 Tactical Note:
We wait for the energy signature — when volume betrays intention.
The trap gets set. The weak follow. We execute.
1 hour ago
Trade closed manually
Avoid Closed Near entry 147.800