USD/JPY, CAD/JPY, CAD/JPY Technical OutlookSome interesting setups are forming on the daily charts of USD/JPY, CAD/JPY and CHF/JPY. Keep in mind that USD/JPY will be more sensitive to the incoming US inflation report, which leaves the potential for some divergences to form among the Japanese yen pairs. Overall, my bias is for them to move lower in due course.
Matt Simpson, Market Analyst and City Index and Forex.com
USDJPY

USDJPY H4 | Bullish momentum to extendUSD/JPY is reacting off the buy entry which is a pullback resistance, and a breakout of this level could lead the price to rise to the upside.
Buy entry is at 147.98, which is a pullback resistance.
Stop loss is at 146.85, which is a multi-swing low support.
Take profit is at 149.15, which is a pullback resistance that aligns with the 61.8% Fibonacci retracement.
High Risk Investment Warning
Trading Forex/CFDs on margin carries a high level of risk and may not be suitable for all investors. Leverage can work against you.
Stratos Markets Limited (tradu.com ):
CFDs are complex instruments and come with a high risk of losing money rapidly due to leverage. 65% of retail investor accounts lose money when trading CFDs with this provider. You should consider whether you understand how CFDs work and whether you can afford to take the high risk of losing your money.
Stratos Europe Ltd (tradu.com ):
CFDs are complex instruments and come with a high risk of losing money rapidly due to leverage. 66% of retail investor accounts lose money when trading CFDs with this provider. You should consider whether you understand how CFDs work and whether you can afford to take the high risk of losing your money.
Stratos Global LLC (tradu.com ):
Losses can exceed deposits.
Please be advised that the information presented on TradingView is provided to Tradu (‘Company’, ‘we’) by a third-party provider (‘TFA Global Pte Ltd’). Please be reminded that you are solely responsible for the trading decisions on your account. There is a very high degree of risk involved in trading. Any information and/or content is intended entirely for research, educational and informational purposes only and does not constitute investment or consultation advice or investment strategy. The information is not tailored to the investment needs of any specific person and therefore does not involve a consideration of any of the investment objectives, financial situation or needs of any viewer that may receive it. Kindly also note that past performance is not a reliable indicator of future results. Actual results may differ materially from those anticipated in forward-looking or past performance statements. We assume no liability as to the accuracy or completeness of any of the information and/or content provided herein and the Company cannot be held responsible for any omission, mistake nor for any loss or damage including without limitation to any loss of profit which may arise from reliance on any information supplied by TFA Global Pte Ltd.
The speaker(s) is neither an employee, agent nor representative of Tradu and is therefore acting independently. The opinions given are their own, constitute general market commentary, and do not constitute the opinion or advice of Tradu or any form of personal or investment advice. Tradu neither endorses nor guarantees offerings of third-party speakers, nor is Tradu responsible for the content, veracity or opinions of third-party speakers, presenters or participants.

USD/JPY 30Min Engaged ( Bullish Reversal Entry Detected )Time Frame: 30-Minute Warfare
Entry Protocol: Only after volume-verified breakout
🩸Bullish Reversal : 146.850
➗ Hanzo Protocol: Volume-Tiered Entry Authority
➕ Zone Activated: Dynamic market pressure detected.
The level isn’t just price — it’s a memory of where they moved size.
Volume is rising beneath the surface — not noise, but preparation.
🔥 Tactical Note:
We wait for the energy signature — when volume betrays intention.
The trap gets set. The weak follow. We execute.

USDJPY Strong buy opportunity near the 1D MA50.Last time we looked into the USDJPY pair (June 13, see chart below) we gave a very timely buy signal, looking for a break-out, that easily hit our 148.675 Target:
Now we are looking for yet another buy opportunity as the price, having established a Channel Up, is being supported by the 1D MA50 (blue trend-line). As long as this Higher Low is preserved, we expect the new Bullish Leg to start.
We expect at least another +4.14% run, setting a 152.500 medium-term Target. Notice also how the 1D RSI is well supported on a Higher Lows trend-line.
-------------------------------------------------------------------------------
** Please LIKE 👍, FOLLOW ✅, SHARE 🙌 and COMMENT ✍ if you enjoy this idea! Also share your ideas and charts in the comments section below! This is best way to keep it relevant, support us, keep the content here free and allow the idea to reach as many people as possible. **
-------------------------------------------------------------------------------
Disclosure: I am part of Trade Nation's Influencer program and receive a monthly fee for using their TradingView charts in my analysis.
💸💸💸💸💸💸
👇 👇 👇 👇 👇 👇

USDJPYThis is a high probability in my eyes to run higher if im being honest. Im long on this pair are you?

USD/JPY Poised for Breakout as Fundamentals & Technicals AlignUSDJPY is entering a critical juncture where both macroeconomic conditions and price structure are pointing toward a potential bullish continuation. The pair has been consolidating just under a descending trendline after a sharp drop from July’s highs, but strong US fundamentals, a persistently dovish Bank of Japan, and upcoming political catalysts are creating the perfect environment for an upside breakout. If buyers can reclaim momentum above near-term resistance, the path toward retesting multi-month highs appears open, with yen crosses likely to follow the lead.
Technical Analysis (4H Chart)
Price is consolidating around 147.46 after falling from the 150.91 high.
A descending trendline from the late-July peak is being tested. A confirmed breakout would likely accelerate bullish momentum.
Key upside targets:
148.96 – immediate resistance & short-term target (previous swing high).
150.91 – major resistance at July’s high.
Stop-loss at 146.43 safeguards against deeper retracements.
The structure reflects a series of bullish continuation patterns (flags, breakouts, retracements).
Fundamental Analysis
Current Bias: Bullish
USD Strength: Strong US data and anticipation of Trump’s “major” economic announcement are lifting the dollar.
JPY Weakness: Despite better-than-expected Japan Eco Watchers Survey, the BoJ’s ultra-loose stance continues to suppress yen demand.
Rate Differentials: Still heavily in USD’s favor, sustaining upward pressure on USD/JPY.
Risk Sentiment: Even with mild geopolitical tensions, USD’s safe-haven appeal is preventing JPY from benefiting.
Risks:
Disappointing US political announcements.
Hawkish surprises from the BoJ.
Sharp swings in risk sentiment favoring the yen.
Key News/Events Ahead:
Trump’s economic policy reveal.
US CPI & PPI releases.
BoJ policy signals or commentary.
Leader/Lagger Dynamics:
USDJPY is the leader for yen crosses, often setting the tone for GBPJPY, AUDJPY, and CHFJPY.
Summary:
USDJPY’s bullish outlook is reinforced by the combination of favorable fundamentals and a technical setup pointing toward a breakout. A move above 147.80–148.00 could open the door to 148.96 in the short term and 150.91 in the medium term. With yen crosses closely tied to USDJPY’s movements, this pair’s breakout could spark broader JPY weakness across the board, making it a pivotal chart to watch in the days ahead.

USDJPY Looks Bearish, Your thoughts ?USDJPY Looks Bearish, It has been falling hard after touching resistances. Now it will continue to glide. Check your support and resistances and open positions accordingly. Wait for Price Again and strong solid breakouts to enter the market.
Disclaimer:
The content presented in this IMAGE is intended solely for educational and informational purposes. It does not constitute financial, investment, or trading advice.
Trading foreign exchange (Forex) on margin involves a high level of risk and may not be suitable for all investors. The use of leverage can work both for and against you. Before deciding to participate in the Forex market, you should carefully consider your investment objectives, level of experience, and risk tolerance.
There is a possibility that you may incur a loss of some or all of your initial investment, and therefore, you should not invest money that you cannot afford to lose. Be fully aware of all the risks associated with foreign exchange trading, and seek advice from a licensed and independent financial advisor if you have any doubts.
Past performance is not indicative of future results. Always trade responsibly.

USD JPY channelwell established USDJPY channel, expectation for channel support/resistance to hold ( may wick out ) until it doesnt ofcourse :D, into Q1 2026 when the fed gov play comes in to breakdown or the tarriff stagflation, take your pick. look to buy support channel and sell resistance line.

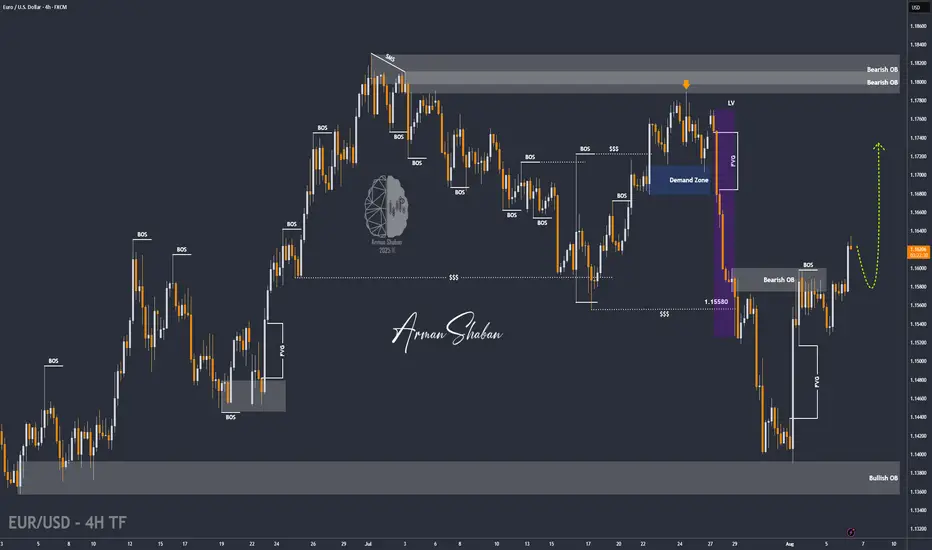
EUR/USD | Holding Above 1.16 Could Unlock More Upside! (READ IT)By analyzing the EURUSD chart on the 4-hour timeframe, we can see that the price reacted beautifully to all the marked zones on the chart. Especially after reaching the 1.14 demand area, it experienced a strong bullish move, rallying over 200 pips to hit 1.16. Currently, EURUSD is trading around 1.16220, and if it holds above the 1.16 level, we can expect further upside. The next bullish targets are 1.16435, 1.16780, 1.17100, and 1.17500.
Please support me with your likes and comments to motivate me to share more analysis with you and share your opinion about the possible trend of this chart with me !
Best Regards , Arman Shaban
Bullish bounce off pullback support?USD/JPY is falling towards the pivot which has been identified as a pullback support and could bounce to the 1st resistance.
Pivot: 145.27
1st Support: 143.29
1st Resistance: 151.05
Risk Warning:
Trading Forex and CFDs carries a high level of risk to your capital and you should only trade with money you can afford to lose. Trading Forex and CFDs may not be suitable for all investors, so please ensure that you fully understand the risks involved and seek independent advice if necessary.
Disclaimer:
The above opinions given constitute general market commentary, and do not constitute the opinion or advice of IC Markets or any form of personal or investment advice.
Any opinions, news, research, analyses, prices, other information, or links to third-party sites contained on this website are provided on an "as-is" basis, are intended only to be informative, is not an advice nor a recommendation, nor research, or a record of our trading prices, or an offer of, or solicitation for a transaction in any financial instrument and thus should not be treated as such. The information provided does not involve any specific investment objectives, financial situation and needs of any specific person who may receive it. Please be aware, that past performance is not a reliable indicator of future performance and/or results. Past Performance or Forward-looking scenarios based upon the reasonable beliefs of the third-party provider are not a guarantee of future performance. Actual results may differ materially from those anticipated in forward-looking or past performance statements. IC Markets makes no representation or warranty and assumes no liability as to the accuracy or completeness of the information provided, nor any loss arising from any investment based on a recommendation, forecast or any information supplied by any third-party.

USDJPYUSDJPY Is moving in range
Sell/Short from Resistance Buy/long from Support
This plans on playable befroe CPI data tomorrow / Untill Support Or resistance breaks, trade it between Support & Resistance
Manage risk as per your capital
support resistance
Candle stick cofirmation

USDJPY 4Hour TF - August 10th, 2025🟦 USDJPY 4H Analysis
📅 August 10, 2025
Top-Down Trend Bias:
• Monthly – Bullish
• Weekly – Bearish
• Daily – Bullish
• 4H – Bearish
USDJPY is consolidating inside the 147.500 zone. Higher timeframes remain mixed, with bullish monthly/daily trends but a bearish weekly and 4H structure, making this a key decision area.
🔍 Key Zone: 147.500
This zone is both a structural support and a potential breakout base. The reaction here will set the short term tone.
✅ Scenario A: Bullish Breakout (Blue Path)
1.If price breaks and holds above 147.50
2.Look for continuation into 151.500 resistance zone
3.Aligns with the monthly and daily bullish bias
⚠️ Scenario B: Bearish Breakdown (Orange Path)
1.If price closes below 147.500 zone
2.Watch for retest + rejection to confirm downside continuation
Target: 145.00 support zone
This setup aligns with the bearish weekly and 4H bias.
🧠 Final Notes
• HTF momentum is split, confirmation at the zone is critical
• Blue path favors trend continuation on higher timeframes
• Orange path keeps short term sellers in control

USD/CHF BEARISH BIAS RIGHT NOW| SHORT
Hello, Friends!
USD/CHF pair is trading in a local downtrend which know by looking at the previous 1W candle which is red. On the 1D timeframe the pair is going up. The pair is overbought because the price is close to the upper band of the BB indicator. So we are looking to sell the pair with the upper BB line acting as resistance. The next target is 0.787 area.
Disclosure: I am part of Trade Nation's Influencer program and receive a monthly fee for using their TradingView charts in my analysis.
✅LIKE AND COMMENT MY IDEAS✅

USDJPYLooking for buys for usdjpy as price is lined up for a potential run higher to take liquidity.

USD/JPY BEARS ARE STRONG HERE|SHORT
Hello, Friends!
We are targeting the 145.012 level area with our short trade on USD/JPY which is based on the fact that the pair is overbought on the BB band scale and is also approaching a resistance line above thus going us a good entry option.
Disclosure: I am part of Trade Nation's Influencer program and receive a monthly fee for using their TradingView charts in my analysis.
✅LIKE AND COMMENT MY IDEAS✅

USD-JPY Local Short! Sell!
Hello,Traders!
USD-JPY made a retest
Of the horizontal resistance
Of 148.101 from where we
Are already seeing a bearish
Reaction so we will be
Expecting a further
Bearish move down
Sell!
Comment and subscribe to help us grow!
Check out other forecasts below too!
Disclosure: I am part of Trade Nation's Influencer program and receive a monthly fee for using their TradingView charts in my analysis.

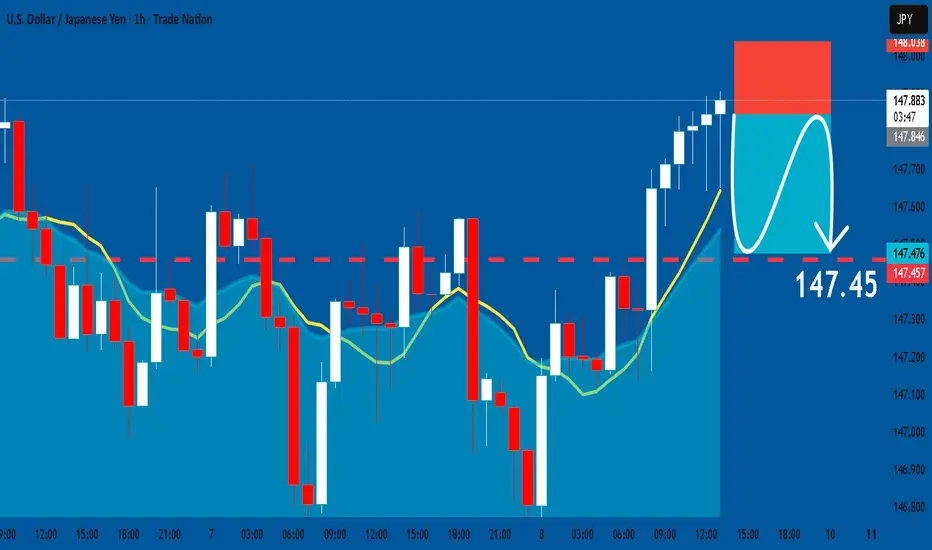
USDJPY: Short Trading Opportunity
USDJPY
- Classic bearish setup
- Our team expects bearish continuation
SUGGESTED TRADE:
Swing Trade
Short USDJPY
Entry Point - 147.84
Stop Loss - 148.03
Take Profit - 147.45
Our Risk - 1%
Start protection of your profits from lower levels
Disclosure: I am part of Trade Nation's Influencer program and receive a monthly fee for using their TradingView charts in my analysis.
❤️ Please, support our work with like & comment! ❤️
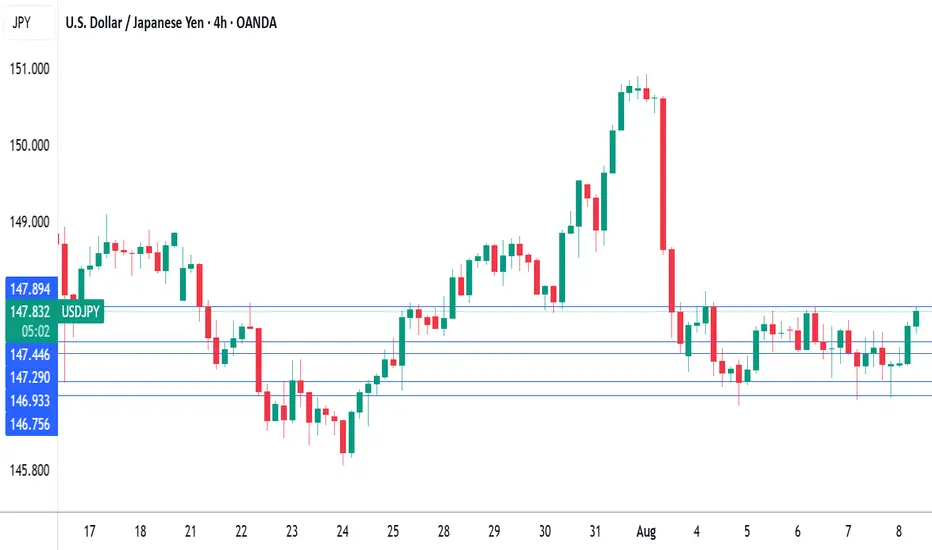
BoJ minutes indicate potential rate hike, yen slipsThe Japanese yen is lower on Friday. USD/JPY is trading at 147.66 in the North American session, up 0.38% on the day.
The Bank of Japan minutes from the July 31 meeting signaled that the BoJ remains committed to further rate hikes. This reiterates comments from BOJ President Ueda that he will raise rates, provided that growth and inflation are in line with the BoJs forecasts.
At the same time, members expressed concern about the uncetainty due to tariffs. Members acknowledged that the recent trade agreement between the US and Japan had reduced uncertainty and had made it more likely that inflation would be sustainable at the 2% target. Still, members noted that "high uncertainties remain regarding trade policies and their impact".
On Thursday, the government lowered its growth forecast for this fiscal year due to US tariffs and sticky inflation, which has hurt capital expenditure and consumer demand.
Speaking of consumer demand, Japan's household spending nosedived in in June with a decline of 5.2%. This was a sharp reversal from the May gain of 4.6% and well below the market estimate of -3.0%. Year-on-year, household spending eased to 1.3%, compared to 4.7% in May and shy of the market estimate of 2.6%.
The Federal Reserve is on track to lower rates in September, which would mark the first rate reduction since December 2024. Last week's soft July employment report saw nonfarm payrolls fall to 73 thousand. This was well short of the market estimate of 110 thousand and included sharp downward revisions to the May and June releases.
USD/JPY has pushed above resistance at 147.30 and is testing 147.45. Above, there is resistance at 147.89
1.4694 and 146.75 are the next support levels
USDJPY – From Shorts to Longs!USDJPY has been trading within a rising channel, maintaining an overall bullish structure in the medium term.
🔍 Current Setup:
We previously looked for shorts from the weekly resistance near the upper bound of the channel — and price reacted as anticipated.
Now, we are waiting for a retest of the lower bound, which is the intersection of the lower trendline and the daily support area, to look for trend-following longs in line with the prevailing bullish trend.
📌 Plan:
Shorts have already played out from the upper bound.
Next, watch for bullish reversal signals around the lower trendline + support confluence for potential long entries.
🎯 Patience is key — let price come to you before taking action.
📚 Always follow your trading plan regarding entry, risk management, and trade management.
Good luck!
All Strategies Are Good; If Managed Properly!
~Richard Nasr
Disclosure: I am part of Trade Nation's Influencer program and receive a monthly fee for using their TradingView charts in my analysis.

USD Set To bounce? EUR/USD, USD/JPY, USD/CHFIt has been a week since the US dollar plunged following a weak NFP report. Given it has consolidated within a tight range near last week's low, alongside price action clues on EUR/USD, USD/JPY and USD/CHF, I suspect the dollar could bounce before its losses resume.
Matt Simpson, Market Analyst at City Index and Forex.com

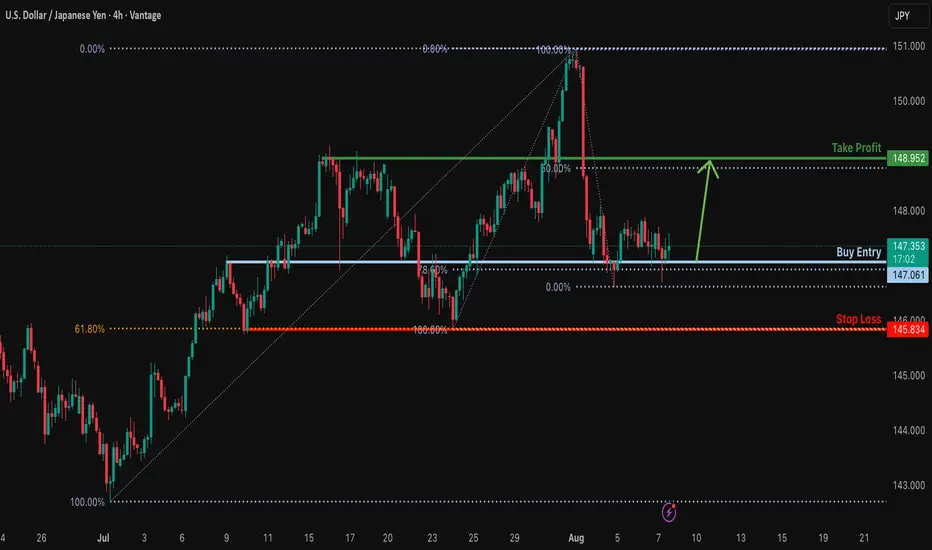
Bullish reversal?USD/JPY is reacting off the support level which is an overlap that aligns with the 78.6% Fibonacci retracement and could bounce from this level to our take profit.
Entry: 147.06
Why we like it:
There is an overlap support level that lines up with the 78.6% Fibonacci retracement.
Stop loss: 145.83
Why we like it:
There is a multi-swing low support.
Take profit: 148.95
Why we like it:
There is a pullback resistance level that is slightly above the 50% Fibonacci retracement.
Enjoying your TradingView experience? Review us!
Please be advised that the information presented on TradingView is provided to Vantage (‘Vantage Global Limited’, ‘we’) by a third-party provider (‘Everest Fortune Group’). Please be reminded that you are solely responsible for the trading decisions on your account. There is a very high degree of risk involved in trading. Any information and/or content is intended entirely for research, educational and informational purposes only and does not constitute investment or consultation advice or investment strategy. The information is not tailored to the investment needs of any specific person and therefore does not involve a consideration of any of the investment objectives, financial situation or needs of any viewer that may receive it. Kindly also note that past performance is not a reliable indicator of future results. Actual results may differ materially from those anticipated in forward-looking or past performance statements. We assume no liability as to the accuracy or completeness of any of the information and/or content provided herein and the Company cannot be held responsible for any omission, mistake nor for any loss or damage including without limitation to any loss of profit which may arise from reliance on any information supplied by Everest Fortune Group.
USDJPY Weakening or a Correction to the Uptrend✏️ OANDA:USDJPY is approaching the old Break out support zone. The convergence zone of the 2 EMA lines. If there is a sweep to the support zone at the beginning of the week, it will be an opportunity to buy to continue the bullish wave structure. When this 146.200 zone is broken, the uptrend will be broken and we have to wait for new momentum to determine the next trend.
📉 Key Levels
Support: 146.200-143.200
Resistance: 150.800-154.500
Buy zone 146.300 (Support & Trendline)
Buy zone 143.200 Strong support zone
Target 154.500
Leave your comments on the idea. I am happy to read your views.

XAU/USD | Gold at a Turning Point – Breakout or Breakdown Ahead?By analyzing the gold chart on the 4-hour timeframe, we can see that after our last analysis, gold continued its correction and dropped to $3358. It’s currently trading around $3367, and for the bullish scenario to remain valid, we need to see price hold above $3358 and soon close above $3370. If this happens, another bullish move could follow.
Otherwise, if gold breaks and stabilizes below $3358, this scenario will be invalidated, and the alternative outlook suggests further downside toward $3349 and $3339. This analysis will be updated — and don’t forget to show your support, friends!
Please support me with your likes and comments to motivate me to share more analysis with you and share your opinion about the possible trend of this chart with me !
Best Regards , Arman Shaban
