Bullish bounce off major support?USD/JPY has bounced off the pivot and could rise to the 1st resistance.
Pivot: 149.69
1st Support: 146.58
1st Resistance: 156.29
Disclaimer:
The above opinions given constitute general market commentary, and do not constitute the opinion or advice of IC Markets or any form of personal or investment advice.
Any opinions, news, research, analyses, prices, other information, or links to third-party sites contained on this website are provided on an "as-is" basis, are intended only to be informative, is not an advice nor a recommendation, nor research, or a record of our trading prices, or an offer of, or solicitation for a transaction in any financial instrument and thus should not be treated as such. The information provided does not involve any specific investment objectives, financial situation and needs of any specific person who may receive it. Please be aware, that past performance is not a reliable indicator of future performance and/or results. Past Performance or Forward-looking scenarios based upon the reasonable beliefs of the third-party provider are not a guarantee of future performance. Actual results may differ materially from those anticipated in forward-looking or past performance statements. IC Markets makes no representation or warranty and assumes no liability as to the accuracy or completeness of the information provided, nor any loss arising from any investment based on a recommendation, forecast or any information supplied by any third-party.
USDJPY

Fundamental Market Analysis for October 20, 2025 USDJPYThe dollar–yen pair has stabilized around 150.700, but the fundamental backdrop favors a downward correction. Falling US Treasury yields and persistent expectations of Fed policy easing narrow the rate differential that previously supported USD/JPY. Against this background, demand for the yen as a safe-haven asset tends to increase whenever the dollar shows signs of weakening.
Japan’s domestic agenda sends mixed signals: cabinet reshuffles and discussion of economic measures provide short-term support to equities, but for the exchange rate the key driver remains the trajectory of US Treasury yields and the risk of investor caution near levels that previously drew attention from financial authorities.
Given recent US rate commentary and the decline in global yields, the base case is a gradual move in USD/JPY toward 149.500, barring new factors that sharply improve the dollar backdrop. Risks to this view include unexpectedly restrictive signals from the US or a renewed rise in yields.
Trade recommendation: SELL 150.700, SL 150.900, TP 149.950

USD-JPY Free Signal! Sell!
Hello,Traders!
USDJPY Price has tapped into a horizontal supply area after an impulsive corrective leg upward. Liquidity above previous highs has been swept, signaling potential bearish continuation as institutions fill orders within the premium zone. A reaction from this level could drive price lower toward 150.18.
-------------------
Stop Loss: 150.99¥
Take Profit: 150.18¥
Entry: 150.66¥
Time Frame: 3H
-------------------
Sell!
Comment and subscribe to help us grow!
Check out other forecasts below too!
Disclosure: I am part of Trade Nation's Influencer program and receive a monthly fee for using their TradingView charts in my analysis.

USDJPY Trading IdeaBased on Simple Technical Analysis ( Trendline + Support & Resistance )
Risk Disclaimer:
Please be advised that I am not telling anyone how to spend or invest their money. Take all of my analysis as my own opinion, as entertainment, and at your own risk. I assume no responsibility or liability for any errors or omissions in the content of this page, and they are for educational purposes only. Any action you take on the information in this analysis is strictly at your own risk. There is a very high degree of risk involved in trading. Past results are not indicative of future returns. Good luck :-)

yen and improve power !#USD-Yen
Given the current scenarios, my personal opinion is that the Yen is strengthening due to the heavy gap down, the downtrend line, the nearby resistance and of course the strength of #Gold.
Of course, I definitely won't enter without confirmation.

what about USDJPY ?It has returned from the golden Fibo zone (0.5 - 0.618) and is supported. It is true that we have a gap above and below the price, but the upward force is greater.

USDJPY possible trend reversalUSDJPY has got a rejection from an important daily support level with a series of higher low rejecting off the gap level. As with 4h timeframe market has created a strong trend reversal confirmation, there is a possiblity for the market to reverse with a potential inverted head and shoulder formation and could continue to bounce off the level.
There is a higher possiblity for the market to continue to risk up with a new uptrending market structure.

USDJPY Will Go Lower From Resistance! Sell!
Please, check our technical outlook for USDJPY.
Time Frame: 1h
Current Trend: Bearish
Sentiment: Overbought (based on 7-period RSI)
Forecast: Bearish
The market is trading around a solid horizontal structure 150.611.
The above observations make me that the market will inevitably achieve 150.126 level.
P.S
The term oversold refers to a condition where an asset has traded lower in price and has the potential for a price bounce.
Overbought refers to market scenarios where the instrument is traded considerably higher than its fair value. Overvaluation is caused by market sentiments when there is positive news.
Like and subscribe and comment my ideas if you enjoy them!

USD/JPY Breakout & Retest Buy Setup — Bullish Momentum Building Pair: USD/JPY
Timeframe: M30
Pattern: Falling Channel (Breakout Setup)
Directional Bias: Bullish (Buy Setup)
---
🔍 Technical Analysis
1. Descending Channel:
The price has been moving within a falling channel (marked in blue).
Recently, it broke above the upper trendline — a strong signal of trend reversal from bearish to bullish.
2. Retest Zone (Entry Zone):
The highlighted blue box near 149.817 – 149.333 represents a retest or demand zone.
After breakout, price often returns to this zone to gather liquidity before pushing upward.
This is an ideal entry point for buyers.
3. Structure Formation:
The “W” pattern shown indicates potential double-bottom support confirmation.
That suggests buying pressure building in the zone.
4. Momentum & Trend Shift:
Breakout candle shows strong bullish momentum with solid volume (price closing above the channel).
If price sustains above 149.817 after retest, expect continuation toward next resistance levels.
---
🎯 Trade Plan
Parameter Level Notes
Entry Point 149.817 – 149.600 Wait for bullish confirmation at retest
Stop Loss 149.333 Below the demand zone and structural low
Target Point (TP) 151.130 Based on previous structure resistance
Risk-Reward Ratio (RRR) ≈ 1:3 Strong setup for intraday swing
---
⚙ Confirmation Signals to Watch
Bullish engulfing or pin bar candle at entry zone ✅
RSI > 50 or MACD bullish crossover ✅
Rejection wicks forming at support ✅
---
📈 Summary
This chart shows a bullish breakout with a planned retest, making it a high-probability buy setup.
If price retests the 149.8–149.3 zone and shows bullish confirmation, entry is valid with a target near 151.1.
Keep stops tight and monitor for rejection candles near the entry zone.

Can USDJPY Hold Below 152.000? Sellers on WatchHey Traders,
In today’s session, we’re monitoring USDJPY for a selling opportunity around the 152.000 zone.
The pair remains within a broader downtrend, and current price action shows a corrective move approaching a key resistance area.
A rejection from this level could reaffirm the prevailing bearish momentum, while a breakout above may challenge the current trend structure.
Trade safe,
Joe.

USDJPY FREE SIGNAL|SHORT|
✅USDJPY Price is approaching a major supply level, where institutional sellers previously stepped in. A rejection from this zone could trigger a short-term pullback targeting the imbalance and liquidity void near 150.10.
—————————
Entry: 150.54
Stop Loss: 150.83
Take Profit: 150.10
Time Frame: 2H
—————————
SHORT🔥
✅Like and subscribe to never miss a new idea!✅

USDJPY Long Watch out 150.000 Psychological LevelHello Traders,
USDJPY Long Watch out for 150.000 Psychological Level,
Im, Looking to for a long now from 150.000 to 149.800 pullback, if that happens. I Don't expect another lower low in same pattern as recent days.

USDJPY: Market of Buyers
The analysis of the USDJPY chart clearly shows us that the pair is finally about to go up due to the rising pressure from the buyers.
❤️ Please, support our work with like & comment! ❤️

USDJPY 30Min Engaged ( Bullish & Bearish Entry Detected )➕ Bearish Reversal " 152.900 Zone
➕Bullish Reversal : 150.550
🩸 Volume Surge Confirmed — Institutional buyers active
🩸 Session Aligned — Timing matches liquidity expansion window
🩸 Cluster Shield Formed — Demand imbalance verified
🩸 Delta Shift Positive — Accumulation phase confirmed
🩸 POC Retest Completed — Weak shorts absorbed
🩸 Structure Break Pending — Bullish intention verified
Logic: This is engineered reversal, not prediction.
💯 Objective: Controlled execution with minimal drawdown.

USD/JPY 30-Min — Volume Buy & Sell Reversals Triggered🩸 Key Technical / Direction (Bullish Reversal Scenario)
Type: Mid-Term Reversal / Volume-Based Entry
———————————
Bearish Reversal Zone:
Price Range: 150.350
☄️Reasons for Entry:
➕Volume Cluster Support (2+ sessions confirmed)
➕Missing POC Retest from Previous Range
➕Delta Imbalance Shows Buyer Absorption
➕10:30 Fixed Range Sweep Below POC (Liquidity Cleared)
➕17:00 Candle Closed Above POC – Confirmation of Defense
➕Cluster Volume Expansion (Reversal Trigger)
➕Clean Liquidity Pool Below Session Low
👽Bias Summary:
Volume absorption visible at support.
Smart money positioned early — reversal logic validated.
🩸 Key Technical / Direction (Bearish Reversal Scenario)
Bullish Reversal Zone:
Price Range: 149.55
Reasons for Entry:
🩸Volume Cluster Resistance (2+ sessions confirmed)
🩸Unretested POC Above Current Session
🩸Delta Imbalance Showing Seller Control
🩸10:30 Fixed Range Sweep Above POC (Liquidity Cleared)
🩸17:00 Candle Failed to Reclaim Above POC
🩸Cluster Volume Expansion (Shift to Supply)
🩸Liquidity Pool Above Previous High
👽Bias Summary:
Distribution confirmed at volume peak.
Cluster rejection aligns with delta flow — reversal logic active.

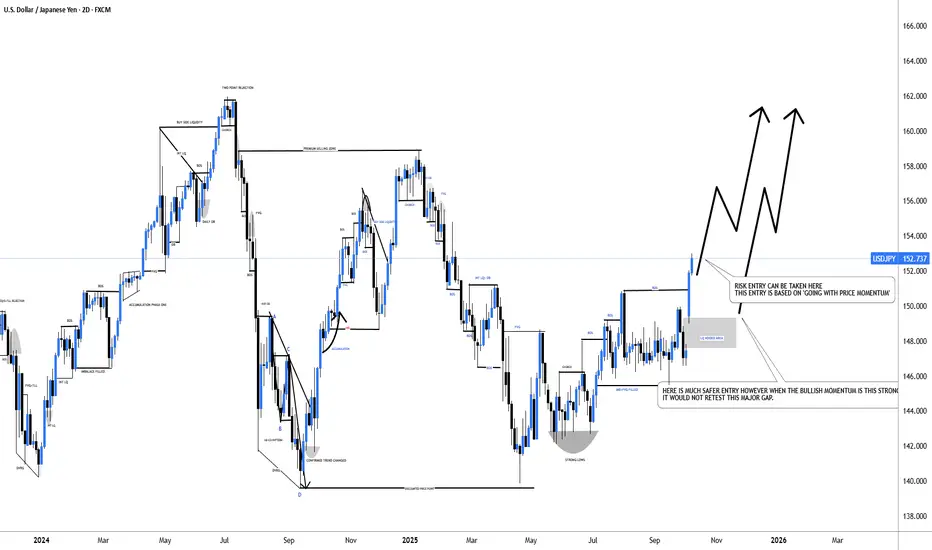
#USDJPY: From +1100 Pips To +1350 Pips A Possible Swing BuyDear Traders,
I hope you’re all having a great trading week!
The USDJPY is currently trading in a 152 price range and is experiencing extreme bullish momentum. The price is rallying without making any corrections, primarily due to the collapse of the Yen. We may see it fall further below. Given this market condition, it’s much riskier to trade with USDJPY.
Here are two approaches you may consider:
1. Take the entry at the current trading price with an accurate stop loss while using a smaller timeframe.
2. Wait for the price to return to the liquidity gap area, where it’s expected to fill.
Good luck, and thank you for your support throughout.
We appreciate your support.
Team Setupsfx_
USDJPY – Strong Downtrend, Opportunity for Further DeclineHello traders,
USDJPY is currently in a strong downtrend, influenced by macroeconomic factors, particularly the weakening of the USD and concerns about the global financial situation. The JPY has strengthened above the 150 JPY/USD level for the first time since early October, driven by safe-haven flows, alongside Rakuten's bond issuance with high interest rates, attracting additional capital into the yen.
Technical Analysis
The H1 chart shows USDJPY moving within a clear downward channel. Currently, EMA34 and EMA89 are acting as strong resistances, preventing the price from recovering to higher levels. The 150.30 level is the nearest resistance, and if the price fails to break through this, USDJPY may continue to drop towards 148.80 in the near future.
Trading Strategy
Sell on a rally near 150.30, as it is a strong resistance level.
If the price fails to hold above 150.00, there is a high probability of further decline towards 148.80, and potentially to 148.00.

USDJPY approaching a huge gap levelUSDJPY with it's continued down trend, price is approaching a huge gap level with massive FVG/imbalance. As with today's gap open DXY on continued down trend has created a momentum for the market to remain bearish which has given USDJPY to continue to remain bearish. As the market is approaching a gap that has not been tested in the past, it is high probable USDJPY to remain bearish at its lower and higher timeframe trend.

Stop!Loss|Market View: NZDUSD🙌 Stop!Loss team welcomes you❗️
In this post, we're going to talk about the near-term outlook for the NZDUSD currency pair☝️
Potential trade setup:
🔔Entry level: 0.57168
💰TP: 0.56450
⛔️SL: 0.57780
"Market View" - a brief analysis of trading instruments, covering the most important aspects of the FOREX market.
👇 In the comments 👇 you can type the trading instrument you'd like to analyze, and we'll talk about it in our next posts.
💬 Description: The New Zealand dollar's situation is similar to that of the Australian dollar, with both short- and medium-term USD strengthening expected. The focus remains on the 0.57550 level, from which, following a recent downward breakout, a further decline to 0.56000 is expected in the near future. If the price retests 0.57550 or accumulates near this level again, potential sell trades will likely have to be postponed.
Thanks for your support 🚀
Profits for all ✅
❗️ Updates on this idea can be found below 👇

USDJPY H4 | Bearish Momentum To ExtendUSD/JPY has rejected off the sell entry, which is a pullback resistance and could potentially drop from this level to the downside.
Sell entry is at 151.08, which is a pullback resistance.
Stop loss is at 152.49, whichis a pullback resistance.
Take profit is at 148.77, which is a pullback support that is slightly below the 61.8% Fibonacci retracement.
High Risk Investment Warning
Trading Forex/CFDs on margin carries a high level of risk and may not be suitable for all investors. Leverage can work against you.
Stratos Markets Limited (tradu.com ):
CFDs are complex instruments and come with a high risk of losing money rapidly due to leverage. 65% of retail investor accounts lose money when trading CFDs with this provider. You should consider whether you understand how CFDs work and whether you can afford to take the high risk of losing your money.
Stratos Europe Ltd (tradu.com ):
CFDs are complex instruments and come with a high risk of losing money rapidly due to leverage. 66% of retail investor accounts lose money when trading CFDs with this provider. You should consider whether you understand how CFDs work and whether you can afford to take the high risk of losing your money.
Stratos Global LLC (tradu.com ):
Losses can exceed deposits.
Please be advised that the information presented on TradingView is provided to Tradu (‘Company’, ‘we’) by a third-party provider (‘TFA Global Pte Ltd’). Please be reminded that you are solely responsible for the trading decisions on your account. There is a very high degree of risk involved in trading. Any information and/or content is intended entirely for research, educational and informational purposes only and does not constitute investment or consultation advice or investment strategy. The information is not tailored to the investment needs of any specific person and therefore does not involve a consideration of any of the investment objectives, financial situation or needs of any viewer that may receive it. Kindly also note that past performance is not a reliable indicator of future results. Actual results may differ materially from those anticipated in forward-looking or past performance statements. We assume no liability as to the accuracy or completeness of any of the information and/or content provided herein and the Company cannot be held responsible for any omission, mistake nor for any loss or damage including without limitation to any loss of profit which may arise from reliance on any information supplied by TFA Global Pte Ltd.
The speaker(s) is neither an employee, agent nor representative of Tradu and is therefore acting independently. The opinions given are their own, constitute general market commentary, and do not constitute the opinion or advice of Tradu or any form of personal or investment advice. Tradu neither endorses nor guarantees offerings of third-party speakers, nor is Tradu responsible for the content, veracity or opinions of third-party speakers, presenters or participants.

Potential bearish drop off?USD/JPY has rejected off the pivot which is an overlap resistance and oculd drop to the 1st support.
Pivot: 151.14
1st Suport: 148.79
1st Resistance: 153.11
Disclaimer:
The above opinions given constitute general market commentary, and do not constitute the opinion or advice of IC Markets or any form of personal or investment advice.
Any opinions, news, research, analyses, prices, other information, or links to third-party sites contained on this website are provided on an "as-is" basis, are intended only to be informative, is not an advice nor a recommendation, nor research, or a record of our trading prices, or an offer of, or solicitation for a transaction in any financial instrument and thus should not be treated as such. The information provided does not involve any specific investment objectives, financial situation and needs of any specific person who may receive it. Please be aware, that past performance is not a reliable indicator of future performance and/or results. Past Performance or Forward-looking scenarios based upon the reasonable beliefs of the third-party provider are not a guarantee of future performance. Actual results may differ materially from those anticipated in forward-looking or past performance statements. IC Markets makes no representation or warranty and assumes no liability as to the accuracy or completeness of the information provided, nor any loss arising from any investment based on a recommendation, forecast or any information supplied by any third-party.

USDJPY → False breakout? Target - gap?FX:USDJPY faces trend resistance during its rally and enters a correction. A retest of the range boundary is forming, the breakdown of which may trigger a sell-off.
The currency pair's growth, linked to the news, is slowing down. The price is testing the range boundary as part of a pullback, and the bullish reaction is weakening. Wednesday's daily candle closed below 151.23, which generally indicates buyer uncertainty.
Accordingly, there is a struggle for the 150.85 - 151.23 area, and the price closing below the key support zone will bring the price into the range. This, in turn, may provoke the closure of the gap (149.0 - 147.55).
Resistance levels: 151.23, 151.73
Support levels: 150.85, 149.93, 149.0
A false breakout and consolidation in the selling zone is a fairly strong signal that indicates the strength of the seller. A decline in the dollar index may trigger a decline in the price of the currency pair.
Best regards, R. Linda!

