USDJPY (dollarYen) BUYI expect long trade on USDJPY after price broke demand zone and retest and start to rally,it gave us confidence and confluences to take buy position.
Usdjpylongsetup

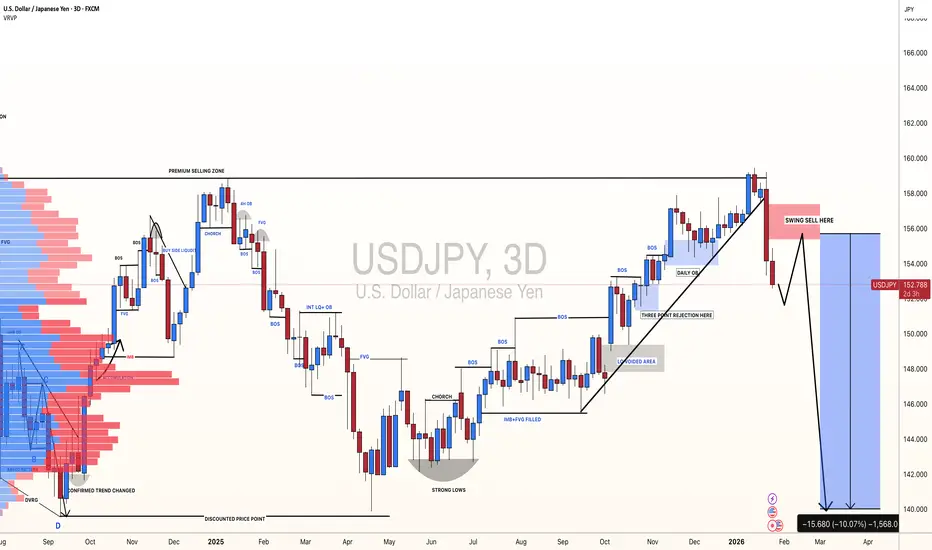
USDJPY: +1500 Pips Possible Swing Sell In Making?Dear Traders,
I hope you’re doing well. We have a fantastic selling opportunity that we believe could drop as much as 1500 pips. In our view, the US dollar is likely to continue plummeting while the Japanese yen might finally turn bullish after nearly a year of selling. This follows the US invasion of Venezuela and potential strict tariff changes in the coming days, all of which will significantly impact the USD. Furthermore, we have some important news this week that will likely shape our chart analysis.
If you enjoy our work, please like and comment. Follow us to receive notifications when we post analysis.
Team Setupsfx_
USD/JPY Price Outlook – Trade Setup (Bullish)📊 Technical Structure
FX:USDJPY USD/JPY rebounded strongly after defending the 155.70–155.90 support zone, forming a clear base and a sequence of higher lows. Price has reclaimed the 156.40 area and is now consolidating above former demand, suggesting a bullish continuation structure rather than a reversal.
As long as price holds above the key support, the technical bias remains tilted to the upside, with the next objective aligned toward the 157.40–157.60 resistance zone.
🎯 Trade Setup (Long)
Entry (Buy Zone): 155.70 – 155.90
Stop Loss: 155.55
Take Profit 1: 157.40
Take Profit 2: 157.60
Risk–Reward Ratio: ~1 : 3.37
📌 Invalidation:
A sustained break and close below 155.55 would invalidate the bullish setup.
🌍 Macro Background
Despite broader US Dollar softness driven by expectations of further Fed easing, the Japanese Yen continues to underperform. Fiscal concerns, political uncertainty, and limited near-term policy tightening from the Bank of Japan keep the JPY vulnerable.
In the short term, these factors support USD/JPY stabilization and upside follow-through, especially while technical momentum remains constructive.
🔑 Key Technical Levels
Resistance Zone: 157.40 – 157.60
Support Zone: 155.70 – 155.90
Structure Invalidation: 155.55
📝 Trade Summary
USD/JPY has completed a technical rebound from a major support area and is consolidating above it. The structure favours a buy-on-dip strategy, targeting a continuation move toward the upper resistance zone, provided price remains supported above 155.70.
⚠️ Disclaimer
This analysis is for reference only and does not constitute trading advice. Financial markets involve significant risk; proper risk and position management are essential.

USDJPY Trading Strategy – February 4, 2026USDJPY has posted three consecutive strong bullish days after rebounding from a short-term support zone on the H1 timeframe. Today’s strategy is to continue maintaining a long bias, looking to buy on a pullback toward the H1 EMA zone at 155.65–155.75.
Take-profit and stop-loss levels are set at ±30 pips from the entry price. The pending order is valid until 2:00 PM (Vietnam time).
If triggered, the position will be held until no later than 5:00 PM (Vietnam time), regardless of the outcome.

USDJPY: 1500+ Pips Selling Opportunity, Comment Your Views?Dear Traders,
We hope you’re doing well. We’ve identified a fantastic selling opportunity in the USDJPY pair. We anticipate a drop in the DXY and increased influence for the JPY in the market. We need confirmation within a shorter timeframe. The intraday timeframe is ideal for entering or executing any potential trades. Set a stop loss above the recent daily high and target a profit of 1500+ pips from your entry point.
If you like our idea, please like and comment below. Also, follow us to receive the latest updates.
Team Setupsfx_

USDJPYUSDJPY
- Bullish Channel as an corrective pattern in Short Time Frame
- Demand Zone
- RSI - Divergence
- Fibonacci Level - 50.00% / 61.80%
- Completed " 12345 " Impulsive Waves

#USD/JPY Buy Trade Scenario.Here’s an up-to-date USD/JPY Buy trade outlook (technical + fundamental) to help you assess whether positioning for a Upside makes sense right now.
Thank You......

#USDJPY: Massive Swing Buy,Our First Two Entries Are ActiveDear Traders,
Our three swing entries are active and going good meanwhile we have found another opportunity which can take price to another record high. We expect JPY to drop in coming days or week and DXY to remain stronger against the JPY. There is one entry zone and two take profits, use proper risk management while trading.
If you like our then consider liking and commenting on our trading ideas.
Good luck and trade safe!
Team Setupsfx_

USD/JPY Price Outlook – Trade Setup📊 Technical Structure
FX:USDJPY USD/JPY is currently undergoing a pullback toward a rising support zone near 158.10–157.99, following a strong impulsive rally that pushed price toward the 158.82–159.96 resistance area. The corrective move appears orderly and corrective rather than impulsive, suggesting profit-taking instead of trend reversal.
Price action is now stabilizing above the ascending trendline support, with buyers stepping in near the support zone. As long as this structure holds, the broader technical bias remains bullish, favouring a rebound toward the upper resistance band.
🎯 Trade Setup (Bullish Bias)
Entry Zone: 158.12 – 157.99
Stop Loss: 157.89
Take Profit 1: 158.82
Take Profit 2: 158.96
Risk–Reward Ratio: Approx. 1 : 3.45
📌 Invalidation
A sustained break and close below 157.89 would invalidate the bullish setup and signal a deeper corrective phase.
🌐 Macro Background
From a macro perspective, USD/JPY remains supported by policy divergence between the Federal Reserve and the Bank of Japan. While Japanese officials have stepped up verbal warnings against excessive Yen weakness, concrete intervention measures have not materialized.
Meanwhile, expectations that the Fed will keep interest rates unchanged in the near term continue to underpin the US Dollar. As long as U.S. yields remain elevated and BoJ policy normalization remains uncertain, downside pressure on USD/JPY is likely to stay limited, favouring dip-buying strategies.
🔑 Key Technical Levels
Resistance Zone: 158.82 – 158.96
Support Zone: 157.99 – 158.12
Bullish Invalidation: Below 157.89
📌 Trade Summary
USD/JPY is consolidating after a strong upside move and is currently holding above a critical rising support zone. As long as price remains supported above 157.99, the bias favours a buy-on-dips approach, targeting a rebound toward the upper resistance area.
⚠️ Disclaimer
This analysis is for reference only and does not constitute trading advice. Financial markets involve significant risk; proper risk and position management are essential.

Strategy for January 14, 2026: Continue to buy USDJPYFor USDJPY, I see no clear factors indicating a potential correction from the projected high zone around 161, which has been in place since July 2024, following the current bullish momentum. The short-term trend remains biased to the upside, with a buy-on-dips approach favored when price pulls back toward key EMA support on lower timeframes such as H1 and M30.
Today’s strategy is to buy in the 158.8–159.0 zone, with stop loss and take profit set at ±30 pips from the entry level. Positions may be held until 17:00 (Vietnam time) at the latest.

#USDJPY: One Last Bullish Push Taking Price To 170!The USDJPY pair has been bullish for the past few months, evidenced by the extreme bullish volume in the market. Given the weakening JPY, we believe the price is likely to rise further. A final push could help us with our trading setup.
You might consider setting two take profit levels.
Like and comment for more.
Team Setupsfx_

USDJPY Will Keep Growing!
HI,Traders !
USDJPY is trading in an
Uptrend and the pair
Made a breakout of the
Key horizontal level of 157.723
And the breakout is confirmed
So I think that we will see
A further move up !
Comment and subscribe to help us grow !

USDJPYUSDJPY
- Bullish Channel as an corrective pattern in Short Time Frame
- Break of Structure
- RSI - Divergence
- Completed " 123 " Impulsive Waves
- Order Block

USDJPY buy nowUSDJPY has been in a very clear uptrend for the last few weeks and has been for a while! It is currently inside an upward channel and has recently broken the last major resistance zone which means it is extremely likely to keep heading to the upside for much longer (just a very minor resistance level which is causing slight delays for its bullish movements). The next target will be the fibonacci extension zone which is shown on the chart. USDJPY has struggled to break below support but has constantly been breaking through resistance levels. BUY USDJPY NOW.

Buy USDJPY 12/1/2026The uptrend in USDJPY remains intact. After the close of last week, the pair was firmly confirmed above the 156.8 level. Today’s strategy is to continue buying in the 157.6–157.7 zone, based on short-term support levels on the H1 timeframe. Take profit and stop loss remain set at ±30 pips from the entry point.

USD/JPY Price Outlook – Trade Setup📊 Technical Structure
FX:USDJPY USD/JPY has broken out from a short-term descending trendline and is now holding above the 156.91–157.01 support zone, signalling a shift in near-term momentum. The recent impulsive rebound suggests that buyers are regaining control after a prolonged corrective phase.
Price action shows higher lows forming above the support area, while the pullbacks remain shallow, indicating constructive bullish structure. As long as USD/JPY stays supported above the key demand zone, the technical setup favours a continuation move toward the 157.75–157.85 resistance zone. The projected path suggests a brief consolidation or pullback followed by an upside extension, rather than a return into the prior downtrend.
🎯 Trade Setup (Bullish Bias)
Entry Zone: 157.01 – 156.91
Stop Loss: 156.84
Take Profit 1: 157.50
Take Profit 2: 157.80
Risk–Reward Ratio: Approx. 1 : 4.26
📌 Invalidation
A sustained break and close below 156.84 would invalidate the bullish setup and indicate renewed downside risk.
🌐 Macro Background
From a macro perspective, USD/JPY remains supported by persistent US Dollar strength ahead of the US Nonfarm Payrolls (NFP) report. The USD has been underpinned by firm positioning and short-term yield support, while markets remain cautious about aggressively pricing in further Federal Reserve rate cuts.
On the Japanese Yen side, recent upbeat Household Spending data has failed to translate into sustained JPY demand, as concerns persist over real wage weakness and uncertainty surrounding the Bank of Japan’s policy normalization path. In addition, rising China–Japan tensions and broader geopolitical frictions continue to weigh on sentiment toward the Yen.
In the near term, this macro divergence favours USD strength over JPY, reinforcing the bullish technical bias as long as key support levels hold.
🔑 Key Technical Levels
Resistance Zone: 157.75 – 157.85
Support Zone: 156.91 – 157.01
Bullish Invalidation: Below 156.84
📌 Trade Summary
USD/JPY has reclaimed a key support zone and broken above a descending trendline, indicating a shift back toward bullish momentum. As long as price remains supported above 156.91, the bias favours a buy-on-dips strategy, targeting a move toward the 157.75–157.85 resistance area. A decisive break below 156.84 would negate the bullish outlook.
⚠️ Disclaimer
This analysis is for reference only and does not constitute trading advice. Financial markets involve significant risk; proper risk and position management are essential.

USDJPYUSDJPY
- Fair Value Gap
- Exp Fiat as an corrective pattern in Short Time Frame
- Break of Structure
- RSI - Divergence
- Symmetrical Triangle in Long Time Frame

USDJPYUSDJPY
- Exp FIAT as an corrective pattern in Short Time Frame
- Impulse and " ABC " Correction
- Fibonacci Level - 50.00% / 61.80%
- Symmetrical Triangle in Long Time Frame
- Change of Characteristics
- Break of Structure

USD/JPY)Bullish trend analysis Read The captionSMC Trading point update
Technical analysis of USDJPY – 4H chart using SMC + Fibonacci OTE + EMA support.
⸻
Market Context (4H)
• Primary bias: Bullish continuation
• Higher-timeframe structure remains bullish
• Price is holding above EMA 200, confirming HTF trend
• Recent drop is a corrective pullback, not a reversal
⸻
Structure & Price Behavior
• Price made an impulsive move up → now correcting
• Pullback is moving into a discount zone
• Market is aligning with OTE (Optimal Trade Entry) levels
• EMA 200 + EMA 50 are acting as dynamic support
This is a textbook pullback → continuation setup.
⸻
Key Buy Zone (OTE + HTF Demand)
~155.40 – 155.70
Why this zone matters:
• Fibonacci OTE (0.705 – 0.79)
• HTF demand zone
• EMA 200 confluence
• Prior structure support
• Marked reaction area (green arrow)
This is where smart money typically reloads longs.
⸻
Trade Idea (Primary Scenario)
BUY Setup
• Entry: 155.40 – 155.70
• Stop Loss: Below 155.00
• Targets:
• TP1: 156.50
• TP2: 157.20
• Final TP: 157.75 (marked target point / liquidity above highs)
Risk–Reward: ~1:3+
⸻
Confirmation Checklist
Wait for confirmation inside the zone:
• Bullish engulfing candle
• Strong rejection wicks
• Lower-TF CHoCH
• No acceptance below EMA 200
⸻
Invalidation
• 4H close below ~155.00
• Acceptance below HTF demand + EMA 200
If invalidated → expect deeper correction toward lower support.
⸻ Mr SMC Trading point
Summary
This setup shows a high-probability bullish continuation
• Trend intact
• Pullback into discount
• OTE + EMA + demand confluence
• Clear upside liquidity target
Please support boost this analysis

USD/JPY | Market Structure Signals Upside Continuation🔥 USD/JPY “THE NINJA” — Breakout Play Above 157.800 | Smart Momentum Setup
📌 Asset
USD/JPY – “THE NINJA”
Forex Market Trade Opportunity Guide (Swing / Day Trade)
🧠 Trade Plan
📈 Bias: Bullish (Pending Order Strategy)
🧩 Market Logic: Compression → Resistance Break → Retest → Continuation
🎯 Entry Strategy
🚀 BUY ONLY AFTER CONFIRMED BREAKOUT
🔑 Key Level: 157.800
✅ Enter after resistance breakout + retest confirmation
⚠️ Avoid early entries before structure confirms
🛑 Stop Loss (Risk Control)
⛔ Thief SL Reference: 156.000
📌 Place SL only after breakout & retest is validated
⚖️ Adjust SL as per:
Your timeframe
Risk-to-reward model
Position sizing rules
📝 This SL is a reference, not a recommendation. Trade responsibly.
🎯 Target / Exit Logic
🚨 Target Zone: 160.500
👮♂️ Police Force Zone =
Strong historical resistance
Overbought conditions
Liquidity trap probability
Correction risk increases
💰 Book profits smartly — do not marry the trade
📝 TP is a reference, not a fixed rule. Manage exits based on market behavior.
🔗 Related Pairs to Watch (Correlation Map)
💵 JPY Strength / Weakness Confirmation
OANDA:EURJPY 📊
➝ Confirms broad JPY weakness if pushing higher
OANDA:GBPJPY ⚡
➝ High beta pair, leads momentum moves in JPY
OANDA:CHFJPY 🧱
➝ Risk sentiment gauge (safe-haven vs carry trade)
💲 USD Strength Confirmation
TVC:DXY 📈
➝ USD strength above key levels supports USD/JPY upside
OANDA:USDCHF 🔄
➝ Confirms dollar demand vs safe havens
👉 If JPY weakens across crosses + USD holds firm, USD/JPY continuation probability increases.
🌍 Fundamental & Economic Factors to Monitor
🏦 Bank of Japan (BoJ)
Policy remains accommodative
Yield control stance keeps JPY structurally weak
Any verbal intervention = short-term volatility only
🏛 Federal Reserve (USD Side)
Higher-for-longer rate narrative supports USD
Strong US data → USD bid → USD/JPY bullish pressure
📊 Key Upcoming Data (High Impact)
🇺🇸 US CPI / Core CPI
🇺🇸 NFP & Unemployment Rate
🇺🇸 Retail Sales
🇯🇵 BoJ statements / inflation data
📌 Strong US data + neutral BoJ = bullish continuation fuel
⚠️ Risk Notes
Avoid entries during high-impact news spikes
Wait for close above resistance, not just wicks
Liquidity hunts are common near psychological levels
🧭 Final Trader Reminder
📌 This is a structure-based breakout plan, not financial advice.
🧠 Trade with discipline.
📊 Let price confirm.
💼 Protect capital first — profits follow.
👍 If this breakdown adds value, support with a like & follow.
📢 Share with traders who respect structure, patience, and risk control.

USDJPY Swing Opportunity | Buyers Defend SMA📌 USD/JPY — “THE NINJA”
💱 Forex Market Trade Opportunity Guide (Swing / Day Trade)
🔍 Market Bias
🟢 Bullish Structure Confirmed
Price is respecting the Simple Moving Average (SMA) pullback, signaling continuation strength after corrective moves.
📈 Trading Plan
✅ Bullish Plan: Active
📊 Strategy Type: Trend Continuation + Pullback Execution
🎯 Entry Strategy (Layered Method)
🧩 Flexible Entry: Any price level using layering strategy
This approach helps reduce timing risk and improves average entry price.
🔹 Buy Limit Layers
156.000
156.500
157.000
➡️ (You may increase or adjust layers based on your risk model)
🛑 Stop Loss (Risk Control)
🔻 SL Level: 155.500
⚠️ Dear Ladies & Gentlemen, SL shared is not mandatory.
➡️ Adjust your stop loss according to your own strategy & risk appetite.
🎯 Profit Objective
🚔 POLICE FORCE Zone acting as strong resistance
📉 Market is showing overbought conditions + potential trap, suggesting profit-booking pressure.
✅ Target: 159.500
⚠️ TP shared is not mandatory.
➡️ Manage profits based on your own trading plan & discipline.
🧠 Key Technical Insights
📌 SMA acting as dynamic support
📌 Higher-timeframe trend remains bullish
📌 Layered entries improve R:R during pullbacks
📌 Resistance zone historically triggers corrections
🔗 Related Pairs to Watch (USD Correlation Focus)
💵 USD Index (DXY)
📈 Strength in DXY = Bullish confirmation for USD/JPY
📉 Weak DXY = Watch for pullback or consolidation
🇯🇵 JPY Crosses
EUR/JPY – Confirms yen weakness if bullish
GBP/JPY – High volatility, confirms momentum
CHF/JPY – Safe-haven comparison for risk sentiment
➡️ If JPY is weak across crosses, USD/JPY bullish bias stays valid
💲 USD Major Pairs
USD/CHF – Positive USD correlation
USD/CAD – Dollar strength confirmation
EUR/USD – Inverse relationship (EUR/USD down = USD strong)
🌍 Macro Sentiment Watch
📊 Risk-ON environment favors JPY weakness
🏦 Yield-driven USD demand supports upside continuation
⚠️ Watch for sharp corrections near resistance zones
⭐ If this analysis adds value
👍 Like | 💬 Comment | ⭐ Save | 🔁 Share
Your engagement helps this idea reach more traders.

USD/JPY) bullish trend analysis Read The captionSMC Trading point update
Technical analysis of USD/JPY 1-hour chart shows a bullish setup with key elements:
1. Pattern: Price forms an ascending channel and breaks out of the consolidation zone (blue area), indicating potential bullish continuation.
2. Indicators:
- EMA(200) at 155.825 and EMA(50) at 155.835 are near the current price, supporting the positive trend.
- Current price (155.814) is above EMAs, signaling bullish momentum.
3. Entry: Long position suggested after breakout around 155.835 (EMA 50).
4. Target: Upside target at 157.384 (target point), ~1.0% potential gain.
5. Stop Loss: Place below support zone (~155.000) to protect against
Mr SMC Trading point
reversal.
6. Confirmation: Wait for bullish candle confirmation post-breakout or signals from other indicators for validation.
Please support boost this analysis

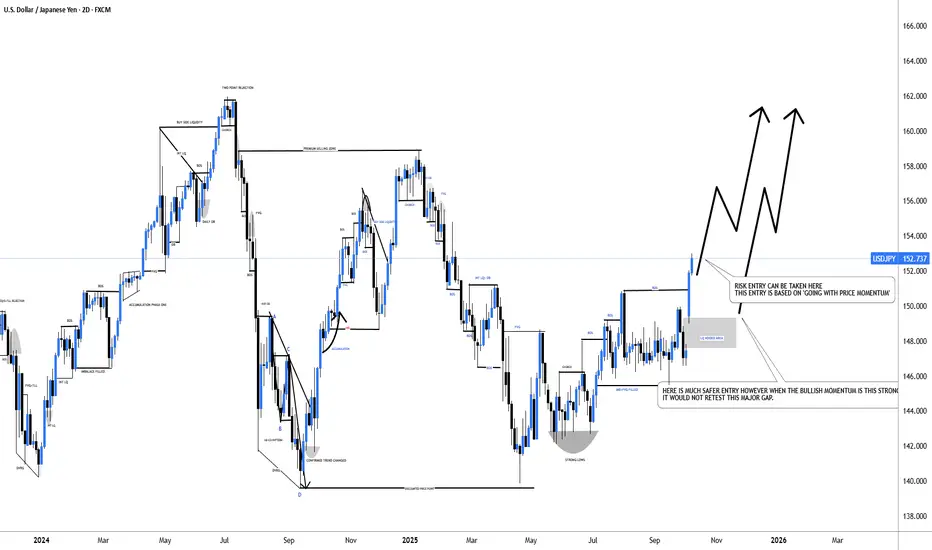
#USDJPY: From +1100 Pips To +1350 Pips A Possible Swing BuyDear Traders,
I hope you’re all having a great trading week!
The USDJPY is currently trading in a 152 price range and is experiencing extreme bullish momentum. The price is rallying without making any corrections, primarily due to the collapse of the Yen. We may see it fall further below. Given this market condition, it’s much riskier to trade with USDJPY.
Here are two approaches you may consider:
1. Take the entry at the current trading price with an accurate stop loss while using a smaller timeframe.
2. Wait for the price to return to the liquidity gap area, where it’s expected to fill.
Good luck, and thank you for your support throughout.
We appreciate your support.
Team Setupsfx_