USDJPY Holds Firm Above 151, Dollar Strength Faces Yen’s Haven USDJPY has surged to fresh highs above 153 before pulling back, showing how stretched the pair has become after weeks of relentless dollar strength. The dollar continues to benefit from sticky US inflation and hawkish Fed expectations, but the yen is finding some defensive flows as Japanese politics and global risk aversion come into play. This leaves USDJPY in a pivotal zone: either buyers defend the 151 handle for another push higher, or yen resilience drags the pair into a deeper correction.
Current Bias
Bullish – Despite the pullback, the trend remains tilted toward further USD strength as long as price stays above 151.00.
Key Fundamental Drivers
US Dollar (USD): Firm inflation, resilient labor data, and higher Treasury yields keep the dollar bid. The Fed is signaling patience before cutting, supporting front-end yield spreads in favor of the USD.
Japanese Yen (JPY): BOJ remains ultra-loose, but rising domestic political pressure and stronger wages are fueling speculation that policy normalization could come earlier than expected.
Risk Sentiment: JPY gains when equities wobble, while USD stays supported by yield and safe-haven flows.
Macro Context
Interest Rates: Fed is cautious about cutting, while BOJ is still holding rates near zero. The divergence remains a powerful driver of USDJPY.
Economic Growth: US growth has outpaced expectations, while Japan shows modest recovery but still depends heavily on exports.
Geopolitical Themes: US–China tariffs, Middle East risks, and Japanese election speculation all tilt in favor of JPY demand on risk-off days, but USD retains the upper hand when markets stabilize.
Primary Risk to the Trend
A sharp shift in BOJ guidance or surprise yen-supportive intervention could trigger a rapid unwind in USDJPY longs.
Most Critical Upcoming News/Event
US CPI data – any upside surprise could cement Fed caution and push USDJPY back to highs.
BOJ commentary – signals of policy adjustment would likely strengthen the yen.
Leader/Lagger Dynamics
USDJPY is a leader in yen pairs, often setting direction for EURJPY, GBPJPY, and CADJPY. It also acts as a barometer for global risk sentiment, with USDJPY strength often reflecting broad dollar dominance.
Key Levels
Support Levels:
151.50
149.95
Resistance Levels:
153.15
154.00
Stop Loss (SL): 148.40
Take Profit (TP): 153.15
Summary: Bias and Watchpoints
USDJPY remains bullish above 151.00, with a stop placed at 148.40 to guard against deeper corrections. A take-profit zone near 153.15 aligns with the recent rejection point. The key watchpoints are US inflation data and BOJ communication, both of which could determine if this move extends higher or stalls. For now, USDJPY remains the dominant driver of yen flows, keeping its role as a leader among JPY crosses.
Usdjpylongsetup

USD/JPY Breakout & Retest Buy Setup — Bullish Momentum Building Pair: USD/JPY
Timeframe: M30
Pattern: Falling Channel (Breakout Setup)
Directional Bias: Bullish (Buy Setup)
---
🔍 Technical Analysis
1. Descending Channel:
The price has been moving within a falling channel (marked in blue).
Recently, it broke above the upper trendline — a strong signal of trend reversal from bearish to bullish.
2. Retest Zone (Entry Zone):
The highlighted blue box near 149.817 – 149.333 represents a retest or demand zone.
After breakout, price often returns to this zone to gather liquidity before pushing upward.
This is an ideal entry point for buyers.
3. Structure Formation:
The “W” pattern shown indicates potential double-bottom support confirmation.
That suggests buying pressure building in the zone.
4. Momentum & Trend Shift:
Breakout candle shows strong bullish momentum with solid volume (price closing above the channel).
If price sustains above 149.817 after retest, expect continuation toward next resistance levels.
---
🎯 Trade Plan
Parameter Level Notes
Entry Point 149.817 – 149.600 Wait for bullish confirmation at retest
Stop Loss 149.333 Below the demand zone and structural low
Target Point (TP) 151.130 Based on previous structure resistance
Risk-Reward Ratio (RRR) ≈ 1:3 Strong setup for intraday swing
---
⚙ Confirmation Signals to Watch
Bullish engulfing or pin bar candle at entry zone ✅
RSI > 50 or MACD bullish crossover ✅
Rejection wicks forming at support ✅
---
📈 Summary
This chart shows a bullish breakout with a planned retest, making it a high-probability buy setup.
If price retests the 149.8–149.3 zone and shows bullish confirmation, entry is valid with a target near 151.1.
Keep stops tight and monitor for rejection candles near the entry zone.

#USDJPY: From +1100 Pips To +1350 Pips A Possible Swing BuyDear Traders,
I hope you’re all having a great trading week!
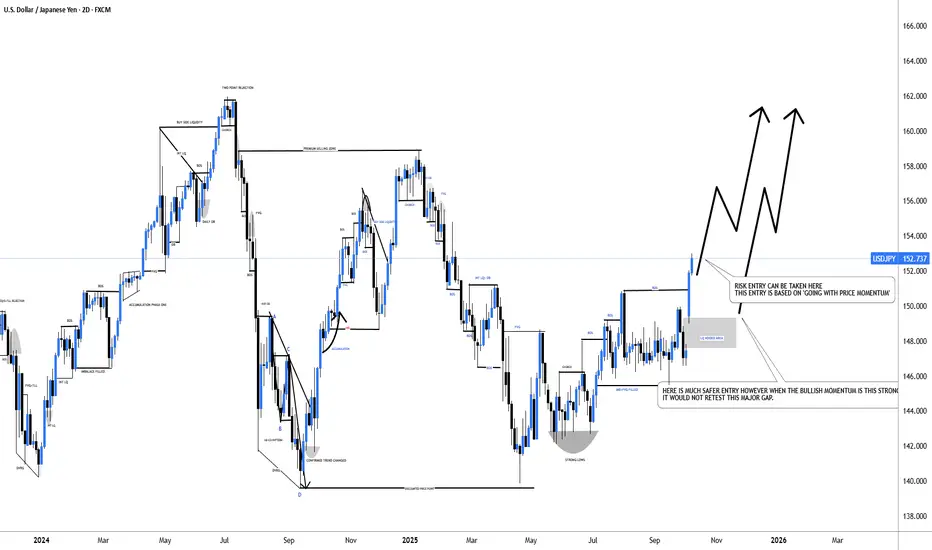
The USDJPY is currently trading in a 152 price range and is experiencing extreme bullish momentum. The price is rallying without making any corrections, primarily due to the collapse of the Yen. We may see it fall further below. Given this market condition, it’s much riskier to trade with USDJPY.
Here are two approaches you may consider:
1. Take the entry at the current trading price with an accurate stop loss while using a smaller timeframe.
2. Wait for the price to return to the liquidity gap area, where it’s expected to fill.
Good luck, and thank you for your support throughout.
We appreciate your support.
Team Setupsfx_
USD/JPY Swing Setup ⁝ Why Thief Layer Strategy Wins Here📊 Asset: USD/JPY — "The Ninja" Forex Bank Heist Plan (Swing/Day Trade)
🎯 USD/JPY Quick Snapshot
🔸 Daily Change: +0.39% (↑)
🔸 52-Week Range: 139.57 - 158.89
📊 Retail & Institutional Sentiment
🔹 Retail Traders: Bearish (60%) – Caution due to political uncertainty in Japan.
🔹 Institutional Traders: Bullish (70%) – Expect USD strength amid BOJ-Fed policy divergence.
🔹 Fear & Greed Index: 62/100 (Greed) – Moderate risk appetite favoring USD.
🔍 Fundamental & Macro Score
🏦 BOJ Policy Outlook:
• Rate hike uncertainty keeps JPY weak.
• Score: 3/10 (Bearish for JPY) 🐻
💵 Fed Policy Outlook:
• 90% chance of 25bps rate cut in September.
• Score: 7/10 (Bullish for USD) 🐂
🇯🇵 Political Risk (Japan):
• Leadership uncertainty weighs on JPY.
• Score: 4/10 (Negative for JPY) ⚠️
🌐 Trade War Risks:
• US tariff tensions may dampen USD strength.
• Score: 5/10 (Neutral)
🎯 Overall Market Outlook
🟢 Bullish (Long) Score: 65% ✅
🔴 Bearish (Short) Score: 35% ❌
📌 Summary: USD/JPY leans bullish due to BOJ hesitation, Fed cuts, and JPY political risks.
❓ WHY THIS Setup?
🔸 USD/JPY is respecting bullish structure while retail is mostly short → contrarian signal 🚨.
🔸 Institutional flow shows confidence in USD strength vs JPY weakness 📈.
🔸 BOJ hesitation + political instability in Japan continues to suppress JPY demand 🐻.
🔸 Layered entry strategy reduces risk of bad timing + maximizes capture of bullish wave ⚡.
🔸 Key target zone 151.500–152.000 offers strong risk/reward for swing & day traders 🎯.
✅ Thief Trading Plan: Bullish Setup
🔸 Entry (Thief Style Layer Strategy 🪤):
• 147.500
• 148.000
• 148.500
• 149.000
(Increase/adjust layers as per your own strategy.)
🔸 Stop Loss (Thief SL 🔒):
• Base SL @146.000
• Adjust according to risk tolerance & personal strategy
🔸 Target 🎯:
• Trap/reversal zone near 152.000
• Safer exit before reversal @ 151.500
⚡ Strategy Breakdown
🔹 Method: Thief OG Layer Strategy = scaling with multiple limit orders instead of single-entry.
🔹 Benefit: Absorbs noise, builds positions step-by-step, reduces FOMO.
🔹 Bias: Swing/Day trade friendly with bullish momentum in higher zones.
👀 Related Pairs to Watch:
💷 OANDA:GBPJPY
💶 OANDA:EURJPY
🇨🇭 OANDA:CHFJPY
💵 OANDA:USDCHF
✨ “If you find value in my analysis, a 👍 and 🚀 boost is much appreciated — it helps me share more setups with the community!”
#USDJPY #Forex #SwingTrading #DayTrading #JPY #ForexStrategy #TradingPlan #FXThief #LayerStrategy #SmartMoney

USD/JPY Price Outlook – Trade Setup📊 Technical Structure
FX:USDJPY USD/JPY is trading near 152.86, consolidating after touching fresh lows in JPY since February. The pair is holding within a rising channel, with support seen around 152.56–152.68 and resistance at 153.27–153.38. Short-term price action suggests buyers are defending the support zone, keeping the bias upward as long as the channel holds.
🎯 Trade Setup
Entry: 152.57–152.68 (buy on dips)
Stop Loss: 152.51
Take Profit 1: 153.27
Take Profit 2: 153.38
R:R Ratio: ~1 : 4.14
🏦 Macro Background
The Yen continues to face selling pressure amid Japan’s fiscal concerns and expectations that new PM Sanae Takaichi may favor expansive fiscal policies, delaying BoJ’s tightening path. However, sticky inflation above 2% and resilience in the Japanese economy keep speculation alive for another BoJ hike later this year.
Meanwhile, the USD consolidates strong weekly gains, supported by US economic resilience and political risks abroad. The ongoing US government shutdown remains a wildcard, though markets are still pricing in two Fed rate cuts (Oct & Dec 2025), which could eventually cap USD strength.
🔑 Key Technical Levels
Resistance Zone: 153.27 – 153.38
Support Zone: 152.57 – 152.68
Trendline Support: 152.50
📌 Trade Summary
Bias remains bullish above 152.50, with scope for a retest of 153.27–153.38. A breakdown below 152.10 would invalidate the setup and open downside risk.
⚠️ Disclaimer
This analysis is for reference only and does not constitute trading advice. Trading involves significant risk, and proper risk management is essential.

USDJPY Price Accumulated|Time For Bullish Distribution|Setupsfx|The price has accumulated nicely and is now distributing. We have three targets in mind, but set your own based on your analysis. Our approach is purely technical, but also includes a basic fundamental approach. This analysis concludes over 1500 pips and is a swing move. Please use this analysis as educational purposes only, as it does not guarantee that price will move exactly as predicted.
If you like our idea, please consider liking and commenting on it.
Good luck and trade safely!
Team Setupsfx_

USDJPY - Expecting Bullish Continuation In The Short TermH1 - Strong bullish momentum.
No opposite signs.
Until the two Fibonacci support zones hold I expect the price to move higher further.
If you enjoy this idea, don’t forget to LIKE 👍, FOLLOW ✅, SHARE 🙌, and COMMENT ✍! Drop your thoughts and charts below to keep the discussion going. Your support helps keep this content free and reach more people! 🚀
--------------------------------------------------------------------------------------------------------------------

Can USDJPY Sustain Bullish Momentum or Face a Sharp Reversal?🚀 USD/JPY "The Ninja" Forex Bank Heist Plan 🏦🎯
Swing/Day Trade | Bullish MA Breakout | Layer Entry Strategy
📊 WHY THIS PLAN? THE THIEF'S LOGIC
Professional analysis combining technical, fundamental, and sentiment factors for high-probability execution.
📈 Technical Edge: Critical 4H close above 148.500 confirms moving average breakout momentum and a shift in market structure, signaling the next leg up.
🎯 Layered Entries (Thief Strategy): Using multiple limit orders at 148.500, 148.300, 148.000, 147.800, and 147.700 ensures a better average entry price and allows us to "steal" pips from the market efficiently. You can add more layers based on your own risk!
⚖️ Bullish Sentiment Alignment: Both retail (60% Bullish 🐂) and institutional (55% Bullish 🐂) sentiment show a slight bullish tilt, supporting our technical thesis.
😎 Neutral Market Mood: The Fear & Greed Index at 53/100 (Neutral) indicates a balanced market with no extreme emotions. This provides a stable foundation for a breakout play without FOMO driving the price.
🌍 Fundamental & Macro Backdrop: A Fundamental Score of 6.5/10 highlights moderate USD strength from US economic stability, countered by JPY support from BoJ policy rumors. The Macro Score of 6/10 reflects global uncertainties but also potential volatility we can capitalize on.
🗺️ TRADE PLAN: THE HEIST BLUEPRINT
Entry Conditions
✅ CONFIRMATION: 4H candle MUST CLOSE ABOVE 148.500 (Wait for the confirmation candle to avoid fakeouts!)
🔫 ENTRY: Use the Thief's layered limit order strategy:
Layer 1: 148.500
Layer 2: 148.300
Layer 3: 148.000
Layer 4: 147.800
Layer 5: 147.700
You can increase or adjust these limit layers based on your own strategy and capital.
Risk Management
⛔ STOP LOSS: This thief's SL is 146.700. Dear Ladies & Gentleman (Thief OG's) 👑, adjust your SL based on your own strategy & risk. I am not responsible for your results.
🎯 TARGET: Escape with the stolen money at 151.000. This target aligns with a key resistance and "tarap zone." Consider taking partial profits on the way up.
⚖️ Note: This is your heist. You can take money at your own risk and discretion.
📌 MARKET SNAPSHOT & KEY DRIVERS
💸 Current Price: 148.1540 (Up 0.55%)
📊 Overall Market Outlook: Neutral with a Slight Bullish Bias 🐂
✨ Key Takeaway: USD/JPY is stable but range-bound. Watch for a break above 148.8–149.0 for a confirmed upside breakout, or a break below 146.65 for a failure.
Related Pairs & Assets to Watch
$EUR/PY - High correlation to USDJPY moves.
OANDA:GBPJPY - Another liquid Yen cross to gauge risk sentiment.
TVC:DXY - US Dollar Index strength directly impacts this pair.
TVC:US10Y - Watch US Treasury yields for USD momentum clues.
✨ “If you find value in my analysis, a 👍 and 🚀 boost is much appreciated — it helps me share more setups with the community!”
⚠️ DISCLAIMER
This idea is for educational and informational purposes only. It does not constitute financial advice. You are solely responsible for your own trading decisions and capital. Trading forex carries a high level of risk and may not be suitable for all investors.
#Forex #USDJPY #TradingPlan #TechnicalAnalysis #BankHeist #SwingTrading #DayTrading #ForexSignals #TradingView

USDJPY continue to fall!With recent BOJ Monetary Polciy states and, with further assurance with Ueda's speech JPY interest rates could continue to remain significantly lower which keeping jpy again a choice of safe heaven as usual. Current rate cut on USD has lowered the USDJPY down that past week was a big drop below daily head & shoulder. As with the current pullback price is approaching monthly high which is also aligning with the 4h key level of resistance and a high liquidity zone.
There is a high chance for the price to continue to drop to key level of resistance and, a possible sell zone with higher probability to drop to longer term support level.

"The USDJPY Ninja Trade – Silent Entry, Big Exit!"🚨💰 USD/JPY “The Ninja” Forex Bank Heist Plan (Swing Trade) 🐱👤💴💵
🎭 Dear Money Makers, Robbers & Thief OG’s,
It’s time to gear up for our biggest Ninja heist on the Forex streets!
We’re breaking into the USD/JPY vault with a Bullish Master Plan – grab your mask, load your limit orders, and let’s rob the market clean! 💰🔫
🗡️ Heist Entry (Layering Style) 📈
Thief doesn’t enter with one bullet – we spray the vault with multiple limit orders! 🎯
First layer: 147.600
Second layer: 147.400
Third layer: 147.200
👉 Add more layers if you want a deeper pullback entry – the more locks you pick, the bigger the loot! 🏦💎
🛑 Thief Stop Loss
This is Thief SL 🔒: 146.500
But remember, dear ladies & gentlemen (Thief OG’s) – adjust your SL based on your own strategy, capital & risk appetite. Stay slick, don’t get caught! 🚔💨
🎯 Target Escape Zone
Police barricade spotted 🚨👮 @ 150.700
Our heist exit point is locked at 150.000 🏃♂️💨
👉 Make sure you grab the loot & escape before the cops arrive. Take profit & celebrate with stolen sushi 🍣 & sake 🍶!
⚠️ Thief Trading Notes
News drops = extra police patrols 🚔 – avoid opening fresh entries during major releases.
Trail your stops to lock in profits – no thief leaves empty-handed!
Stay alert to price traps – don’t get stuck behind enemy lines.
💎 If this heist plan made you some loot, smash that 💖 & BOOST button to power up the Thief Gang 🚀🤝💰
The more boosts, the bigger our robbery squad becomes!
Stay tuned, Ninjas 🐱👤 … the next heist plan is already loading.
💵💎🚀 Thief Trader OUT.
USDJPY Tight Range, Bearish Pressure Building Below TrendlineUSDJPY continues to trade inside a broad descending channel, with sellers stepping in near the 148.20–148.50 region once again. Despite short-term rebounds, the pair struggles to maintain momentum above resistance, signaling that bearish pressure remains intact. A break below near-term supports could open the way for a deeper move toward 145.50.
Current Bias
Bearish – short-term rejection at trendline resistance points to downside continuation unless bulls reclaim 148.50.
Key Fundamental Drivers
Federal Reserve: Softer U.S. data and cooling inflation have increased expectations for rate cuts later this year, weighing on USD strength.
Bank of Japan: Still holding an ultra-loose stance, but higher JGB yields and speculation about eventual policy tweaks are helping limit yen weakness.
Risk Sentiment: Equity pullbacks or tariff-related shocks can drive safe-haven demand for JPY, putting additional pressure on USDJPY.
Macro Context
Interest Rates: U.S. yields are softer as markets price in Fed easing; Japanese yields are edging higher, narrowing the yield gap.
Growth Trends: U.S. growth momentum is slowing, while Japan’s economy remains fragile but stable.
Geopolitics: Trade tensions and tariff headlines add uncertainty and may amplify yen demand in risk-off phases.
Primary Risk to the Trend
A sudden rebound in U.S. yields or stronger U.S. inflation prints could lift the dollar back above 148.50, invalidating the bearish setup.
Most Critical Upcoming News/Event
U.S. PCE inflation data
FOMC speeches regarding rate-cut timing
Japanese CPI release
Leader/Lagger Dynamics
USDJPY is often a leader within yen pairs, driving sentiment across JPY crosses. Movements here influence EURJPY, GBPJPY, and CADJPY.
Key Levels
Support Levels: 147.05, 145.52
Resistance Levels: 148.20, 149.25
Stop Loss (SL): 149.25 (above key resistance)
Take Profit (TP): 147.05 (first target), 145.52 (secondary target)
Summary: Bias and Watchpoints
USDJPY remains capped under trendline resistance, keeping the bias bearish as long as 148.50–149.25 holds. Stops above 149.25 protect against a breakout, while downside targets rest at 147.05 and then 145.52. The main watchpoint is U.S. inflation data and Fed commentary—if they confirm easing, sellers could gain control and extend the decline. Conversely, a surprise hawkish shift could trigger a squeeze higher.

The Trapdoor Series | USDJPY and the Illusion of StabilityHello traders,
"Markets often build structures that look strong from the outside, but inside they hide a trapdoor waiting to open. On this chart, USDJPY is trading within a rising channel, showing strength at first glance. Yet, multiple CHoCH (Change of Character) points reveal that momentum is fragile every rise carries a hidden weakness.
📌 What stands out here:
Middle Zone has acted as a deceptive balance point, pulling price back again and again, but never giving clear continuation.
Liquidity Pool below, where sell-side orders remain untouched, acts as the hidden floor that price could test at any time.
Gap Fill reaction shows how quickly the market closes imbalances before deciding on its next move.
BSL vs SSL battle highlights how traders are tricked between the highs and lows of the channel, unsure which side will truly break.
This structure is like walking on a floor that looks solid but has a trapdoor hidden beneath. Each candle is a step some are firm, some are fragile and traders who rush forward risk falling through the false ground.
💡 Lesson: A trapdoor only opens when enough weight is placed on it. Similarly, in markets, the real move only happens after enough liquidity has been built to justify a breakout. Until then, what looks like stability can simply be a false stage covering the real path.
👉 The question is: will USDJPY’s next move reveal the hidden trapdoor below 🔻, or will it defy expectations and climb higher 🔺 before the floor gives way? Share your perspective — every view adds another piece to the puzzle."

USDJPY Daily Forecast -Q3 | W36 | D4 | Y25📅 Q3 | W36 | D4 | Y25
📊 USDJPY Daily Forecast
🔍 Analysis Approach:
I’m applying Smart Money Concepts, focusing on:
Identifying Points of Interest on the Higher Time Frames (HTFs) 🕰️
Using those POIs to define a clear trading range 📐
Refining those zones on Lower Time Frames (LTFs) 🔎
Waiting for a Break of Structure (BoS) for confirmation ✅
This method allows me to stay precise, disciplined, and aligned with the market narrative, rather than chasing price.
💡 My Motto:
"Capital management, discipline, and consistency in your trading edge."
A positive risk-to-reward ratio, paired with a high win rate, is the backbone of any solid trading plan 📈🔐
⚠️ Losses?
They’re part of the mathematical game of trading 🎲
They don’t define you — they’re necessary, they happen, and we move forward 📊➡️
🙏 I appreciate you taking the time to review my Daily Forecast.
Stay sharp, stay consistent, and protect your capital
— FRNGT 🚀
FX:USDJPY

USDJPY Long Bias Forecast Q3 W35 D28 Y25 – NY Session 🗓️ USDJPY Long Bias Forecast
Q3 W35 D28 Y25 – NY Session
Top-Down Technical Outlook
🔹 Weekly Timeframe
Price Action: Strong rejection from the Weekly 50 EMA, acting as dynamic support.
Note: With two trading days left in the week, the previous weekly wick remains a key area — it may still fill, suggesting further upside potential.
Implication: Structure suggests continuation to the upside, but current price must confirm with internal shifts before entry.
🔹 Daily Timeframe
Current Price: Hovering around the Daily 50 EMA – a key equilibrium level.
Expectation: Potential bullish reaction if buyers defend this zone.
Risk Consideration: Aggressive long entries must be approached cautiously without a confirmed change in internal structure (CHOIS).
🔹 4H Timeframe
Confluence:
Bullish wick closure on the last candle suggests rejection from lower prices.
Order Block (OB) identified near Daily 50 EMA – an ideal POI.
Narrative: Structure is preparing for a potential shift. Look for breaks of internal structure (BOS) to confirm bullish intent.
🔹 1H Timeframe
Candlestick Confirmation: Last 3 consecutive bullish candles forming a classic bullish continuation pattern.
Order Block in alignment with 4H and Daily 50 EMA adds weight to the area.
Bias: Bullish – pending confirmation via BOS and clean pullbacks.
🔹 5-Minute Timeframe
Microstructure:
Refined entry points within OB zone.
Ideal for tight stop entries post BOS and retest of lower-timeframe OB.
Watch For:
Shift from bearish to bullish market structure.
Entry following a break + retest of a demand zone or OB.
✅ Confluences for Longs
Rejection from Weekly 50 EMA.
Price respecting Daily 50 EMA.
4H OB + Bullish candle closure.
1H Bullish formation + OB.
5M potential BOS/CHOIS for refined entry.
⚠️ Cautions / Trade Management
Wait for internal structure shift on lower timeframes before full commitment.
Liquidity sweeps below current price are still possible before upside continuation.
Maintain awareness of macroeconomic catalysts (e.g., U.S. or Japan economic data or central bank commentary).
FRGNT
FX:USDJPY

USDJPY – DAILY FORECAST Q3 | W35 | D28 | Y25📊 USDJPY – DAILY FORECAST
Q3 | W35 | D28 | Y25
🔍 Daily Forecast | USDJPY
Here’s a concise breakdown of the current chart setup 🧠📈:
📌 Higher time frame order blocks have been identified — these are our patient points of interest 🎯🧭.
We wait for a confirmed break of structure 🧱✅ before executing any position.
This keeps us disciplined, and in sync with what the price action is actually telling us — not what we want it to say.
📈 Risk Management Protocols
🔑 Core Principles:
Max 1% risk per trade
Execute only at pre-identified levels
Use alerts, not emotion
Stick to your RR plan (minimum 1:2)
🧠 You’re not paid for how many trades you take — you're paid for how well you manage risk.
"Trade what the market gives, not what your ego wants."
Stay mechanical. Stay focused. Let the probabilities work for you. 🎯📊
FRGNT
FX:USDJPY

149.50 Target Set — Aggressive Bulls OnlyTechnical analysis — USD/JPY (1-hour chart you shared)
The dominant feature on the chart is a deep bearish liquidity sweep (a single long vertical down candle) that reached roughly the 146.0–146.2 area before buyers sharply pushed price back up. That sweep looks like a stop-hunt followed by an immediate mean reversion: price recovered into a short-term retracement and is currently testing the resistance cluster around 148.115. The overall short-term structure now reads as a bounce off a flash low, producing a higher low, but bulls still need a reclaim of the recent swing highs to claim control.
Key visible levels (in plain language): the immediate resistance band to watch is the 148.115 → 148.520 → 148.778 zone (these are stacked red dotted levels on your chart). On the downside, the near pivot/support is ~147.166, with a tighter support cluster around 146.872 → 146.690 → 146.572 and the liquidity floor near 146.214–146.0 (the sweep low). If price holds above the 146.8–147.2 cluster, the odds favor another attempt at the 148.1–148.5 area; if it falls back through the 146.2 floor, sellers will likely regain initiative.
Structurally, this looks like a short-term mean-reversion opportunity rather than a clear trend continuation. The big wick down removed a lot of buy-side liquidity; the subsequent recovery suggests short-term buyers are present. However, volatility remains elevated — I see event icons under the timeline, so economic releases could create wide intraday swings. That argues either for waiting for confirmation (clean hourly closes) or using smaller position sizes if you enter immediately.
A quick numeric appraisal of the long trade box visible on the chart: entry ~147.166, stop ~146.872, target ~148.115. The risk per unit is 147.166 − 146.872 = 0.294 (about 29.4 pips on a JPY pair); the reward to target is 148.115 − 147.166 = 0.949 (about 94.9 pips). Reward:Risk ≈ 0.949 ÷ 0.294 = 3.23 — a favorable ratio if the support holds and volatility doesn’t spike.
What to watch next (trade management and confirmations): if the pair posts a clean hourly close above 148.115, that will reduce false-break risk and increase the chance of hitting higher targets (148.52 / 148.78).
Conversely, failure to close above 148.115 and a reversal candlestick there would be a bearish sign and could lead price back toward 146.87 and the flash low. Keep an eye on hourly momentum indicators (RSI/MACD) for divergence and on volume/tick activity during any breakout attempt. Because economic events are on the chart timeline, avoid entering with full size immediately before a known print — widen stops or wait until the event is clear.
Trade setups (explicit — bullets as requested)
• Aggressive dip-buy (the chart’s boxed trade)
o Entry: ~147.10–147.20 (around current pivot).
o Stop: ~146.80–146.70 (chart SL ≈ 146.872).
o Take-profit 1: 148.115 (partial exit). Take-profit 2: 148.520 (scale out).
o R:R (to TP1): ~3.23 (94.9 pips reward / 29.4 pips risk).
o Notes: use reduced size if trading through event windows; a tight stop risks being clipped by noise.
• Conservative breakout long
o Entry: wait for an hourly close above 148.115.
o Stop: below the breakout candle low or below 147.166 pivot (give ~20–30 pips buffer depending on spread).
o Targets: 148.520, then 148.778 for larger bias confirmation.
o Notes: lowers false breakout risk; trade momentum, not wishful bias.
• Rejection short
o Entry: bearish price action / clear rejection at 148.115 (failed break or reversal candle).
o Stop: above recent wick high (above 148.520).
o Targets: first 146.872, then 146.214–146.0 if weakness continues.
o Notes: short becomes higher-probability if momentum indicators turn down at resistance.
Final recommendations: if you favor a cleaner edge, wait for a confirmed hourly close above 148.115 before chasing longs. If you prefer higher reward and accept higher risk, the boxed long is reasonable given the R:R, but size it conservatively and respect the 146.8 invalidation. Tell me if you want position-size calculations for a specific account balance and risk percent, or an annotated re-export of this chart with levels labeled for your TradingView.

USDJPY: Multi-Timeframe Liquidity Hunt Setup - Monthly OutlookSharing my longer-term perspective on USDJPY with a two-phase liquidity scenario. 📊
**🎯 The Big Picture:**
I'm expecting a classic two-phase move: first a liquidity hunt down to the lower purple line (white-boxed zone), followed by a strong rally up to the upper purple line. This would represent my ideal scenario for the coming months. 📈
**📍 Liquidity Zones Explained:**
The purple lines (highlighted in white boxes) represent key liquidity zones where stops are likely parked. Markets love to sweep these levels before making their real moves - it's textbook institutional behavior. 💰
**⏰ Timing Expectations:**
I expect the downside liquidity hunt to occur within the remaining days of this month or early next month. These moves often happen faster than people anticipate. ⚡
**🛡️ Invalidation Level:**
The yellow line marks the low of a strong weekly bullish candle - a significant structural point. If price breaks below this level, it would invalidate this bullish scenario entirely. 🚨
**🧠 Why This Setup Makes Sense:**
This type of liquidity grab followed by reversal is classic market mechanics. The lower liquidity zone represents trapped shorts and protective stops - perfect fuel for the eventual rally to the upper target. 🔄
**⚠️ Risk Management:**
Clear invalidation point below the yellow line, targeting the upper liquidity zone for a clean setup with defined parameters. 🎯
📈 **This trade setup offers a risk-to-reward ratio of 5:1.** Without including fees, the breakeven win rate for this trade would be approximately 16.67%. Knowing these figures in advance helps me avoid emotional trading. 🧠
💡 **Pro Tip**: If you often find yourself trading based on emotions, I recommend doing this type of pre-planning and quantifying your setups before execution — it can be a simple yet highly effective improvement. ✅
---
**Trading is simple.** You don't need multiple indicators or dozens of lines on your chart. A clean and simple chart often works best — it keeps your decisions consistent and reduces uncertainty. Sure, it might not look flashy, and my analysis may seem a bit "plain" compared to others… but that's how I like it. If you find this analysis useful, feel free to follow me for more updates.
---
*Disclaimer: This post is for general informational and educational purposes only. It does not constitute financial advice, investment recommendation, or a service targeting specific investors, and should not be considered illegal or restricted information in any jurisdiction.*

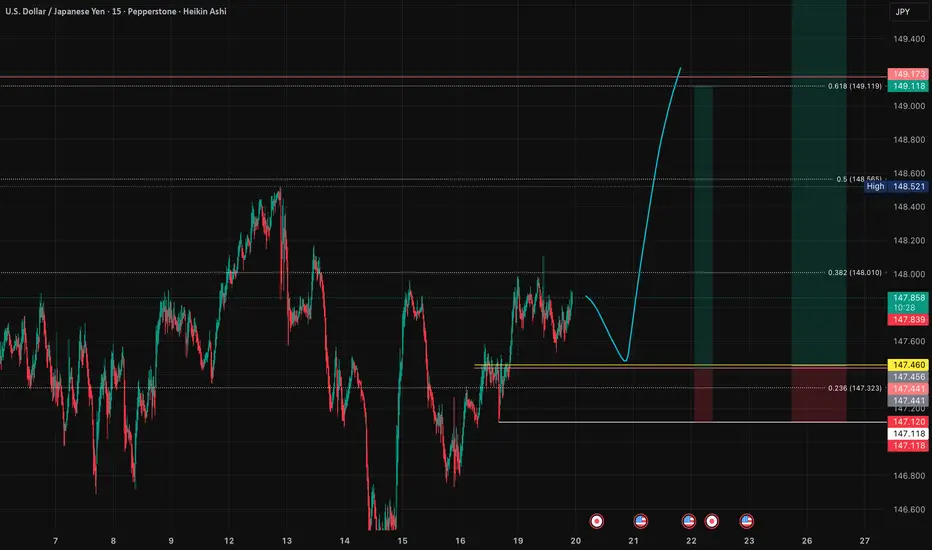
USDJPY: Simple Role Reversal Play - Fibonacci RetracementSharing my straightforward read on USDJPY for the immediate term. 🎯
**📍 The Setup:**
I'm expecting a role reversal move back toward the recent range highs. After that initial bounce, I'm looking for a stronger upward move targeting approximately the 0.618 Fibonacci retracement level of the larger range structure. 📊
**⏰ Timing Expectations:**
If this scenario plays out, it should happen within the next day or two. Currency moves often have tight timing windows, and this setup has that "ready to go" feel to it. ⚡
**🎯 Why This Makes Sense:**
Role reversals at key levels are bread-and-butter setups. Former resistance becomes support, and the market often tests these flipped levels before continuing the broader move. Simple market mechanics. 🔄
**🧠 Keep It Simple:**
Sometimes the best trades are the most obvious ones. No complex analysis needed here - just clean technical levels and patient execution. 📈
📈 **This trade setup offers a risk-to-reward ratio of 5:1.** Without including fees, the breakeven win rate for this trade would be approximately 16.67%. Knowing these figures in advance helps me avoid emotional trading. 🧠
💡 **Pro Tip**: If you often find yourself trading based on emotions, I recommend doing this type of pre-planning and quantifying your setups before execution — it can be a simple yet highly effective improvement. ✅
---
**Trading is simple.** You don't need multiple indicators or dozens of lines on your chart. A clean and simple chart often works best — it keeps your decisions consistent and reduces uncertainty. Sure, it might not look flashy, and my analysis may seem a bit "plain" compared to others… but that's how I like it. If you find this analysis useful, feel free to follow me for more updates.
---
*Disclaimer: This post is for general informational and educational purposes only. It does not constitute financial advice, investment recommendation, or a service targeting specific investors, and should not be considered illegal or restricted information in any jurisdiction.*
USDJPY : LONG OPPORTUNITY, MOMENTUM BREWING NICELY FOR UPSIDERefer to trendline drawn on chart. USDJPY is heading to retest 151.
Long @ 147.60
TP 150.80
SL 146.05

Big Bounce from 146.20! Is USDJPY Heading for 149.00?The USDJPY 4H chart is showing signs of recovery after a period of volatility. Price recently bounced from the 146.20–146.70 support zone 🛡️, which has acted as a strong demand area multiple times in the past week. Buyers have stepped in strongly from that level, and the pair is now trading around 147.60–147.85, pushing upward with a constructive bullish structure.
Looking at the broader picture, USDJPY had been under pressure earlier, printing lower highs and testing deeper supports. However, the rejection near 146.20 marks a potential swing low formation 🔄, as price immediately rallied higher with strong bullish candles. Importantly, the market has shifted above the mid-level 147.20–147.40 area, turning it into a short-term base for buyers.
On the upside, the immediate resistance 🚧 lies at 147.85–148.00, which is already being tested. A breakout above this zone would expose the higher resistance at 148.52, a key level where sellers previously rejected price. If bulls clear 148.52 decisively, the next possible leg could target the 149.00 handle, a psychological level and prior supply zone.
The trade setup 🎯 as shown on the chart is structured with bullish bias:
• Entry: Around 147.60–147.85 (already activated)
• Stop Loss (SL): Near 147.18 (just below recent consolidation base 🛡️)
• Target (TP): First target near 148.00–148.10, extended target at 148.52 🚀
This gives a risk-to-reward ratio better than 2:1 ✅, which is favorable for continuation trades.
The structure also shows multiple “Buy (B)” markers clustering at the bottom around 146.20–146.70, confirming that dip-buying interest is strong. On the other hand, the “Sell (S)” markers above 148.50 highlight the importance of this resistance zone. Bulls need strong momentum to flip this level; otherwise, price may stall temporarily.
In terms of strategy, the bullish trade remains valid as long as USDJPY holds above 147.20. Traders can consider booking partial profits 💰 near 148.00 and leaving the rest toward 148.50. Once price moves in profit, it’s wise to trail the stop-loss 🔒 to breakeven or slightly in the green to protect against sudden pullbacks.
✅ Conclusion:
USDJPY is looking bullish in the short term 📈 after bouncing from 146.20–146.70 support. A move toward 148.00–148.50 is favored, with potential extension toward 149.00 if momentum stays strong. However, active risk management is key—secure small profits at intermediate levels and trail stops as the trend progresses.

USD/JPY 1D Forex Chart - August 12, 2025daily performance of the U.S. Dollar (USD) against the Japanese Yen (JPY) as of August 12, 2025. The current exchange rate is 148.277, reflecting a 0.09% increase (+0.136). The chart includes a trendline indicating a potential upward movement, with a buy signal at 148.277 and a sell signal at the same level. Key support and resistance levels are marked, with a notable range between 146.786 and 151.234. The chart spans from early 2025 to mid-2026, showing historical price action and future projections.

USD/JPY Poised for Breakout as Fundamentals & Technicals AlignUSDJPY is entering a critical juncture where both macroeconomic conditions and price structure are pointing toward a potential bullish continuation. The pair has been consolidating just under a descending trendline after a sharp drop from July’s highs, but strong US fundamentals, a persistently dovish Bank of Japan, and upcoming political catalysts are creating the perfect environment for an upside breakout. If buyers can reclaim momentum above near-term resistance, the path toward retesting multi-month highs appears open, with yen crosses likely to follow the lead.
Technical Analysis (4H Chart)
Price is consolidating around 147.46 after falling from the 150.91 high.
A descending trendline from the late-July peak is being tested. A confirmed breakout would likely accelerate bullish momentum.
Key upside targets:
148.96 – immediate resistance & short-term target (previous swing high).
150.91 – major resistance at July’s high.
Stop-loss at 146.43 safeguards against deeper retracements.
The structure reflects a series of bullish continuation patterns (flags, breakouts, retracements).
Fundamental Analysis
Current Bias: Bullish
USD Strength: Strong US data and anticipation of Trump’s “major” economic announcement are lifting the dollar.
JPY Weakness: Despite better-than-expected Japan Eco Watchers Survey, the BoJ’s ultra-loose stance continues to suppress yen demand.
Rate Differentials: Still heavily in USD’s favor, sustaining upward pressure on USD/JPY.
Risk Sentiment: Even with mild geopolitical tensions, USD’s safe-haven appeal is preventing JPY from benefiting.
Risks:
Disappointing US political announcements.
Hawkish surprises from the BoJ.
Sharp swings in risk sentiment favoring the yen.
Key News/Events Ahead:
Trump’s economic policy reveal.
US CPI & PPI releases.
BoJ policy signals or commentary.
Leader/Lagger Dynamics:
USDJPY is the leader for yen crosses, often setting the tone for GBPJPY, AUDJPY, and CHFJPY.
Summary:
USDJPY’s bullish outlook is reinforced by the combination of favorable fundamentals and a technical setup pointing toward a breakout. A move above 147.80–148.00 could open the door to 148.96 in the short term and 150.91 in the medium term. With yen crosses closely tied to USDJPY’s movements, this pair’s breakout could spark broader JPY weakness across the board, making it a pivotal chart to watch in the days ahead.

USD/JPY Robbery Route | Enter at Dip, Exit Before Police💥USD/JPY Forex Money Heist Plan 🎯 — Ninja Robbery at 146.000💥
🌟 Hi! Hola! Ola! Bonjour! Hallo! Marhaba! 🌟
Dear Market Bandits, Money Makers & Risky Robbers 🤑💰💸✈️
Welcome to another Thief Trader-style operation. We've cracked open the USD/JPY vault (aka "The Gopher" 💹), and here's the blueprint to pull off this forex heist like true professionals. 💼🎭💵
🚨 Strategy Overview
This isn't just a trade – it’s a well-researched, precision-timed robbery mission based on technicals, macro analysis, sentiment, and the bigger global picture.
Expect action near critical zones – especially the moving average barricade, where police (aka risk) is waiting. Stay sharp.
🔓 Entry Point – Unlock the Vault
📈 Watch for bullish pullbacks near 146.000.
Whether it's a dip, zone test, or wick bounce — you’re looking to layer buy limit orders like a seasoned thief using DCA tactics.
Enter on swings or any bullish confirmation.
Heist Window is Open.
🛑 Stop Loss – Escape Route
📍 SL near 143.000 (1D swing low) — adjust based on your capital and position size.
💡 Don’t go blind — SL is your backup plan, not an optional accessory.
Custom-fit it based on how many entries you’re stacking.
🎯 Target – Vault Exit Point
🏁 151.000 or exit before resistance heat catches on.
No greedy thieves here — precision exit is key.
Lock profits, vanish in style. 🕶️💼💸
🧲 Scalpers Take Note
Only long side raids are valid. Scalping against the trend? That's walking into a trap.
Use trailing SLs and protect your loot.
Small bag or big vault — play your game smart. 🎯💰
📢 Fundamental Boosters
USD/JPY’s bullish run isn’t random — it’s backed by:
📊 Macro shifts,
📈 COT reports,
🧠 Sentiment drivers,
📉 Intermarket trends,
And a whole mix of thief-level intel 🔍
🧭 Dive deeper before acting. The map’s been provided. 🔗🌍
🗞 News Traps Ahead – Move Cautiously
🚫 Avoid new trades during major releases
🔁 Use trailing SLs on open positions
💡 Position management is a thief’s best defense. Risk management keeps you in the game. 🎯🧠
🔥💖 Support the Heist Crew
Smash that ❤️🔥 Boost Button to keep our robbery engine running.
Each boost = strength for our crew.
💬 Share the love, spread the intel, and trade like a rogue with brains. 🤝💵
👀 Stay tuned for more high-profile FX heists from Thief Trader.
Until next time — loot wisely, vanish clean. 🐱👤💨
