USD/JPY BEARISH CHANNEL TOWARDS KEY 150.00 SUPPORT ZONE🔍 Chart Overview:
The USD/JPY pair is currently trading within a clear descending channel, indicating sustained bearish momentum. The price action has formed consistent lower highs and lower lows, respecting both the upper resistance and lower support boundaries of the channel.
📊 Key Technical Observations:
Range Formation:
Initially, the pair moved sideways in a consolidation range before breaking structure to the downside — marking the transition from accumulation to distribution.
CHoCH (Change of Character):
The CHoCH confirms a shift in market sentiment from bullish to bearish, validating the start of the current downtrend.
Resistance Rejection:
Price recently rejected from the channel resistance area around 152.10 – 152.50, showing seller dominance and continuation of bearish control.
Current Price Action:
The pair is now approaching the lower boundary of the bearish channel near 150.00, a strong psychological and technical support zone.
📉 Projection:
The forecast on the chart suggests a potential minor pullback toward 150.70 – 151.00 before resuming its downward move toward 150.00 support.
A clean break below 150.00 could extend the decline toward 149.50 or even lower.
However, if 150.00 holds, we could see a short-term bullish correction back to mid-channel levels.
⚙️ Trading Outlook:
Bias: Bearish continuation within channel
Resistance Zone: 151.10 – 151.50
Support Zone: 150.00 (key psychological level)
Next Targets:
✅ First target: 150.00
⚠️ Second target (if breakdown): 149.50
Usdjpyprediction

USDJPY TESTING SUPPORT POSSIBLE REBOUND BEFORE BEARISH BREAKDOWNOverall Market Context
The pair USD/JPY is currently trading around 152.25, showing some consolidation after a previous bullish move.
The chart is labeled with key areas such as Support Zones, an Upward Channel, and a Range period, indicating a mixed structure between bullish and corrective phases.
📈 Technical Analysis
1. Trend Structure
The chart shows a clear upward channel, suggesting a longer-term bullish trend.
However, price is currently testing the lower boundary of that channel, which often acts as a critical support line.
If this lower trendline fails, it could trigger a correction or reversal.
2. Key Levels
Immediate Resistance: Around 152.80 – 153.00
This aligns with the previous highs and upper channel limit.
Immediate Support: Around 152.20 → 151.59
Price is hovering near this region now — a break below 151.59 may signal weakness.

USD/JPY Swing Setup ⁝ Why Thief Layer Strategy Wins Here📊 Asset: USD/JPY — "The Ninja" Forex Bank Heist Plan (Swing/Day Trade)
🎯 USD/JPY Quick Snapshot
🔸 Daily Change: +0.39% (↑)
🔸 52-Week Range: 139.57 - 158.89
📊 Retail & Institutional Sentiment
🔹 Retail Traders: Bearish (60%) – Caution due to political uncertainty in Japan.
🔹 Institutional Traders: Bullish (70%) – Expect USD strength amid BOJ-Fed policy divergence.
🔹 Fear & Greed Index: 62/100 (Greed) – Moderate risk appetite favoring USD.
🔍 Fundamental & Macro Score
🏦 BOJ Policy Outlook:
• Rate hike uncertainty keeps JPY weak.
• Score: 3/10 (Bearish for JPY) 🐻
💵 Fed Policy Outlook:
• 90% chance of 25bps rate cut in September.
• Score: 7/10 (Bullish for USD) 🐂
🇯🇵 Political Risk (Japan):
• Leadership uncertainty weighs on JPY.
• Score: 4/10 (Negative for JPY) ⚠️
🌐 Trade War Risks:
• US tariff tensions may dampen USD strength.
• Score: 5/10 (Neutral)
🎯 Overall Market Outlook
🟢 Bullish (Long) Score: 65% ✅
🔴 Bearish (Short) Score: 35% ❌
📌 Summary: USD/JPY leans bullish due to BOJ hesitation, Fed cuts, and JPY political risks.
❓ WHY THIS Setup?
🔸 USD/JPY is respecting bullish structure while retail is mostly short → contrarian signal 🚨.
🔸 Institutional flow shows confidence in USD strength vs JPY weakness 📈.
🔸 BOJ hesitation + political instability in Japan continues to suppress JPY demand 🐻.
🔸 Layered entry strategy reduces risk of bad timing + maximizes capture of bullish wave ⚡.
🔸 Key target zone 151.500–152.000 offers strong risk/reward for swing & day traders 🎯.
✅ Thief Trading Plan: Bullish Setup
🔸 Entry (Thief Style Layer Strategy 🪤):
• 147.500
• 148.000
• 148.500
• 149.000
(Increase/adjust layers as per your own strategy.)
🔸 Stop Loss (Thief SL 🔒):
• Base SL @146.000
• Adjust according to risk tolerance & personal strategy
🔸 Target 🎯:
• Trap/reversal zone near 152.000
• Safer exit before reversal @ 151.500
⚡ Strategy Breakdown
🔹 Method: Thief OG Layer Strategy = scaling with multiple limit orders instead of single-entry.
🔹 Benefit: Absorbs noise, builds positions step-by-step, reduces FOMO.
🔹 Bias: Swing/Day trade friendly with bullish momentum in higher zones.
👀 Related Pairs to Watch:
💷 OANDA:GBPJPY
💶 OANDA:EURJPY
🇨🇭 OANDA:CHFJPY
💵 OANDA:USDCHF
✨ “If you find value in my analysis, a 👍 and 🚀 boost is much appreciated — it helps me share more setups with the community!”
#USDJPY #Forex #SwingTrading #DayTrading #JPY #ForexStrategy #TradingPlan #FXThief #LayerStrategy #SmartMoney

USDJPY - Expecting Bullish Continuation In The Short TermH1 - Strong bullish momentum.
No opposite signs.
Until the two Fibonacci support zones hold I expect the price to move higher further.
If you enjoy this idea, don’t forget to LIKE 👍, FOLLOW ✅, SHARE 🙌, and COMMENT ✍! Drop your thoughts and charts below to keep the discussion going. Your support helps keep this content free and reach more people! 🚀
--------------------------------------------------------------------------------------------------------------------

USD/JPY Bullish Reversal Setup – Long Entry at Support Zone1. Price Structure
Price has been in a downtrend channel (highlighted in pink).
It has reached the lower boundary of the channel and seems to be consolidating.
This suggests a possible reversal or breakout to the upside.
2. Entry Point
Marked near 148.419 – 148.439.
This is right at the bottom of the consolidation zone, just above the support area.
3. Stop Loss
Placed around 148.085 – 148.099 (yellow box).
Smartly set below the most recent low to protect against further downside if price breaks support.
4. Target
Target point is at 150.249.
This is a big upside move (around 180 pips from entry).
Good risk-to-reward ratio (approx. 1:4), meaning potential profit is much higher than potential loss.
5. Market Context
The chart suggests that once price breaks above the small downtrend (dashed blue line), it could push strongly upward.
This looks like a bullish flag pattern, which is generally a continuation pattern in an uptrend.
---
📊 Conclusion
Bias: Bullish (buy setup)
Reason: Price is at channel support + entry is near demand zone + bullish breakout potential.
Plan: Buy near 148.42 with stop loss at 148.09 and target 150.25.
Risk/Reward: Favorable (good setup if price respects support and breaks upward).
⚠ Key Risk: If price closes below 148.09 support, this setup becomes invalid and could drop further.

USD/JPY 1-Hour Candlestick Chart
Entry Point: ≈149.394
This is set just below the current price and near the lower boundary of the recent consolidation/support zone. The anticipation is that the price will dip slightly to this level before reversing up.
Stop Loss (SL): ≈149.068
The stop loss is placed below a recent swing low or potential support level. This represents the point where the bullish thesis is invalidated.
Risk: The risk on this trade is the distance between the entry point and the stop loss: 149.394−149.068=0.326 pips.
Target Point (Take Profit - TP): ≈150.917
This is a significant distance above the current price and the recent highs. It is likely targeting a prior high or a psychological level like 151.000 (though the target is slightly below it).
Reward: The potential reward is the distance between the target point and the entry point: 150.917−149.394=1.523 pips.
Risk/Reward Ratio (RRR):
The RRR is calculated as Reward / Risk:
RRR=
0.326
1.523
≈4.67
A Risk/Reward Ratio of ≈4.67:1 is excellent. This means that for every 1 unit of risk, you are aiming for over 4.5 units of profit. A high RRR is a key characteristic of a favorable trade setup.
Potential Scenarios & Considerations:
Bullish Confirmation (Trade Works): The price follows the projected path (the small red line with an arrow), touches the entry point, finds strong support there, and reverses sharply upward to eventually hit the 150.917 target.
Trade Fails:
The price breaks convincingly below the stop loss at 149.068. This would indicate a failure of the support level and a likely continuation of the downtrend/retracement, invalidating the buy setup.
The price moves up and reaches the target without dipping to the entry point (missing the entry).
Trader Action Summary
The setup suggests a Limit Buy order to be placed at 149.394, anticipating a final dip before the rally.
Action: Limit Buy at 149.394
Contingency: A break below 149.068 indicates a stronger selling momentum, and the trade should be exited (Stop Loss triggered).
Goal: Targeting a significant extension of the recent upward trend

USD/JPY Bullish Continuation Setup – Buy from Support (148.000) Price Structure & Trend
Overall Trend: The market has been moving upward since around the 18th, forming higher highs and higher lows inside an ascending channel (shown in red).
Current Position: Price is near the top of the channel, slightly pulling back.
2. Key Levels
Entry Zone: Around 148.000 (highlighted by the gray box).
Stop Loss: Around 147.378 (below the channel and key support).
Take Profit (Target Point): 150.513 (near the next major resistance zone)
3. Trade Idea
This chart seems to suggest a buy (long) setup:
Plan: Wait for price to retest the gray zone (support zone near 148.000).
If price respects this support, go long toward the target zone 150.5.
Risk/Reward Ratio: Very favorable (risk is small compared to potential upside).
4. Confirmation Factors
Ascending Channel: Price is respecting the channel, which is a bullish sign.
Support Zone: 148.000 area has been tested multiple times — likely to act as a strong support.
Momentum: As long as price stays above 147.378, buyers are in control.
5. Bearish Scenario
If price breaks below 147.378, this setup becomes invalid.
It may indicate a channel breakdown and potential trend reversal toward 146.5–146.0.
✅ Summary:
This chart shows a bullish continuation setup on USD/JPY. The trader is likely waiting for a pullback to 148.000 before buying, with a stop below 147.378 and a target near 150.5.

USD/JPY Short Setup – Resistance Rejection Opportunity”USD/JPY (1-hour timeframe)
Chart Setup
Trend: The price has been moving in a downward channel (highlighted in red).
Current Position: Price has recently bounced up from the lower boundary of the channel and is approaching the resistance zone (purple box).
Resistance Zone: ~147.247 – 147.645
Planned Entry Point: 147.264
Stop Loss: 147.662 (above resistance)
Target Point: 145.482
Trading Idea
This is a short (sell) setup.
The idea is to wait for price to reach resistance (around 147.247–147.500) and then enter a short position.
Expectation: Price will get rejected from resistance and move back down toward the target (145.482).
Risk/Reward
Risk: ~40 pips (147.264 → 147.662)
Reward: ~178 pips (147.264 → 145.482)
Risk-to-Reward Ratio (RRR): ~1:4.4 → very favorable setup.
Key Notes
✅ Strong risk-to-reward setup.
✅ Trade follows the dominant downtrend (channel).
⚠️ If price breaks and closes above 147.662, setup is invalid (trend may shift bullish).
⚠️ Best to wait for bearish candlestick confirmation in resistance zone before entry.
🔎 In short: This chart suggests a sell trade setup at resistance with a clear stop loss and a large potential downside profit target.

The Trapdoor Series | USDJPY and the Illusion of StabilityHello traders,
"Markets often build structures that look strong from the outside, but inside they hide a trapdoor waiting to open. On this chart, USDJPY is trading within a rising channel, showing strength at first glance. Yet, multiple CHoCH (Change of Character) points reveal that momentum is fragile every rise carries a hidden weakness.
📌 What stands out here:
Middle Zone has acted as a deceptive balance point, pulling price back again and again, but never giving clear continuation.
Liquidity Pool below, where sell-side orders remain untouched, acts as the hidden floor that price could test at any time.
Gap Fill reaction shows how quickly the market closes imbalances before deciding on its next move.
BSL vs SSL battle highlights how traders are tricked between the highs and lows of the channel, unsure which side will truly break.
This structure is like walking on a floor that looks solid but has a trapdoor hidden beneath. Each candle is a step some are firm, some are fragile and traders who rush forward risk falling through the false ground.
💡 Lesson: A trapdoor only opens when enough weight is placed on it. Similarly, in markets, the real move only happens after enough liquidity has been built to justify a breakout. Until then, what looks like stability can simply be a false stage covering the real path.
👉 The question is: will USDJPY’s next move reveal the hidden trapdoor below 🔻, or will it defy expectations and climb higher 🔺 before the floor gives way? Share your perspective — every view adds another piece to the puzzle."

USD/JPY Robbery Route | Enter at Dip, Exit Before Police💥USD/JPY Forex Money Heist Plan 🎯 — Ninja Robbery at 146.000💥
🌟 Hi! Hola! Ola! Bonjour! Hallo! Marhaba! 🌟
Dear Market Bandits, Money Makers & Risky Robbers 🤑💰💸✈️
Welcome to another Thief Trader-style operation. We've cracked open the USD/JPY vault (aka "The Gopher" 💹), and here's the blueprint to pull off this forex heist like true professionals. 💼🎭💵
🚨 Strategy Overview
This isn't just a trade – it’s a well-researched, precision-timed robbery mission based on technicals, macro analysis, sentiment, and the bigger global picture.
Expect action near critical zones – especially the moving average barricade, where police (aka risk) is waiting. Stay sharp.
🔓 Entry Point – Unlock the Vault
📈 Watch for bullish pullbacks near 146.000.
Whether it's a dip, zone test, or wick bounce — you’re looking to layer buy limit orders like a seasoned thief using DCA tactics.
Enter on swings or any bullish confirmation.
Heist Window is Open.
🛑 Stop Loss – Escape Route
📍 SL near 143.000 (1D swing low) — adjust based on your capital and position size.
💡 Don’t go blind — SL is your backup plan, not an optional accessory.
Custom-fit it based on how many entries you’re stacking.
🎯 Target – Vault Exit Point
🏁 151.000 or exit before resistance heat catches on.
No greedy thieves here — precision exit is key.
Lock profits, vanish in style. 🕶️💼💸
🧲 Scalpers Take Note
Only long side raids are valid. Scalping against the trend? That's walking into a trap.
Use trailing SLs and protect your loot.
Small bag or big vault — play your game smart. 🎯💰
📢 Fundamental Boosters
USD/JPY’s bullish run isn’t random — it’s backed by:
📊 Macro shifts,
📈 COT reports,
🧠 Sentiment drivers,
📉 Intermarket trends,
And a whole mix of thief-level intel 🔍
🧭 Dive deeper before acting. The map’s been provided. 🔗🌍
🗞 News Traps Ahead – Move Cautiously
🚫 Avoid new trades during major releases
🔁 Use trailing SLs on open positions
💡 Position management is a thief’s best defense. Risk management keeps you in the game. 🎯🧠
🔥💖 Support the Heist Crew
Smash that ❤️🔥 Boost Button to keep our robbery engine running.
Each boost = strength for our crew.
💬 Share the love, spread the intel, and trade like a rogue with brains. 🤝💵
👀 Stay tuned for more high-profile FX heists from Thief Trader.
Until next time — loot wisely, vanish clean. 🐱👤💨

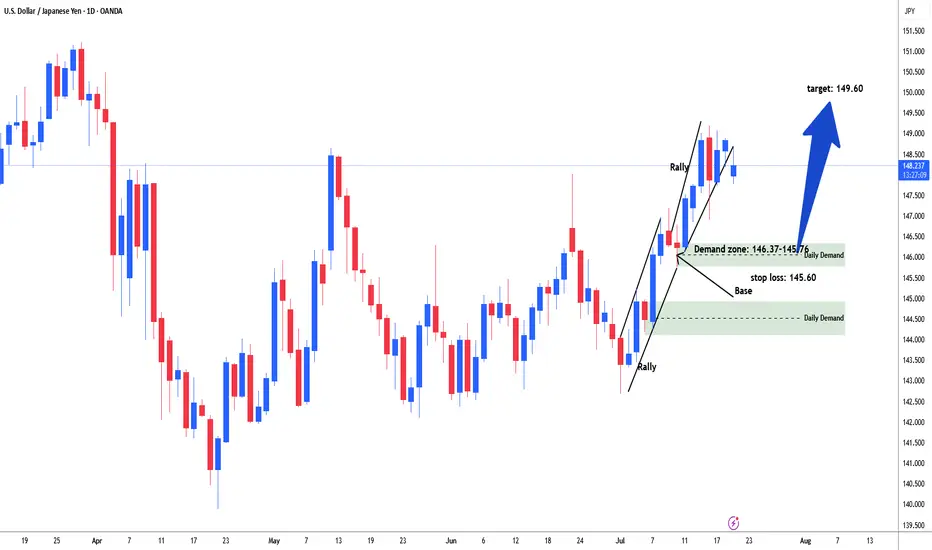
USDJPY Possible long for 149.60#usdjpy started rally from the start of the month of July. Price consolidate in range between 142.85-10. Then started rally. price again consolidate in range between 147.15-145.76 area. Market build energy and institutional add further longs and broke above the daily resistance line 148.60. Need to sell off / retracement to test demand zone range 146.37-145.78 area to test and filled remaining institutional orders for long. Buying area 146.37-145.76. stop loss: 145.60. Target: 149.60
USD/JPY "The Ninja Heist" – Bullish Loot Grab!🌟 Hey, Thieves & Market Bandits! 🌟
💰 Ready to raid the USD/JPY "The Gopher" vault? 💰
Based on 🔥Thief Trading Style🔥 (technical + fundamental heist analysis), here’s the master plan to swipe bullish profits before the market turns against us! Escape near the high-risk Yellow MA Zone—overbought, consolidation, and bear traps ahead! 💸 "Take the money and run—you’ve earned it!" 🏆🚀
🕵️♂️ Heist Strategy:
📈 Entry (Bullish Raid):
The vault’s unlocked! Buy any price—this heist is LIVE!
Pullback lovers: Set buy limits at recent/swing lows for extra loot.
🛑 Stop Loss (Escape Route):
Thief SL at recent/swing low (4H/Day trade basis).
Adjust based on your risk, lot size, and multiple orders.
🎯 Target (Profit Escape):
147.500 (or flee earlier if bears ambush!)
⚔️ Scalpers’ Quick Strike:
LONG ONLY! If rich, attack now. If not, join swing traders & rob slowly.
Trailing SL = Your bodyguard! 💰🔒
💥 Why This Heist?
USD/JPY "The Ninja" is bullish due to key factors—check:
📌 Fundamental + Macro + COT Report
📌 Quantitative + Sentiment + Intermarket Analysis
📌 Future Targets & Overall Score (Linkks In the profile!) 🔗🌍
🚨 Trading Alert (News = Danger!):
Avoid new trades during news—volatility kills!
Trailing SL saves profits on running positions.
💖 Support the Heist Team!
💥 Smash the Boost Button! 💥
Help us steal more money daily with Thief Trading Style! 🏆🚀
Stay tuned—another heist is coming soon! 🤑🎯

Unlocking the Bull Vault: USD/CAD Heist Setup🕵️♂️💼 The Loonie Vault Raid: USD/CAD Buy Blueprint 💰🔐
🌟Hi! Hola! Ola! Bonjour! Hallo! Marhaba!🌟
To All Currency Conquerors, Market Raiders & Profit Seekers 💸🚁🕶️
Welcome to another Thief Trading Style playbook, crafted for bold traders ready to infiltrate the Forex vaults with precision.
📜 Mission Brief – The Loonie USD/CAD Buy Op:
Using a blend of 🔥strategic market intel🔥 (technical + fundamental), we’re gearing up for a targeted buy operation. The goal? Extract max profits and vanish before the guards show up. 🏃♂️💨
🎯 ENTRY POINT – Authorized Access Only!
🎯 Buy Zone #1: Around 1.37000+
🎯 Buy Zone #2: Around 1.36400 (Caution: This is Market Maker Trap turf – approach wisely)
⏳ Wait for pullback signs & reversal confirmation before execution – The real pros enter when the crowd hesitates.
🛑 STOP LOSS – Backup Plan if Things Go South
🧠 Wise raiders always have an exit route!
🔹 SL Strategy 1: Nearest Swing Low on 2H timeframe (e.g., 1.36000)
🔹 SL Strategy 2: Institutional Buy Zone SL (1.34000 or deeper)
💡 Position sizing and risk tolerance are your call, but don’t skip this shield.
🏴☠️ TARGET – Where the Loot Lies
🎯 Aim for 1.39500 or exit early if the heat rises (volatility spike/consolidation stalls)
💼 Remember, the best thieves know when to grab the bag and bounce.
💹 Scalpers Advisory – Shortcuts to Riches
👀 Only ride the bullish tide.
💰 If you’ve got capital muscle, dive in. If not, roll with the swing crew.
📌 Trail that SL like a pro – don’t get caught slippin’.
📊 Why We Strike Now – The Big Picture
USD/CAD is showing bullish signs backed by:
✔️ Macro shifts
✔️ COT reports
✔️ Sentiment shift
✔️ Intermarket synergy
✔️ Smart money positioning
🔗 Full intel available – KlicK & explore!
⚠️ High Alert: News & Chaos Protocol
🚨 News drops = alarm bells.
To survive:
📌 Avoid fresh trades during major releases
📌 Use trailing SL to protect your gains
📌 Don’t overexpose – one vault at a time
💖 Support the Crew – Hit BOOST
Your boost helps fund the next mission. Show love, share strength, and become part of the Forex Heist Syndicate 🕵️♂️💵💼
One chart at a time, we rewrite the game.
🎯 Stay locked in – next mission drops soon... 🤑💻🚀

USD/JPY "The Ninja Heist" – Bullish Loot Grab!🌟 Hey, Thieves & Market Bandits! 🌟
💰 Ready to raid the USD/JPY "The Gopher" vault? 💰
Based on 🔥Thief Trading Style🔥 (technical + fundamental heist analysis), here’s the master plan to swipe bullish profits before the market turns against us! Escape near the high-risk Yellow MA Zone—overbought, consolidation, and bear traps ahead! 💸 "Take the money and run—you’ve earned it!" 🏆🚀
🕵️♂️ Heist Strategy:
📈 Entry (Bullish Raid):
The vault’s unlocked! Buy any price—this heist is LIVE!
Pullback lovers: Set buy limits at recent/swing lows for extra loot.
🛑 Stop Loss (Escape Route):
Thief SL at recent/swing low (4H/Day trade basis).
Adjust based on your risk, lot size, and multiple orders.
🎯 Target (Profit Escape):
148.700 (or flee earlier if bears ambush!)
⚔️ Scalpers’ Quick Strike:
LONG ONLY! If rich, attack now. If not, join swing traders & rob slowly.
Trailing SL = Your bodyguard! 💰🔒
💥 Why This Heist?
USD/JPY "The Ninja" is bullish due to key factors—check:
📌 Fundamental + Macro + COT Report
📌 Quantitative + Sentiment + Intermarket Analysis
📌 Future Targets & Overall Score (Linkks In the profile!) 🔗🌍
🚨 Trading Alert (News = Danger!):
Avoid new trades during news—volatility kills!
Trailing SL saves profits on running positions.
💖 Support the Heist Team!
💥 Smash the Boost Button! 💥
Help us steal more money daily with Thief Trading Style! 🏆🚀
Stay tuned—another heist is coming soon! 🤑🎯

Technical Analysis on JPY Price Action (as of June 9, 2025)📈 Technical Analysis on JPY Price Action (as of June 9, 2025)
---
🗂️ Overview:
This chart illustrates the price movement of the Japanese Yen (JPY) with clearly defined support and resistance zones. The setup suggests a bullish bias in the short term, with potential for a breakout toward previous highs.
---
🔍 Key Levels Identified:
🟥 Main Support Zone (141.80 – 142.80):
This is a strong demand zone.
Price bounced aggressively from this level in late May.
If broken, could trigger a major downside move 📉.
🟧 Support Zone (143.80 – 144.70):
Price is currently testing this zone.
Holding this area will be crucial for bullish continuation.
🟨 Resistance Zone (145.80 – 146.60):
This is the next target for bulls 🐂.
Historically acted as a supply zone, causing pullbacks.
🟫 ATH Resistance Zone (~147.80 – 148.50):
The All-Time High (ATH) resistance zone.
Strong rejection from here in the past; likely to act as a hard ceiling again 🚫.
---
🔄 Price Action Forecast:
🕊️ If the current support holds, expect a bullish move toward the 146.00–146.50 resistance.
📈 A breakout above this resistance could initiate a move to the ATH zone (147.80+).
🚨 A breakdown below 143.80 could lead to retesting the main support near 142.00.
---
📊 Technical Sentiment:
Bias: Bullish ✅
Trend: Recovering uptrend after forming a higher low.
Confirmation Needed: Break and retest of the 145.80–146.60 resistance for continuation.
---
✅ Trading Tip:
Wait for either:
🔁 A retest and bounce from 144.00 for long entries 🎯.
❌ A rejection at resistance for potential short opportunities if price fails to break 146.60.
---
📌 Conclusion:
The market shows bullish intent from support, but traders should watch the reaction near the resistance zone to confirm trend continuation. 📍Patience and confirmation are key.

USD/JPY "The Gopher" Forex Bank Bullish Heist Plan (Swing Trade)🌟Hi! Hola! Ola! Bonjour! Hallo! Marhaba!🌟
Dear Money Makers & Robbers, 🤑 💰💸✈️
Based on 🔥Thief Trading style technical and fundamental analysis🔥, here is our master plan to heist the USD/JPY "The Gopher" Forex Market. Please adhere to the strategy I've outlined in the chart, which emphasizes long entry. Our aim is to escape near the high-risk Yellow MA Zone. Risky level, overbought market, consolidation, trend reversal, trap at the level where traders and bearish robbers are stronger. 🏆💸"Take profit and treat yourself, traders. You deserve it!💪🏆🎉
Entry 📈 : The vault is wide open! Swipe the Bullish loot at any price - the heist is on!
Place buy limit orders most recent or swing, low level for Pullback entries.
Stop Loss 🛑:
📍 Thief SL placed at the recent/swing low level Using the 4H timeframe (138.500) Day/Swing trade basis.
📍 SL is based on your risk of the trade, lot size and how many multiple orders you have to take.
🏴☠️Target 🎯: 147.500 (or) Escape Before the Target
🧲Scalpers, take note 👀 : only scalp on the Long side. If you have a lot of money, you can go straight away; if not, you can join swing traders and carry out the robbery plan. Use trailing SL to safeguard your money 💰.
💰💵💸USD/JPY "The Ninja" Forex Money Heist Plan is currently experiencing a bullishness,., driven by several key factors. .☝☝☝
📰🗞️Get & Read the Fundamental, Macro, COT Report, Quantitative Analysis, Sentimental Outlook, Intermarket Analysis, Future trend targets & Overall Score... go ahead to check 👉👉👉🔗🔗🌎🌏🗺
⚠️Trading Alert : News Releases and Position Management 📰 🗞️ 🚫🚏
As a reminder, news releases can have a significant impact on market prices and volatility. To minimize potential losses and protect your running positions,
we recommend the following:
Avoid taking new trades during news releases
Use trailing stop-loss orders to protect your running positions and lock in profits
💖Supporting our robbery plan 💥Hit the Boost Button💥 will enable us to effortlessly make and steal money 💰💵. Boost the strength of our robbery team. Every day in this market make money with ease by using the Thief Trading Style.🏆💪🤝❤️🎉🚀
I'll see you soon with another heist plan, so stay tuned 🤑🐱👤🤗🤩

USDJPY Technicals Price reacting near a key horizontal support level just below 145.00, where a visible bounce is attempting to form. This level has been tested multiple times, establishing it as a reliable demand zone, and price is now trying to stabilize after a sharp drop from the 146.20s. The recent move downward followed a failed bullish breakout attempt near a local resistance (highlighted with a red circle), which then turned into a supply zone around 145.70–145.80. That area has since capped further upside, resulting in a sell-off.
At current levels, there's a combination of technical signals suggesting a potential reversal or at least a short-term bounce. First, price has reached a structurally important area where previous buying interest was observed. Additionally, the Relative Strength Index (RSI) on the 30-minute chart shows values around 38–40, indicating the market is entering oversold territory without being extremely extended, which often aligns with corrective moves or base formations.
Volume analysis also supports the reversal idea. The recent bearish candles approaching the 145.00 support zone show decreasing bearish volume, followed by a slight uptick in buying pressure (as shown by the magenta lightning bolt icon), hinting at potential absorption of selling pressure and the beginning of buyer interest. This could mark the end of the down leg and the start of a higher low structure.
The projected path drawn on the chart suggests a bullish recovery scenario where price reclaims the mid-145s, retests prior minor resistance levels, and attempts to push toward the 146.00 handle again. However, this move is only valid if price holds above the current support. A breakdown below 144.90 would invalidate this idea and may lead to deeper downside.
In summary, the setup favors a bullish reversal off support, aided by RSI recovering from oversold conditions, a slowdown in bearish momentum, and historical support alignment. That said, price action confirmation (like bullish engulfing or a strong reclaim candle) is necessary to initiate a long position with tighter risk below the support base.

USD/JPY Multi-Timeframe Trading Plan – Week AheadUSD/JPY is trending higher short-term but remains below key resistance on the daily chart. The daily timeframe shows an inverted head-and-shoulders forming, with a neckline at 152. Until that breaks, rallies into 148–150 are likely to fade. The 1-hour chart shows a rising wedge from 142 to 148.5 with support around 145.0. Momentum is slowing, warning of potential exhaustion near 148.
On the 15-minute chart, recent price action shows a bull flag and a double bottom, offering buy zones at 146.10–146.30. The plan for early week is to long dips to this zone, targeting 146.80–147.20 with stops below 145.90. Watch for fades around 147.50–148.00 mid-week. A break above 148.00 opens room to 150.00; below 145.00, momentum shifts bearish.
Strategy: Buy pullbacks early in the week; fade rallies near 148 mid-week. Flip long above 148.00 or short below 145.00. Use tight stops and manage risk per trade.

USDJPY: Continue to increase in the uptrend channel!USD/JPY's next hurdle is 142.60-142.65. A break above could trigger short-covering, pushing the pair to 143.00, then 143.40-143.45. Sustained buying above 144.00 would confirm a near-term bottom and open the door for a significant rally.

USD/JPY "The Gopher" Forex Bank Heist Plan (Swing/Day)🌟Hi! Hola! Ola! Bonjour! Hallo! Marhaba!🌟
Dear Money Makers & Robbers, 🤑💰✈️
Based on 🔥Thief Trading style technical and fundamental analysis🔥, here is our master plan to heist the USD/JPY "The Gopher" Forex Market. Please adhere to the strategy I've outlined in the chart, which emphasizes short entry. Our aim is the Green Zone. Risky level, oversold market, consolidation, trend reversal, trap at the level where traders and bullish robbers are stronger. 🏆💸"Take profit and treat yourself, traders. You deserve it!💪🏆🎉
Entry 📈 : "The vault is wide open! Swipe the Bearish loot at any price - the heist is on!
however I advise to Place sell limit orders within a 15 or 30 minute timeframe most nearest or swing, low or high level for Pullback Entries.
Stop Loss 🛑:
📌Thief SL placed at the nearest/swing High or Low level Using the 1D timeframe (148.800) Day/Scalping trade basis.
📌SL is based on your risk of the trade, lot size and how many multiple orders you have to take.
Target 🎯: 140.000 (or) Escape Before the Target
💰💵💸USD/JPY "The Gopher" Forex Market Heist Plan (Swing/Day Trade) is currently experiencing a Bearish trend.., driven by several key factors.👇👇👇
📰🗞️Get & Read the Fundamental, Macro, COT Report, Quantitative Analysis, Sentimental Outlook, Intermarket Analysis, Future trend targets... go ahead to check 👉👉👉🔗🔗
Detailed Explanation Recap ✨
Fundamentals: Policy divergence + trade risks ⚖️ favor JPY 💪.
Macro: US slowdown 📉 + Japan resilience 🌱 lift JPY.
Global Markets: Risk-off flows 🛡️ + yield dynamics 📜 boost JPY.
COT: Speculative unwinding 📉 aligns with bearish pressure.
Seasonality: Mild JPY edge in April 🌸.
Intermarket: USD weakness 💸 across assets aids JPY.
Quantitative: Technicals confirm bearish 📉.
Sentiment: Broad bearish tilt 😟, retail as contrarian 🚨.
Trend Prediction: Downward bias 📉 across timeframes.
Outlook: Strong bearish case 🐻 with clear targets.
⚠️Trading Alert : News Releases and Position Management 📰 🗞️ 🚫🚏
As a reminder, news releases can have a significant impact on market prices and volatility. To minimize potential losses and protect your running positions,
we recommend the following:
Avoid taking new trades during news releases
Use trailing stop-loss orders to protect your running positions and lock in profits
💖Supporting our robbery plan 💥Hit the Boost Button💥 will enable us to effortlessly make and steal money 💰💵. Boost the strength of our robbery team. Every day in this market make money with ease by using the Thief Trading Style.🏆💪🤝❤️🎉🚀
I'll see you soon with another heist plan, so stay tuned 🤑🐱👤🤗🤩

USDJPY Long PositionUSDJPY pair is currently positioned at a key support zone, where price action has historically reversed direction. Following a recent rebound from this level, the pair retested the support area. Given the broader uptrend structure (characterized by higher highs and higher lows), this retest presents a potential opportunity to enter long positions, contingent on bullish confirmation at this critical juncture.
Key Observations:
Established Uptrend: The pair’s consistent upward trajectory on higher time frames supports a bullish bias.
Support Retest: The current pullback to the support zone aligns with typical price behavior in trending markets, where retests of prior levels often precede trend resumptions, but a decisive close below the support would invalidate the bullish setup, potentially signaling a trend reversal or deeper correction.
Risk Management Strategy: A prudent approach would involve placing a stop-loss below the support zone to protect against a breakdown, while targeting the next resistance level for profit-taking.
Final Assessment:
The setup aligns with bullish momentum, provided the support holds.

USDJPY: Analysis daily with me!USD/JPY is rebounding towards 142.50 in Tuesday's Asian session. Improved risk sentiment weakens the safe-haven Yen and supports the US Dollar. However, a Japanese holiday is limiting further upside.

USDJPY Short Term Buy Trading Plan Update!!!Hi Traders, on April 23rd I shared this idea "USDJPY Short Term Buy Trading Plan"
I expected bullish continuation higher from the marked Fibonacci support zones. You can read the full post using the link above.
Price reached the first Fibonacci support zone, respected it and bounced higher as expected!!!
If you enjoy this idea, don’t forget to LIKE 👍, FOLLOW ✅, SHARE 🙌, and COMMENT ✍! Drop your thoughts and charts below to keep the discussion going. Your support helps keep this content free and reach more people! 🚀
-------------------------------------------------------------------------------------------------------------------
Disclosure: I am part of Trade Nation's Influencer program and receive a monthly fee for using their TradingView charts in my analysis.
