#USDJPY: One Last Bullish Push Taking Price To 170!The USDJPY pair has been bullish for the past few months, evidenced by the extreme bullish volume in the market. Given the weakening JPY, we believe the price is likely to rise further. A final push could help us with our trading setup.
You might consider setting two take profit levels.
Like and comment for more.
Team Setupsfx_
Usdjpysetup

#USDJPY: Price Is Heading Towards 167, With Two Targets! Dear Fellow Traders,
UJ has reversed nicely from our entry zone, and the price is likely to head towards the 167 price range. We may see the price hitting our first target within a few weeks, while the second target will take longer. This is a swing target, and there will be many news events that will affect UJ’s future price.
For a better insight, please read the chart.
Team Setupsfx_

USD/JPY Price Outlook 📊 Technical Structure
FX:USDJPY USD/JPY remains under bearish pressure below the descending trendline and the 155.99–156.17 resistance zone. Price repeatedly failed to break through this area, signalling strong selling interest and reinforcing the broader downtrend structure.
The pair continues to oscillate toward the 155.20–155.02 support zone, where buyers have previously stepped in, but momentum still favours the downside as long as the market stays below 156.00. A retest of resistance followed by rejection would keep the bearish sequence intact. A confirmed breakout above 156.17 would invalidate this structure.
🎯 Trade Setup (Bearish Scenario)
Bias: Sell from resistance after rejection.
Entry: 155.99 – 156.17
Stop Loss: 156.40
Take Profit 1: 155.20
Take Profit 2: 155.02
Risk–Reward Ratio: ~1 : 2.4
The bearish idea remains valid while price remains below 156.17 on a 4H closing basis.
🌐 Macro Background (Simplified)
JPY fundamentals continue to lean supportive despite short-term fluctuations:
Markets expect the Bank of Japan to hike rates as early as next week, supporting the Yen and reinforcing policy divergence with the US.
The Federal Reserve delivered another rate cut, keeping the USD soft and maintaining downward pressure on USD/JPY.
Risk-on sentiment limits safe-haven demand for JPY, but BoJ’s tightening trajectory outweighs this, keeping upside capped.
Japan’s weaker fiscal outlook creates some hesitation among Yen buyers, yet does not offset the broader macro forces favouring JPY strength.
Overall, the macro environment aligns with the technical bias for further USD/JPY downside.
🔑 Key Technical Levels
Resistance Zone: 155.99 – 156.17
Support Zone: 155.20 – 155.02
Invalidation Level: 156.17 (4H breakout)
📌 Trade Summary
USD/JPY continues to respect the descending trendline and strong resistance near 156.00. As long as the pair remains capped below 156.17, the market maintains a bearish bias toward 155.20–155.02. Retests of resistance provide attractive short opportunities aligned with both technical and macro trends.
⚠️ Disclaimer
This analysis is for reference only and does not constitute trading advice. Trading involves significant risk, and proper risk management is essential.

Strengthening and moving upwards: a new impulseUSDJPY continues to form an upward structure after breaking out of consolidation. The upward movement is becoming more confident, while pullbacks remain limited, confirming buyer interest and strengthening the trend.
On the four-hour chart, a sequence of advances is visible, pointing to the development of an impulse. The market holds above key levels, creating a foundation for further growth and consolidation in the bullish direction.
The fundamental backdrop also supports the asset: demand for the dollar remains steady, and interest in risk assets reinforces the movement. This increases the likelihood of continued strengthening and the achievement of new targets.
Thus, USDJPY is in a growth phase, where the market’s next steps will determine the scale of the upcoming impulse.

USD/JPY — Next Bullish Wave? Entry Layers & Target Roadmap📌 Asset: USD/JPY — “THE NINJA”
📊 Market Type: Forex | Swing / Day Trade Opportunity Guide
📈 Trade Thesis — Bullish Structure With MA Pullback Confirmation
USD/JPY continues to hold a clean bullish structure, with price respecting the moving averages and maintaining upward momentum. The recent pullback into dynamic support offers a favorable zone for layered accumulation using the Thief-style entry map. This setup focuses on capturing continuation while managing exposure through structured limit layering.
Thief Strategy Layered Entry Zones (Multiple Buy Limits)
To maintain precision and reduce risk concentration, the plan utilizes multiple staggered limit orders:
Buy Limit Layer 1: 154.500
Buy Limit Layer 2: 155.000
Buy Limit Layer 3: 155.500
(📌 You may increase or reduce the number of layers depending on your own system.)
This layered method helps in catching deeper pullbacks while keeping average entry efficient.
🛡️ Risk Management — Adjust to Your Framework
Stop Loss:
🔐 Thief Protective Zone: 154.000
Dear Ladies & Gentlemen (Thief OG’s), this is simply my personal protective line.
You are encouraged to adjust your SL to fit your own strategy, volatility tolerance, and trade model.
🎯 Target Zone — Take Profit With Discipline
The upside is approaching a strong resistance region aligned with overbought metrics + potential trap behavior.
To avoid getting caught at the top, consider managing profits into:
🎯 Take-Profit Target: 157.800
Again, take profits according to your own structure — you make the money, you decide how to secure it.
🌐 Correlated Pairs to Watch ($) — Key Notes & Insights
1. TVC:DXY (US Dollar Index)
Strong USD strength supports bullish USD/JPY continuation.
If DXY pulls back sharply, USD/JPY may stall or dip into deeper layers.
2. NASDAQ:JPY Basket / Yen Weakness Indicators
Continued BoJ dovish tone = structural weakness in JPY.
Any sudden BoJ comments can create sharp volatility — monitor news carefully.
3. OANDA:XAUUSD (Gold vs USD)
Gold ↘️ usually supports USD strength → often correlates with bullish USD/JPY flows.
If gold spikes aggressively, USD might weaken temporarily.
4. FOREXCOM:SPX500 / US Indices
Risk-on sentiment → often weakens JPY (safe-haven outflows), creating USD/JPY upside pressure.
Risk-off can create temporary JPY strength.
5. TVC:US10Y / Bond Yields
Rising US yields → strong bullish driver for USD/JPY.
Always track yield momentum during major USD transitions.
📝 Final Thoughts
This plan blends structured Thief layering with a clean technical continuation setup. Manage position size, follow your own rules, and adapt based on live momentum.
Trade safe & stay sharp, Ladies & Gentlemen (Thief OG’s).
The Ninja moves fast — be prepared, be disciplined, and take profits with confidence.

USD/JPY Price Outlook – Trade Setup📊 Technical Structure
FX:USDJPY USD/JPY is trading around 155.00, struggling to break above the 155.05–155.18 Resistance Zone, where repeated rejections continue to maintain a short-term bearish bias. Price remains capped beneath this ceiling, with bearish wicks showing supply pressure.
The structure favours a pullback as long as price stays below 155.18. A clean hourly close above this level would invalidate the setup and indicate deeper recovery potential. On the downside, the 154.43–154.56 Support Zone remains the next magnet if rejection continues.
🎯 Trade Setup (Sell Bias)
Entry: 155.05 – 155.18
Stop Loss: 155.30
Take Profit 1: 154.56
Take Profit 2: 154.43
Risk–Reward Ratio: Approx. 1 : 2.23
Bearish idea remains valid as long as USD/JPY stays below 155.18.
A breakout and hourly close above this level invalidates the trade.
🌐 Macro Background
USD/JPY remains trapped in narrow consolidation on Friday, but the broader macro backdrop still favors JPY strength. Despite weak Japanese Household Spending falling 2.9% YoY, the market remains focused on rising expectations for a BoJ rate hike, supported by Governor Ueda’s recent hawkish remarks. Elevated Japanese government bond yields—10-year JGBs at the highest levels since 2007 and 20-year yields near 1999 highs—continue to narrow the rate differential and attract JPY buying.
Meanwhile, the US Dollar struggles to extend its rebound, even after upbeat US labor market data, as traders expect the Federal Reserve to cut rates next week. Fed expectations remain firmly dovish, marking a significant contrast to the BoJ’s tightening bias, keeping upward pressure on the Yen.
Traders remain cautious ahead of the US PCE inflation report, which will act as a key driver for both USD volatility and short-term direction in USD/JPY.
Overall, diverging policy expectations—BoJ hawkish vs. Fed dovish—maintain a bearish macro tone for USD/JPY.
🔑 Key Technical Levels
Resistance Zone: 155.05 – 155.18
Support Zone: 154.43 – 154.56
Invalidation Level: 155.30
Downside Targets: 154.56, 154.43
📌 Trade Summary
USD/JPY continues to face resistance around 155.18, holding a bearish intraday structure. The preferred approach is to sell rallies into the resistance zone, targeting a continuation toward 154.43–154.56. A move above 155.30 cancels the idea and signals a shift in momentum.
⚠️ Disclaimer
This analysis is for reference only and does not constitute trading advice. Trading involves significant risk, and proper risk management is essential.

USDJPY:Our First And Second Entries Are Active, Let's Take ThirdOur USDJPY trade has gained 1400 pips from our initial and second entry. We’re now looking for the third potential swing buy. We’ve identified a possible reversal point and have two target levels. Please adjust your take profit and stop loss according to strict risk management.
If you like our idea, please like and comment. Also, follow us for more!
Team Setupsfx_

USD/JPY Price Outlook – Trade Setup📊 Technical Structure
FX:USDJPY USD/JPY remains under pressure within a clear downtrend, capped by a descending trendline from recent highs. The pair has bounced off the 155.21–155.39 support zone, but any recovery is still unfolding below the key 156.08–156.27 resistance zone, where prior demand has turned into supply.
The chart shows a bearish continuation structure:
Resistance zone: 156.08 – 156.27
Support zone / target area: 155.21 – 155.39
As long as price remains below the descending trendline and 156.27, rallies into the resistance band are likely to attract sellers, with downside potential back toward the 155.39–155.21 support area. A 1H/4H close above 156.27 would warn that the bearish structure is breaking and could open the way toward 156.60+.
🎯 Trade Setup
Idea: Sell rallies into resistance, targeting a move back toward the 155.49–155.27 support zone.
Entry: 156.08 – 156.27
Stop Loss: 156.35
Take Profit 1: 155.39
Take Profit 2: 155.21
Risk–Reward Ratio: ≈ 1 : 2.64
Bias stays bearish while price holds below 156.08–156.27 on a closing basis. A sustained break above 156.27 would invalidate the short setup and call for a reassessment.
🌐 Macro Background
According to FXStreet, the Japanese Yen retains a bullish bias as comments from BoJ Governor Kazuo Ueda reinforced expectations for an imminent rate hike. Ueda signalled that if growth and inflation evolve as expected, the BoJ remains on track to raise rates further, pushing Japanese government bond yields to their highest levels in years and narrowing the rate gap versus other major economies. This supports the JPY and weighs on USD/JPY.
At the same time, the US Dollar has slipped to a nearly two-week low as markets increasingly accept that the Federal Reserve will cut rates again in December. Recent dovish remarks from several Fed officials, combined with softer US data, have strengthened rate-cut bets and pressured the USD, adding to the downside bias in USD/JPY.
Japan’s data backdrop is also mildly supportive for the Yen:
Capital Spending has risen for a third straight quarter (though at a slower pace),
Composite PMI sits at 52.0, pointing to modest private-sector expansion,
The government pledges prudent fiscal management while monitoring rates.
Overall, hawkish BoJ expectations + dovish Fed pricing + softer risk tone favour further downside in USD/JPY, aligning with the bearish technical setup.
🔑 Key Technical Levels
Resistance zone: 156.08 – 156.27
Support zone: 155.21 – 155.39
Invalidation level (bears): 156.35
📌 Trade Summary
USD/JPY remains locked in a downtrend beneath a descending trendline, with sellers defending the 156.08–156.27 resistance zone. As long as this ceiling holds, the strategy favours selling rallies into resistance and targeting the 155.39–155.21 support band. Divergent policy expectations—BoJ turning more hawkish while the Fed leans dovish—continue to support the bearish view on USD/JPY, though upcoming US data (ISM, later NFP/ISM services, etc.) could inject short-term volatility.
⚠️ Disclaimer
This analysis is for reference only and does not constitute trading advice. Trading involves significant risk, and proper risk management is essential.

USD/JPY – Strong Buy SetupUSD/JPY has retraced into a major demand zone, perfectly filling the fair value gap (FVG) created during the recent bullish impulse. When an imbalance is filled within an uptrend, price often uses that level as a base to continue higher.
A bullish hammer on the higher timeframe confirms strong buying interest, showing that buyers are defending this zone.
📌 Bias: Bullish continuation
🛡 SL: Below the demand zone
🎯 Target: Higher swing levels
This area offers a high-probability long setup supported by FVG fill and strong demand reaction.

USD/JPY Price Outlook – Trade Setup📊 Technical Structure
FX:USDJPY USD/JPY is trading lower after failing to sustain above the 156.65–156.89 resistance zone, with sellers defending this area and applying downward pressure. Price action has shifted into a corrective bearish structure, and momentum indicators show fading bullish strength.
The chart presents a bearish continuation setup:
Resistance zone: 156.65 – 156.89
Support zone / target area: 155.26 – 155.50
As long as the pair remains capped below 156.65, rallies toward resistance are likely to attract sellers, with downside potential extending toward the 155.50–155.26 support band. A 4H close above 157.04 would invalidate the bearish bias.
🎯 Trade Setup
Idea: Sell rallies into resistance, targeting a move toward the 155.50 support zone.
Entry: 156.65 – 156.89
Stop Loss: 157.05
Take Profit 1: 155.50
Take Profit 2: 155.26
Risk–Reward Ratio: ≈ 1 : 3.6
Bias remains bearish while price stays below 156.65–156.89 on a closing basis.
A clean break above 157.04 would invalidate the bearish structure.
🌐 Macro Background
According to FXStreet, USD/JPY remains under pressure as BoJ–Fed policy divergence shifts in favor of the Japanese Yen. Reports suggest the BoJ is ramping up its rate-hike messaging, keeping JPY supported.
Japan / BoJ:
The BoJ is stressing the inflation risks associated with a persistently weak Yen.
A December rate hike is now a live possibility.
Japan’s Services Producer Price Index rose 2.7% YoY, reinforcing tightening expectations.
United States / Federal Reserve:
Weak US data dragged the USD to a one-week low.
Fed official Stephen Miran signaled worsening labor conditions justify large rate cuts.
Markets widely expect a December Fed rate cut, weighing on USD.
Meanwhile, optimism around a Russia–Ukraine peace framework has boosted global risk appetite, slightly reducing safe-haven demand for the Yen — but BoJ tightening expectations remain the dominant driver.
Overall, stronger BoJ hawkish signals + weaker USD support a downside bias in USD/JPY.
🔑 Key Technical Levels
Resistance zone: 156.65 – 156.89
Support zone: 155.26 – 155.50
Invalidation level (bears): 157.04
📌 Trade Summary
USD/JPY has shifted into a bearish corrective structure, with sellers defending the 156.65–156.89 resistance area. As long as this zone caps price, the setup favours selling rallies toward resistance and targeting the 155.50–155.26 support region. A more hawkish BoJ combined with softer USD fundamentals strengthens the downside bias. Traders should watch upcoming US data releases for short-term volatility.
⚠️ Disclaimer
This analysis is for reference only and does not constitute trading advice. Trading involves significant risk, and proper risk management is essential.

#USDJPY: 1300+ Pips Swing Buy, Comment Your Views! Dear Traders,
We hope you are trading successfully.
The price has filled the liquidity gap and reversed positively with strong volume emerging. While the USD was extremely bearish, the DXY has begun to show bullish momentum which will directly affect the DXY and the future of the USDJPY.
We have identified two potential targets. The first is a nearby target. If the DXY continues to remain bullish we may see the price reach this target soon. The second target is a swing entry.
We wish you the best of luck and trade safely.
Team Setupsfx

USDJPY Correction Ahead!
HI,Traders !
#USDJPY will soon make
A retest of the rising support
Line and as we are bullish
Biased we will be expecting
A local bullish correction
!
Comment and subscribe to help us grow !

USDJPY Will Keep Growing!
HI,Traders !
#USDJPY is trading in an
Uptrend and the pair broke
The key horizontal level
Of 153.179 so we are
Bullish biased and we
Will be expecting a
Further bullish move up !
Comment and subscribe to help us grow !

USDJPY Edges Higher Above 155Today, USDJPY exhibited a oscillatory upward trend and broke through the key psychological level of 155, achieving a slight rise. However, constrained by the implicit risk of Japanese foreign exchange market intervention, there was no significant one-sided upward movement.
On the upside, core resistance is concentrated at the 155.6 level. After breaking through this position, the next strong resistance zone will be around 156.00, which will exert strong pressure on the exchange rate's upward movement.
Regarding downside support, the primary support lies in the 154.45-154.50 range. As a key range for the exchange rate's fluctuations in the early stage, this level possesses certain supporting strength. If this support is breached, the exchange rate may further decline to 153.50. Should this level also be broken, it may subsequently fall to the deeper support level of 152.10.

USD/JPY consolidates due to BoJ rate hike uncertaintyThe USD/JPY pair moved within a narrow range on Friday. The Japanese Yen (JPY) consolidated the previous day's sharp gains, while the US Dollar (USD) managed to gain slightly. The overall movement was limited by conflicting fundamental and political signals in both countries.
## Mixed Signals for the Japanese Yen (JPY)
- Weakness (Delaying Interest Rate Hike): Disappointing Japanese Household Spending data fueled speculation that the Bank of Japan (BoJ) could delay its next interest rate hike.
- Strength (Limiting Declines): However, the minutes of the BoJ's September meeting released last Wednesday maintained expectations for an imminent interest rate hike.
## Risks: USD gains were limited by two concerns:
- Economic risks stemming from the prolonged US government shutdown.
- Market speculation of further interest rate cuts by the Federal Reserve (The Fed).
## Downside Scenario (Bearish)
- Selling Trigger: An overnight break below resistance-turned-support at 153.30-153.25 favors further depreciation.
- Initial Key Support: Further declines are likely to find decent support near the 152.15-152.10 region (although the daily oscillator remains positive).
- Bias Reversal: Continued selling below the 152.00 mark will provide a fresh trigger for bearish traders and extend the decline from the February high.
## Bullish Scenario
- Initial Hurdle: A recovery above the 153.30-153.25 horizontal resistance will face resistance near the 153.65 area.
- Pivot Point: Sustained strength beyond the latter will allow USD/JPY to reclaim the 154.00 mark and retest the 154.45 supply zone. This level should act as a key pivot point.
- Further Targets: A break above 154.45 could lift the spot price to the psychological level of 155.00, and continue to 155.60 - 155.65 and the round number of 156.00.

USD/JPY Has a Bearish Trading BiasThe USD/JPY pair is currently stable, with the Japanese Yen (JPY) strengthening slightly against the weaker US Dollar (USD). This JPY strengthening halted the previous day's sharp decline, but the overall movement of USD/JPY is limited by conflicting fundamental factors.
1. Market Fundamental Factors
A. Support for the Japanese Yen (JPY)
BoJ Hawkish: The minutes of the Bank of Japan's (BoJ) September meeting released on Wednesday maintained market expectations for an imminent interest rate hike.
Intervention: Speculation that Japanese authorities might intervene to prevent further JPY weakness also offered support.
B. Limits to JPY Strength and Support for USD/JPY
BoJ Uncertainty: Investors remain uncertain about the exact timing of the BoJ's next interest rate hike. This uncertainty is fueled by expectations that the new Prime Minister, Sanae Takaichi, will pursue an aggressive fiscal spending plan and resist policy tightening.
Global Risk Sentiment: A moderate recovery in global risk sentiment tends to weaken the safe-haven JPY.
Strong USD: The US dollar (USD) held steady near its highest level since late May on the back of the US Federal Reserve's hawkish stance, which helped limit USD/JPY's decline.
2. USD/JPY Technical Analysis
USD/JPY has been struggling below the key resistance level of 154.40-154.45 for over a week. This zone serves as a pivot point that determines the direction of price movement.
A. Bullish Scenario ⬆️
Trigger for a Rise: A sustained breakout and acceptance above 154.40-154.45 will be a signal for bulls.
Next Target: Spot prices will aim to reclaim the psychological 155.00 level.
Continued Target: Continued buying will open the way to the 155.60-155.65 resistance level, before rising further towards the 156.00 level.
B. Bearish Scenario ⬇️
Initial Support: The 153.65 area is expected to offer support, followed by the overnight low around 153.00 - 152.95.
Selling Trigger: Acceptance below 153.00 could trigger technical selling.
Downside Target: The corrective decline will accelerate towards the intermediate support level of 152.55 - 152.50, and extend towards the 152.00 round number and last week's low at 151.55.
USDJPY remains bearish below the pivot zone, with the next directional move to be confirmed by a breakout from the current consolidation range.

USD/JPY Price Outlook – Trade Setup (6 Nov 2025)📊 Technical Structure
FX:USDJPY USD/JPY trades around 153.85, consolidating beneath the Resistance Zone (154.07–154.24) after failing to sustain its rebound from the 153.00 level. The recent rejection near 154.20 indicates selling pressure returning at prior supply levels.
The Support Zone lies between 152.88–153.04, which served as a strong demand base earlier this week. A confirmed breakdown below 153.50 could accelerate a retracement toward this area. Conversely, a sustained break above 154.30 would negate the bearish structure and resume the uptrend.
🎯 Trade Setup
Idea: Short from resistance, targeting retest of key support zone.
Entry: 154.07– 154.24
Stop Loss: 154.28
Take Profit 1: 153.04
Take Profit 2: 152.88
Risk–Reward Ratio: ≈ 1 : 5.72
A decisive hourly close above 154.28 invalidates the bearish setup.
🌐 Macro Background
The Japanese Yen (JPY) strengthens modestly during Thursday’s Asian session, buoyed by revived BoJ rate hike bets, though upside momentum remains limited due to policy uncertainty.
According to FXStreet’s Haresh Menghani, “The Japanese Yen attracts some buying as hopes for an imminent BoJ rate hike persist, though policy caution caps gains.” 【FXStreet】
BoJ Outlook: Minutes from the September BoJ meeting highlighted policymakers’ openness to raising interest rates, citing that the 2% inflation goal has been largely achieved. However, the central bank remains cautious amid external risks and weak global demand.
Fiscal Context: Japan’s new Prime Minister Sanae Takaichi continues to favour aggressive fiscal spending, dampening expectations of rapid monetary tightening.
USD Factors: The US Dollar remains firm after the ADP employment report showed 42,000 new private-sector jobs in October and ISM Non-Manufacturing PMI rose to an eight-month high, reinforcing the Fed’s hawkish bias.
Shutdown Impact: The US government shutdown, now in its 36th day, clouds near-term data reliability and limits aggressive USD buying despite strong fundamentals.
Overall, the Yen’s short-term strength is tempered by BoJ caution and global risk recovery, while the Fed’s hawkish stance continues to anchor USD/JPY above 153. Yet, with technical rejection from resistance and potential consolidation, a short-term corrective dip looks likely.
🔑 Key Technical Levels
Resistance: 154.07 – 154.24
Support: 152.88 – 153.04
Psychological Level: 154.00
📌 Trade Summary
USD/JPY is encountering resistance around 154.20 while forming lower intraday highs. The combination of BoJ rate speculation and Fed hawkish stability suggests a range-bound but corrective bias. The preferred setup is a short from 154.07–154.24, targeting a retracement to 153.00, provided price remains capped below 154.30.
⚠️ Disclaimer
This analysis is for reference only and does not constitute trading advice. Trading involves significant risk, and proper risk management is essential.

USDJPY Bullish Bias - MonthlyThe price formed a strong bullish marubozu candle (monthly) and I anticipate that price might tap into the mid-supply zone at 159

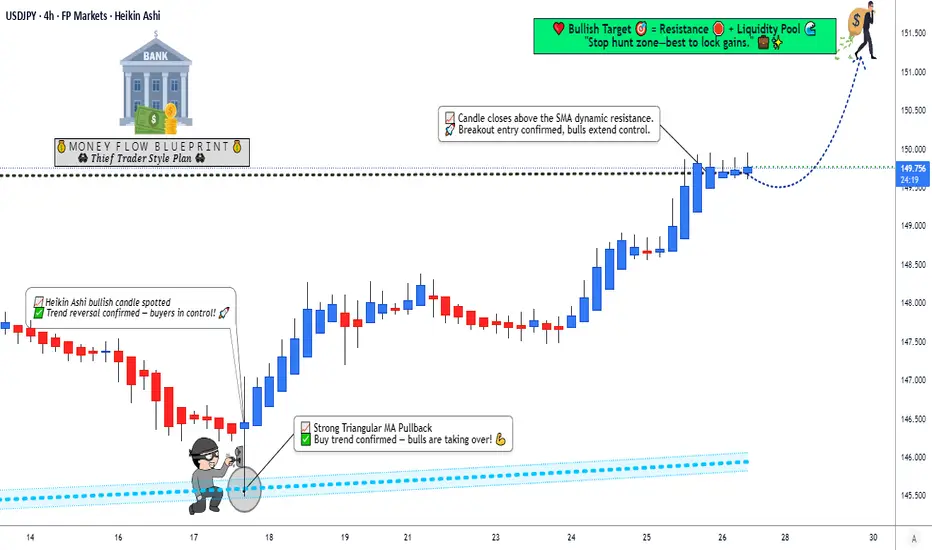
USDJPY Swing Setup – Breakout, Retest, and the Next Rally Ahead!💸 USD/JPY “Gopher” Profit Playbook | Thief Trader’s Swing Setup 💥
🧭 Market Plan:
The Bullish playbook stays active as USD/JPY shows a Triangular Moving Average breakout, followed by a pullback & retest phase.
Price is re-accumulating along the same moving average zone, hinting at strong momentum for the next escape rally 📈.
The MACD confirms bullish strength — showing healthy upward energy, backing this setup technically.
🎯 Entry Plan (Layering Style):
This setup follows Thief Trader’s Layering Strategy — using multiple buy limit orders to build a position dynamically across key zones.
💰 Buy Limit Layers:
150.000
150.500
151.000
151.500
(You can adjust or increase layers based on your own risk style.)
🛑 Stop Loss (Thief’s Guardrail): @149.000
⚠️ Note: Dear Ladies & Gentlemen (Thief OG’s) — this SL is my personal setup, not financial advice. Manage your risk your way.
🎯 Target Zone: @155.000
Reasoning: price may approach a strong resistance area, where overbought conditions + liquidity traps could emerge — it’s wise to secure profits before the crowd does.
⚠️ Note: Dear Ladies & Gentlemen (Thief OG’s), same here — this TP is my plan, adjust it to your own game.
🔍 Correlated Pairs to Watch:
💵 TVC:DXY (US Dollar Index): USD strength remains key. If DXY pushes higher, it’ll fuel this bullish USD/JPY wave.
💴 OANDA:EURJPY / OANDA:GBPJPY : Both show similar bullish continuation structures — momentum confirmation.
💰 OANDA:XAUUSD (Gold): Usually inversely correlated — a falling gold might support stronger USD/JPY moves.
💹 TVC:US10Y (US 10-Year Yield): Rising yields = strong USD, supportive to this trade’s thesis.
⚙️ Technical Key Points Recap:
✅ Triangular Moving Average breakout & retest (re-accumulation confirmed)
✅ MACD bullish crossover momentum intact
✅ Layered entry style allows position flexibility
✅ Clear invalidation & risk management level @149.000
✅ Exit target aligned with macro resistance near 155.000
🧠 Thief Trader’s Note
This playbook is designed for swing traders who prefer structured entries rather than single-point executions.
Thief’s layering strategy allows flexibility, averaging, and capital preservation while catching trend momentum.
🚀 Let's Ride This Wave Together!
✨ If you find value in my analysis, a 👍 and 🚀 boost is much appreciated — it helps me share more setups with the community!
#USDJPY #Gopher #ForexTrading #SwingTrade #TriangularMovingAverage #TMABreakout #ThiefStrategy #LayeredEntry #PullbackRetest #BullishSetup #ForexSignals #TechnicalAnalysis #ReAccumulation #ForexStrategy #TradingIdeas #RiskManagement #USD #JPY #DollarYen
Happy Trading & Stay Frosty! 🦊💰

USDJPY Local Short!
HI,Traders !
#USDJPY went up and made
A retest of the horizontal
Resistance of 153.179 from
Where we will be expecting
A local bearish pullback
And a move down !
Comment and subscribe to help us grow !

USD/JPY Price Outlook – Trade Setup📊 Technical Structure
FX:USDJPY USD/JPY is trading near a two-week high, supported by a steady uptrend line. Price is currently consolidating just below the resistance zone (153.23 – 153.30), with support holding at 152.80 – 152.90. The bullish bias remains intact as long as the uptrend line is respected.
📌 Trade Setup
Entry: 152.90 – 152.81 (pullback to support/uptrend line)
Stop Loss: 152.79 (below support)
Take Profit: 153.30 (resistance zone)
Risk–Reward (R:R): ≈ 1 : 4.44
🌍 Macro Background
The Japanese Yen remains under pressure as fiscal concerns dominate sentiment, with new Prime Minister Sanae Takaichi expected to continue expansionary spending policies, limiting the scope for rapid monetary tightening. While Japan’s Services PPI rose to 3.0%, bolstering the case for a future BoJ rate hike, it has failed to lift the Yen significantly.
Meanwhile, US CPI data (0.3% MoM, 3% YoY) has reinforced bets for a Fed rate cut this week, followed by another in December. This divergence between the Fed’s dovish stance and the BoJ’s cautious tightening outlook adds to market uncertainty. Traders are likely to remain cautious ahead of the Fed decision on Wednesday and the BoJ meeting on Thursday, making these central bank events critical for the next major move.
🔑 Key Technical Levels
Resistance: 153.23 / 153.30
Support: 152.80 / 152.75
Trendline Support: 152.90
Upside Extension (if breakout): 153.50 – 153.60
📋 Trade Summary
USD/JPY maintains a bullish bias as long as the pair holds above 152.80 support. A pullback entry near 152.90 offers a favourable risk–reward setup toward 153.30. However, traders should be prepared for heightened volatility around the Fed and BoJ policy announcements later this week.
⚠️ Disclaimer
This analysis is for reference only and does not constitute trading advice. Trading involves significant risk, and proper risk management is essential.

USD/JPY Bulls on the Move! Key Resistance Levels in Focus📈 USD/JPY "The Gopher" 🐹 — Forex Market Wealth Strategy Map (Swing/Day Trade)
Plan (Bullish Setup):
We’ve got a thief’s map unfolding here 👀. Confirmation builds as:
✅ Heikin Ashi Doji turning bullish
✅ Triangular Moving Average pullback
✅ Simple Moving Average breakout (dynamic resistance cleared!)
That’s our green light 🚦 for a potential bullish swing.
Entry (Layering Strategy 🧩):
The Thief Strategy = multiple limit orders, layered in style 🎭.
Buy limit layers: 149.000, 149.300, 149.600
(You can scale in further if price plays around your zone 📊)
This approach lets us sneak in like pros instead of going “all-in” at once 🔑.
Stop Loss (Risk Escape Hatch 🔓):
📍 Thief SL: 148.000
⚠️ Note: Dear Ladies & Gentlemen (Thief OG’s) — this is not a fixed rule. Manage your own risk wisely. You make money 💵, you take money 💼.
Target 🎯:
Resistance zone + overbought levels = possible trap.
Our escape target: 151.300 🏁
⚠️ Again — this is optional. Lock in profits where you feel comfortable.
🔍 Related FX Pairs to Watch:
OANDA:EURJPY — Often moves in tandem with JPY crosses.
OANDA:GBPJPY — A more volatile cousin, sometimes leading signals.
TVC:DXY (US Dollar Index) — Strength here adds weight to USD/JPY bullish bias.
OANDA:CHFJPY — Another JPY cross that can highlight safe-haven flows.
Correlation check keeps us one step ahead 🕵️.
✨ “If you find value in my analysis, a 👍 and 🚀 boost is much appreciated — it helps me share more setups with the community!”
⚠️ Disclaimer: This is a Thief Style Trading Strategy — shared for educational & entertainment purposes only. Not financial advice. Trade safe!
#USDJPY #Forex #SwingTrade #DayTrading #LayeringStrategy #TradingPlan #ThiefTrader #JPY #DXY #ForexStrategy
USD/JPY Bearish Channel Breakdown – Order Block Retest StrategyThe pair is clearly in a downtrend channel (bearish parallel channel).
Price has been respecting lower highs and lower lows, indicating consistent bearish pressure.
The recent bearish order block (OB) and support retest area are the key zones.
---
📉 Chart Structure Analysis
1. Bearish Channel:
Price continues to move inside a well-defined descending channel.
Each pullback toward the upper boundary has been followed by a new lower low.
2. Support Zone:
The price is currently testing a support level near 151.00.
There’s a temporary pause here — possibly a minor liquidity grab before further downside.
3. Bearish Order Block (OB):
The OB is around 151.700–152.000, acting as a strong supply zone.
If price retraces back to this OB, sellers might re-enter with strong momentum.
🔍 Strategy Plan
✅ Bearish Scenario (Most Probable)
Expect a retest of the OB zone (151.700–152.000) before continuing down.
Once rejection appears (bearish engulfing / pin bar / break of structure on smaller TF), enter Sell.
Target: 149.700 (previous swing projection).
Stop-loss: Above OB at 152.200.
Trade Setup Example:
Entry: 151.800 (OB retest)
SL: 152.200 (40 pips)
TP: 149.700 (210 pips)
Risk/Reward: ≈ 1:5.2 ✅
⚠ Bullish Scenario (Low Probability
If price breaks above 152.200 with strong bullish candles and retests it as support,
the bearish channel is invalidated → next target could be 153.000–153.500.
📊 Confirmation Tips
Before entering:
Check for bearish rejection candles on the 15m–30m timeframe.
Confirm with RSI divergence (bearish) or MACD crossover downward.
Watch DXY strength — if the dollar weakens, USD/JPY will likely drop.
🧭 Summary
Bias Entry Zone Stop Loss Target R:R Confidence
🔻 Bearish 151.7–152.0 152.2 149.7 1:5+ High
