USDJPY – DAILY FORECAST Q3 | W35 | D28 | Y25📊 USDJPY – DAILY FORECAST
Q3 | W35 | D28 | Y25
🔍 Daily Forecast | USDJPY
Here’s a concise breakdown of the current chart setup 🧠📈:
📌 Higher time frame order blocks have been identified — these are our patient points of interest 🎯🧭.
We wait for a confirmed break of structure 🧱✅ before executing any position.
This keeps us disciplined, and in sync with what the price action is actually telling us — not what we want it to say.
📈 Risk Management Protocols
🔑 Core Principles:
Max 1% risk per trade
Execute only at pre-identified levels
Use alerts, not emotion
Stick to your RR plan (minimum 1:2)
🧠 You’re not paid for how many trades you take — you're paid for how well you manage risk.
"Trade what the market gives, not what your ego wants."
Stay mechanical. Stay focused. Let the probabilities work for you. 🎯📊
FRGNT
FX:USDJPY
Usdjpyshort

USDJPY — Q3 W35 Mid-Week Forecast Top-Down Analysis | USDJPY — Q3 W35 Mid-Week Forecast - Top-Down Analysis |
mid-week forecast for USDJPY — let’s break it down top to bottom:
🕰️ Weekly Outlook:
No clear structure or trend bias from the weekly candle 🕯️
However, price closed below the Weekly 50 EMA 📉, leaving a bearish upper wick
This signals a possible continuation to the downside this week
But — as always — wicks tend to get filled first on lower timeframes before short setups play out
📌 Key Reminder:
"Sell from the highs, buy from the lows." 🔁
📆 Daily Structure:
Daily candles have been pushing into lower-timeframe POIs
This aligns with potential sell zones, building confluence
If candles continue to push up, we're watching closely for rejection from the Weekly 50 EMA
⚠️ Don’t be thrown off by a bullish weekly candle midweek — we're anticipating a rejection wick and bearish close.
Let structure confirm.
⏱️ Lower Time Frame Confluence:
🔻 Primary Short Bias (High Confidence Zone):
🔸 4H POI containing:
A clean Order Block (OB)
A void (imbalance)
🔹 Within that, a 1H OB + void adds strong confluence 🔐
Once price enters the zone:
⬇️ Scale to 5-min
Wait for Break of Structure (BoS)
Execute the short ✅
🔺 Optional Long Setup (If Structure Shifts):
While short bias is primary, longs are not off the table
A separate POI based on 4H / 1H / 15' exists for a possible long
If price hits this zone:
Wait for LTF BoS (1' or 5')
Consider long entries, only if confluence stacks
🧠 Key Takeaways:
Weekly close below 50 EMA = bearish tilt, but lower timeframe confirmation needed
Let the wicks fill before forcing shorts
Only take longs with strong confluence
As always — one trade at a time, risk managed, confluence stacked
Trade safe, stay disciplined.
FRGNT
FX:USDJPY

USDJPY – Downward Pressure Aiming Straight At 146.000?📉 USDJPY Under Pressure – Could the Drop Extend to 146.000 and Beyond?
The US Dollar continues to weaken across the board, and USDJPY is now showing strong bearish momentum on the H2 timeframe. The chart highlights several critical Fair Value Gaps (FVGs) and liquidity zones that could guide price action in the coming sessions.
📊 Technical Outlook (H2):
Recent rejection confirms supply pressure, opening the door for a deeper retracement.
Key FVG Zone between 148.57 – 149.52 acts as a short-term supply area.
As long as price trades below this zone, bearish continuation remains in play.
🔑 Levels to Watch:
147.94 – minor reaction zone.
146.56 – 146.03 → strong demand / liquidity pool; price may test these levels soon.
A clean break below 146.00 could open the path toward deeper downside targets.
⚡ What This Means:
With USD weakness persisting, USDJPY could face another significant leg lower. Traders should monitor liquidity grabs and confirmations around the 146.xx zone for potential setups.
🔥 Do you see USDJPY holding the 146.00 demand area, or will the sell-off accelerate further?
👇 Share your view in the comments!

USDJPY may drop to daily low!USDJPY from the daily there is a sideway move, with a strong rejection from the daily resistance 148.78. Today's price so far tested the daily high and currently from the hourly perspective price is creating multiple doji with liquidity grab from the daily resistance giving a high probability for the price to drop to daily support level.
A possible buy trade is high probable.

USDJPY – DAILY FORECAST Q3 | W34 | D21 | Y25📊 USDJPY – DAILY FORECAST
Q3 | W34 | D21 | Y25
Daily Forecast 🔍📅
Here’s a short diagnosis of the current chart setup 🧠📈
Higher time frame order blocks have been identified — these are our patient points of interest 🎯🧭.
It’s crucial to wait for a confirmed break of structure 🧱✅ before forming a directional bias.
This keeps us disciplined and aligned with what price action is truly telling us.
📈 Risk Management Protocols
🔑 Core principles:
Max 1% risk per trade
Only execute at pre-identified levels
Use alerts, not emotion
Stick to your RR plan — minimum 1:2
🧠 You’re not paid for how many trades you take, you’re paid for how well you manage risk.
🧠 Weekly FRGNT Insight
"Trade what the market gives, not what your ego wants."
Stay mechanical. Stay focused. Let the probabilities work.
FX:USDJPY

USDJPY – DAILY FORECAST Q3 | W34 | D20 | Y25📊 USDJPY – DAILY FORECAST
Q3 | W34 | D20 | Y25
Daily Forecast 🔍📅
Here’s a short diagnosis of the current chart setup 🧠📈
Higher time frame order blocks have been identified — these are our patient points of interest 🎯🧭.
It’s crucial to wait for a confirmed break of structure 🧱✅ before forming a directional bias.
This keeps us disciplined and aligned with what price action is truly telling us.
📈 Risk Management Protocols
🔑 Core principles:
Max 1% risk per trade
Only execute at pre-identified levels
Use alerts, not emotion
Stick to your RR plan — minimum 1:2
🧠 You’re not paid for how many trades you take, you’re paid for how well you manage risk.
🧠 Weekly FRGNT Insight
"Trade what the market gives, not what your ego wants."
Stay mechanical. Stay focused. Let the probabilities work.
FX:USDJPY

USD/JPY - Triangle Breakout (20.08.2025)The USD/JPY Pair on the M30 timeframe presents a Potential Selling Opportunity due to a recent Formation of a Ascending Triangle Pattern. This suggests a shift in momentum towards the downside in the coming hours.
Possible Short Trade:
Entry: Consider Entering A Short Position around Trendline Of The Pattern.
Target Levels:
1st Support – 146.82
2nd Support – 146.40
🎁 Please hit the like button and
🎁 Leave a comment to support for My Post !
Your likes and comments are incredibly motivating and will encourage me to share more analysis with you.
Best Regards, KABHI_TA_TRADING
Thank you.
Disclosure: I am part of Trade Nation's Influencer program and receive a monthly fee for using their TradingView charts in my analysis.

USDJPY – DAILY FORECAST Q3 | W34 | D19 | Y25📊 USDJPY – DAILY FORECAST
Q3 | W34 | D19 | Y25
Daily Forecast 🔍📅
Here’s a short diagnosis of the current chart setup 🧠📈
Higher time frame order blocks have been identified — these are our patient points of interest 🎯🧭.
It’s crucial to wait for a confirmed break of structure 🧱✅ before forming a directional bias.
This keeps us disciplined and aligned with what price action is truly telling us.
📈 Risk Management Protocols
🔑 Core principles:
Max 1% risk per trade
Only execute at pre-identified levels
Use alerts, not emotion
Stick to your RR plan — minimum 1:2
🧠 You’re not paid for how many trades you take, you’re paid for how well you manage risk.
🧠 Weekly FRGNT Insight
"Trade what the market gives, not what your ego wants."
Stay mechanical. Stay focused. Let the probabilities work.
FX:USDJPY

Everything’s Aligned: USDJPY Buy Setup Locked and LoadedHey friends 👋
I’ve prepared a fresh USDJPY analysis for you.
I’m planning to open a buy position around 146.631 or 146.451, targeting the 147.700 level.
Also, today’s upcoming U.S. economic data will play a key role from a fundamental analysis perspective.
Every single like you send is my biggest source of motivation to keep sharing these insights. Huge thanks to everyone supporting me 🙏

USDJPY Next Week | Short From 147.56 Targeting Liquidity SweepHere’s my outlook for USDJPY in the coming week.
If price rises to around 147.56 in the early part of next week (Aug 18–22), I believe it’s a good area to consider going short. This level has acted as resistance several times recently, and I expect it could hold once again.
If price fails to reach 147.56, I won’t take the trade — in that case, the risk-to-reward profile would likely deteriorate, and I prefer to avoid setups where my predefined advantage is weakened.
The stop loss should be placed above the white line. From experience, once price breaks above that line, it often continues to take out the highs above it. That’s why I believe placing a stop here is both reasonable and sufficient.
The purple line below marks a level where I expect price could extend to if it sweeps the liquidity (stop losses) resting around recent lows. This purple line is located roughly halfway between the previous low and the nearby high beneath it. Based on my years of trading experience, when price breaks a low, it rarely reverses immediately; more often, it continues a bit further before turning around.
For that reason, I allow a small buffer and set my take profit around the 0.382 Fibonacci level between those two price points.
My plan is to hold the short position until that level, then take profit and start looking for a potential long setup from there.
In my view, 147.56 is likely to be reached sometime next week, so I will post an update once we see how the market reacts.
This trade setup gives a risk-to-reward ratio of 6.5. Without including fees, the breakeven win rate for this trade would be approximately 13.33%. Knowing these figures in advance helps me avoid emotional trading.
If you often find yourself trading based on emotions, I recommend doing this type of pre-planning and quantifying your setups before execution — it can be a simple yet highly effective improvement.
I’ll be sharing updates on how this idea plays out, so if you want to follow along and see the outcome, consider following me here on TradingView.
---
*This post is for general informational and educational purposes only. It does not constitute financial advice, investment recommendation, or a service targeting specific investors, and should not be considered illegal or restricted information in any jurisdiction.*

USDJPY - ShortUSDJPY Analysis - SELL 👆
In this Chart USDJPY H4 Timeframe: By Nii_Billions.
❤️This Chart is for USDJPY market analysis.
❤️Entry, SL, and Target is based off our Strategy.
This chart analysis uses multiple timeframes to analyze the market and to help see the bigger picture on the charts.
The strategy uses technical and fundamental factors, and market sentiment to predict a BEARISH trend in USDJPY, with well-defined entry, stop loss, and take profit levels for risk management.
🟢This idea is purely for educational purposes.🟢
❤️Please, support our work with like & comment!❤️

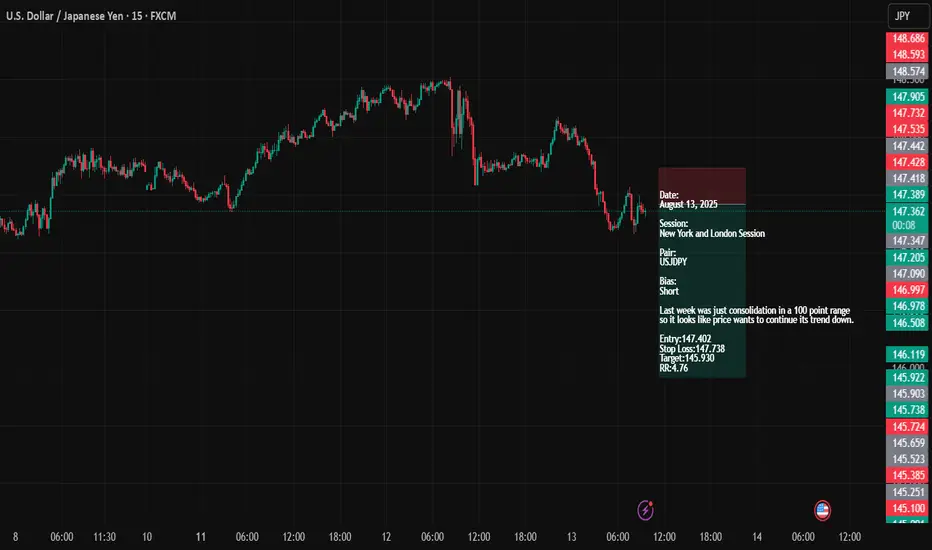
USDJPYDate:
August 13, 2025
Session:
New York and London Session
Pair:
USJDPY
Bias:
Short
Last week was just consolidation in a 100 point range
so it looks like price wants to continue its trend down.
Entry:147.402
Stop Loss:147.738
Target:145.930
RR:4.76
USD/JPY Poised for Breakout as Fundamentals & Technicals AlignUSDJPY is entering a critical juncture where both macroeconomic conditions and price structure are pointing toward a potential bullish continuation. The pair has been consolidating just under a descending trendline after a sharp drop from July’s highs, but strong US fundamentals, a persistently dovish Bank of Japan, and upcoming political catalysts are creating the perfect environment for an upside breakout. If buyers can reclaim momentum above near-term resistance, the path toward retesting multi-month highs appears open, with yen crosses likely to follow the lead.
Technical Analysis (4H Chart)
Price is consolidating around 147.46 after falling from the 150.91 high.
A descending trendline from the late-July peak is being tested. A confirmed breakout would likely accelerate bullish momentum.
Key upside targets:
148.96 – immediate resistance & short-term target (previous swing high).
150.91 – major resistance at July’s high.
Stop-loss at 146.43 safeguards against deeper retracements.
The structure reflects a series of bullish continuation patterns (flags, breakouts, retracements).
Fundamental Analysis
Current Bias: Bullish
USD Strength: Strong US data and anticipation of Trump’s “major” economic announcement are lifting the dollar.
JPY Weakness: Despite better-than-expected Japan Eco Watchers Survey, the BoJ’s ultra-loose stance continues to suppress yen demand.
Rate Differentials: Still heavily in USD’s favor, sustaining upward pressure on USD/JPY.
Risk Sentiment: Even with mild geopolitical tensions, USD’s safe-haven appeal is preventing JPY from benefiting.
Risks:
Disappointing US political announcements.
Hawkish surprises from the BoJ.
Sharp swings in risk sentiment favoring the yen.
Key News/Events Ahead:
Trump’s economic policy reveal.
US CPI & PPI releases.
BoJ policy signals or commentary.
Leader/Lagger Dynamics:
USDJPY is the leader for yen crosses, often setting the tone for GBPJPY, AUDJPY, and CHFJPY.
Summary:
USDJPY’s bullish outlook is reinforced by the combination of favorable fundamentals and a technical setup pointing toward a breakout. A move above 147.80–148.00 could open the door to 148.96 in the short term and 150.91 in the medium term. With yen crosses closely tied to USDJPY’s movements, this pair’s breakout could spark broader JPY weakness across the board, making it a pivotal chart to watch in the days ahead.

USDJPY Looks Bearish, Your thoughts ?USDJPY Looks Bearish, It has been falling hard after touching resistances. Now it will continue to glide. Check your support and resistances and open positions accordingly. Wait for Price Again and strong solid breakouts to enter the market.
Disclaimer:
The content presented in this IMAGE is intended solely for educational and informational purposes. It does not constitute financial, investment, or trading advice.
Trading foreign exchange (Forex) on margin involves a high level of risk and may not be suitable for all investors. The use of leverage can work both for and against you. Before deciding to participate in the Forex market, you should carefully consider your investment objectives, level of experience, and risk tolerance.
There is a possibility that you may incur a loss of some or all of your initial investment, and therefore, you should not invest money that you cannot afford to lose. Be fully aware of all the risks associated with foreign exchange trading, and seek advice from a licensed and independent financial advisor if you have any doubts.
Past performance is not indicative of future results. Always trade responsibly.

USDJPY Weakening or a Correction to the Uptrend✏️ OANDA:USDJPY is approaching the old Break out support zone. The convergence zone of the 2 EMA lines. If there is a sweep to the support zone at the beginning of the week, it will be an opportunity to buy to continue the bullish wave structure. When this 146.200 zone is broken, the uptrend will be broken and we have to wait for new momentum to determine the next trend.
📉 Key Levels
Support: 146.200-143.200
Resistance: 150.800-154.500
Buy zone 146.300 (Support & Trendline)
Buy zone 143.200 Strong support zone
Target 154.500
Leave your comments on the idea. I am happy to read your views.

USDJPY – DAILY FORECAST Q3 | W32 | D7 | Y25📊 USDJPY – DAILY FORECAST
Q3 | W32 | D7 | Y25
Daily Forecast 🔍📅
Here’s a short diagnosis of the current chart setup 🧠📈
Higher time frame order blocks have been identified — these are our patient points of interest 🎯🧭.
It’s crucial to wait for a confirmed break of structure 🧱✅ before forming a directional bias.
This keeps us disciplined and aligned with what price action is truly telling us.
📈 Risk Management Protocols
🔑 Core principles:
Max 1% risk per trade
Only execute at pre-identified levels
Use alerts, not emotion
Stick to your RR plan — minimum 1:2
🧠 You’re not paid for how many trades you take, you’re paid for how well you manage risk.
🧠 Weekly FRGNT Insight
"Trade what the market gives, not what your ego wants."
Stay mechanical. Stay focused. Let the probabilities work.
FX:USDJPY

USDJPY – DAILY FORECAST Q3 | W32 | D6 | Y25📊 USDJPY – DAILY FORECAST
Q3 | W32 | D6 | Y25
Daily Forecast 🔍📅
Here’s a short diagnosis of the current chart setup 🧠📈
Higher time frame order blocks have been identified — these are our patient points of interest 🎯🧭.
It’s crucial to wait for a confirmed break of structure 🧱✅ before forming a directional bias.
This keeps us disciplined and aligned with what price action is truly telling us.
📈 Risk Management Protocols
🔑 Core principles:
Max 1% risk per trade
Only execute at pre-identified levels
Use alerts, not emotion
Stick to your RR plan — minimum 1:2
🧠 You’re not paid for how many trades you take, you’re paid for how well you manage risk.
🧠 Weekly FRGNT Insight
"Trade what the market gives, not what your ego wants."
Stay mechanical. Stay focused. Let the probabilities work.
FX:USDJPY

USDJPY Strong Breakout!
HI,Traders !
#USDJPY made a bearish
Breakout of the rising support
Line and the breakout is
Confirmed so we will be
Expecting a further bearish
Move down !
Comment and subscribe to help us grow !


GBPJPY and USDJPY Analysis todayHello traders, this is a complete multiple timeframe analysis of this pair. We see could find significant trading opportunities as per analysis upon price action confirmation we may take this trade. Smash the like button if you find value in this analysis and drop a comment if you have any questions or let me know which pair to cover in my next analysis.

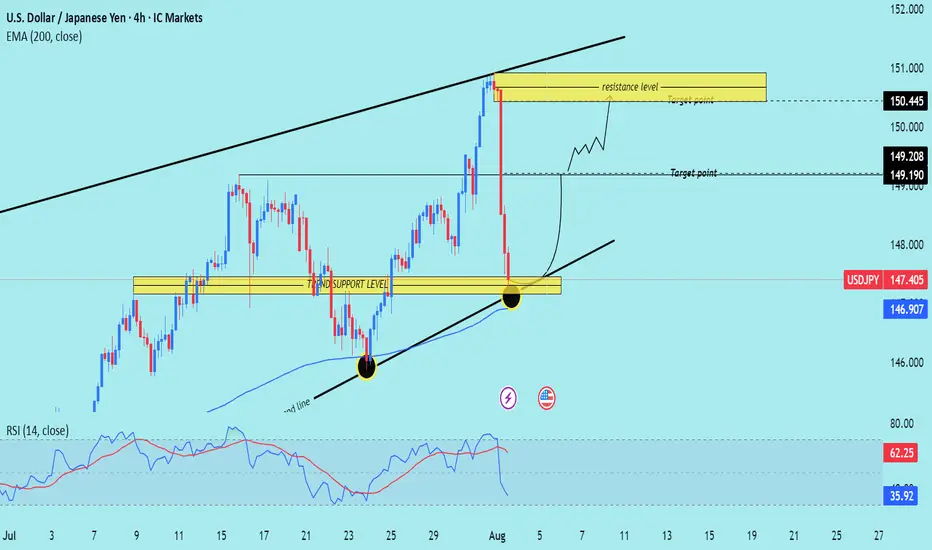
USD/JPY) Bullish trend analysis Read The captionSMC Trading point update
Technical analysis of USD/JPY on the 4-hour timeframe, using a combination of trendline support, key horizontal levels, and EMA 200 confluence to identify a potential bounce.
---
Technical Breakdown:
1. Market Structure:
USD/JPY experienced a sharp decline from the resistance zone near 150.445, but price is now testing a strong confluence support area:
Horizontal support zone
Rising trendline
200 EMA (146.907)
2. Support Confluence Zone:
Marked as "trend support level", this zone has historically acted as a springboard for bullish moves.
Recent price action shows a wick rejection at this zone, indicating buying pressure.
3. Resistance/Target Zones:
Target 1: 149.190 – 149.208
Target 2: 150.445 (major resistance zone)
4. EMA 200:
Price is reacting just above the 200 EMA, strengthening the bullish case for a bounce.
5. RSI (14):
RSI has dipped to 35.92, near oversold territory, suggesting the downside may be exhausted.
Prior bounce from similar RSI levels led to strong upward moves.
6. Projected Path:
The chart outlines a potential bullish recovery, targeting a climb back into the upper channel and retesting previous highs.
Mr SMC Trading point
---
Trade Idea Summary:
Bias: Bullish (Reversal from trendline + support zone)
Entry Zone: Current level near 147.40–146.90 (support confluence)
Targets:
TP1: 149.190
TP2: 150.445
Invalidation: Daily close below trendline and 200 EMA (~146.70 or lower)
Indicators: RSI supports a bounce; EMA and trendline confirm structure
Please support boost 🚀 this analysis)
USDJPY Setup: Prime Buy Zone with a Clear Target!Good morning my friends,
I've prepared a fresh USDJPY analysis just for you.
Currently, the most logical buy zone sits at 147.170. If price reaches this level and performs a retest, it’s likely to target the 149.185 level.
I'll personally be entering at 147.170 and waiting for my target: 149.000.
This setup is based on the 4-hour timeframe, so it may take some time to reach the target.
Every single like you give is a major source of motivation for me to keep sharing these analyses.
Thanks so much to everyone supporting with a like!

USDJPY Short from ResistanceHello Traders
In This Chart USDJPY HOURLY Forex Forecast By FOREX PLANET
today USDJPY analysis 👆
🟢This Chart includes_ (USDJPY market update)
🟢What is The Next Opportunity on USDJPY Market
🟢how to Enter to the Valid Entry With Assurance Profit
This CHART is For Trader's that Want to Improve Their Technical Analysis Skills and Their Trading By Understanding How To Analyze The Market Using Multiple Timeframes and Understanding The Bigger Picture on the Charts
